JAN ELIZABETH DEWATERS. Biological Activity on Granular
Activated Carbon in the Presence of Ozonated NaturallyOccurring Humic Substances. (Under the direction of FRANCIS
A. DIGIANO.)
Biological activity on granular activated carbon may
significantly enhance the water purification process.
Shifting the pathway for contaminant removal from adsorption
to biodegradation results in steady state reduction across
the GAC bed, and increases filter run time through
regeneration of sorptive capacity for non- or
slowly-biodegradable compounds. Trace contaminants present at low
concentrations and/or only seasonally may not meet minimum
growth and energy requirements of a biofilm population. The
presence of a bulk substrate source such as humic substances
could stimulate the growth of a biofilm which will, in turn,
degrade trace pollutants as secondary metabolites.
A fixed-bed column reactor with a high recycle ratio
was used to examine biodegradation and adsorption of
ozonated humic substances (HS). The percent biodegraded at
steady state increased with pre-ozonation, and with an
increase in EBCT (slower flowrate) and feed TOC
concentration. At an ozone dose of 1 mg 03/mg TOC, EBCT =
3.9 min, and feed TOC = 7 mg/L, approximately 43% of the HS
were biodegraded. Steady state biological activity, as
evidenced by CO2 production, was achieved within 1 day;
steady state TOC removal occurred after about 160 hours.
Phenol, when added at 50 /xg/L to the HS system, was degraded
within 60 hours. When phenol was added to an established
biofilm, it was immediately biodegraded.
The enumeration of viable cells from samples recovered
at different stages of biofilm growth indicates that the
density of viable cells continues to increase in the GAC bed, despite the achievement of steady state biologicalactivity. The density of viable cells in the GAC reactor
bed, as enumerated by plate counts, was on the order of 10ACKNOWLEDGEMENTS
This paper could not have been completed without the
help of my committee members. Thanks to Dr. Fred Pfaender,
for his input and advice from a microbiologist's point of
view, and to Dr. Singer for his moral and technical support,
which was valuable beyond words throughout my extended
2-year program here. A very special thanks is due for my
advisor Dr. DiGiano, for his direction, his encouragement,
and his seemingly endless reservoir of enthusiasm.
The microbiologists, Marj Aelion, Durell Dobbins, Mike
Swindoll, and Ou Jiang, were especially helpful, offering
advice and explanation, and putting up with an extra body in
what was already a crowded laboratory. And of course I am
grateful to Jim Garber, my laboratory elf, to Stefan
Grimberg, my extended pair of hands and head for a brief
period, and to Joe Pedit, my mathematical-genius consultant.
Well then there are the folks who make it all
worthwhile - the crazy ones in the basement (our castle),
David, Anne, Bill, Alex, Becky, Greg, Ed. It wouldn't have
been the same without them.Finally, and with all sincerity, I have to thank Tad,
Harriet, Tater, and Rasmus, for their emotional support from
the "real world", and for their somewhat unsuccessful
efforts to help me keep things in perspective.
This research was funded by the National Science
TABLE OF CONTENTS
Page
Acknowledgements...iii
Table of Contents...iv
List of Tables...vi
List of Figures...vii
Chapter 1. INTRODUCTION...1
1.1 Background...1
1.2 Ob j ectives...3
Chapter 2 . LITERATURE REVIEW...4
2.1 General Interest in Granular Activated Carbon...4
2 . 2 Biof ilm Development...6
2 . 3 Biodegradation Within the Biof ilm...11
2.4 Characterizing Biofilm Behavior:
Comparisons Between Free-Living and
Fixed-Film Bacteria...132.5 Degradation - Adsorption Interactions...17
2.6 Describing the Process: Biofilm Models...19
2.7 Secondary Substrate Utilization...22
2.8 The BAC Process: Contributions by Ozone....25
2 . 9 Phenol Biodegradation...27
2.10 Summary...3 0
Chapter 3. GENERAL APPROACH TO EXPERIMENTAL WORK...31
Chapter 4. RECOVERY OF VIABLE CELLS FROM THE GAC SURFACE...34
4 .1 Experimental Methods...34
4.1 Results and Discussion...46
4 . 3 Summary...75
Chapter 5. BIOKINETIC STUDIES: PHENOL METABOLISM BY
MICROORGANISMS RECOVERED FROM A HUMIC SUBSTANCES-GROWN BIOFILM...785.1 Experimental Methods...78
5.2 Interpretation of the Data...84
5. 3 Results...88
5.4 Discussion...93
Chapter 6. ADSORPTION AND BIODEGRADATION
IN FLOW-THROUGH REACTORS...1036.1 Background: Choice of Reactor Design...103
6.2 Adsorption and Biodegradation of Humic Substances...106
6.2.1 Experimental Methods...106
6.2.3 Summary: Effect of EBCT and Feed
Conditions on Humic Substances
Biodegradation...128
6.3 Biodegradation of Phenol in the Presence of Humic Substances...130
6.3.1 Background...130
6.3.2 Experimental Methods...131
6.3.3 Data Analysis...135
6.3.4 Results...136
6.3.5 Discussion...143
Chapter 7. DEVELOPMENT OF A BIOFILM ON OZONATED HUMIC SUBSTANCES...147
7 .1 Experimental Methods...147
7 . 2 Results and Discussion...149
7.2.1 Cell Densities...149
7.2.2 Metabolic Activity: Phenol Mineralization...155
7 . 3 Summary...159
Chapter 8 . CONCLUSIONS AND RECOMMENDATIONS...i...160
8 .1 Conclusions...160
8.2 Recommendations...162
LIST OF TABLES
Page
4-1 Summarized Data: Effect of Mixing Time on
Recovery of Metabolic Activity from GAC ...49
4-2 Calculated Results: Effect of Mixing Time on
Percent Recovery of Metabolic Activity from GAC...53
4-3 Cell Recoveries: Blending vs. Ultrasonication...57
4-4 Summarized Data: Effect of Chemical Treatment
on Recovery of Metabolic Activity from GAC...60
4-5 Calculated Results: Effect of Chemical Treatment
on Percent Recovery of Metabolic Activity from GAC...64
4-6 Summarized Data: Effect of Chemical Treatment onDesorption of Total Cells from GAC...66
4-7 Summary of the Effects of Chemical Treatment on
Percent Recovery of Total Cells and of Metabolic
Activity from GAC...68
5-1 Phenol Biodegradation Kinetic Data...89
5-2 Summary of Microbial Kinetic Parameters for the
Unexposed Population of Microorganisms ...94
5-3 Literature and Experimental Values for Phenol
Degradation Kinetic Parameters...98
6-1 Ozonation Operating Parameters...Ill
6-2 Operating Characteristics: Column Run Numbers 1-4;
GAC Columns Receiving Humic Substances, Varying
Feed Conditions and EBCT ...114
6-3 Summarized Results: Column Run Numbers 1-4; GAC
Reactors Receiving Humic Substances, Varying Feed
Conditions and EBCT ...129
6-4 Nutrient and Buffer Compositions...133
7-1 Operational Information: GAC Column Reactors
Used for Biofilm Development Study (Columns A-D)....151
7-2 Total and Viable Cell Densities Recovered at
Different Stages of Biofilm Development (Columns
LIST OF FIGURES
Page
2-1 Model Predictions of Effluent Substrate
Concentration from a Completely Mixed GAC
Reactor (after Chang, 1985)...21
3-1 A General Overview to the Experimental Approach...32
4-1 Schematic of Biofilm Removal Study...35
4-2 Methodology for Amino Acid Respiration Assay...44
4-3 Effect of PVP/PPi Solutions on Metabolic Activity
of Biofilm Microorganisms still in Contact with
GAC...474-4 Effect of Mixing Time on Recovery of Metabolic
Activity from a Biofilm into a Liquid Suspension:
Amino Acid dpm Respired per gm. GAC by Supernatant
Samples...50
4-5 Effect of Mixing Time on Recovery of Metabolic
Activity from a GAC Biofilm: Fraction Added Amino
Acids Respired by GAC Pellet Fractions...51
4-6 Effect of Mixing Intensity on Recovery of
Metabolic Activity from a Biofilm into a Liquid
Suspension: Phenol Respiration Rate vs.
Concentration for Microbial Samples recovered by
Blending and by Ultrasonication...58
4-7 Effect of Chemical Treatment on Recovery of
Metabolic Activity from a Biofilm into a Liquid
Suspension: Fraction Added Amino Acids Respired
per gm. GAC by Supernatant Samples...61
4-8 Effect of Chemical Treatment on Recovery of
Metabolic Activity from a GAC Biofilm: Fraction
Added Amino Acids Respired by GAC Pellet Fractions...62
4-9 Metabolic Activity of Original Composite Samples
used in Chemical Treatment Study: Fraction Added
Amino Acids Respired by Composite Sample...63
4-10 Adsorption of Amino Acids onto Virgin GAC: Solid
Phase vs. Liquid Phase Concentrations after 24
hour Incubation...70
Page
4-12 Adsorption of Amino Acids onto GAC Treated with
PVP/PPi Solution: Solid Phase vs. Liquid Phase
Concentrations after 24 hour Incubation,
Acidification, and Shaking 18 hours (60 rpm)...73
4-13 Profile of Amino Acid Adsorption onto GAC Treated
with PVP/PPi Solution, throughout Incubation,
Acidification, and Shake Procedure...74
5-1 Methodology for Biokinetic Studies...83
5-2 Rate of Phenol Metabolism vs. Substrate
Concentration, for an Unexposed Population of
Microorganisms Recovered from a Humic
Substances-Grown Biof ilm...91
5-3 Rate of Phenol Metabolism vs. Substrate
Concentration, for an Exposed Population of
Microorganisms Recovered from a Humic
Substances-Grown Biof ilm...92
5-4 Model Predictions for Phenol Utilization Rates by
the Unexposed Population of Biofilm Microorganisms...95
5-5 Total Phenol Utilization Rate vs. Substrate
Concentration for the Exposed and Unexposed
Populations...101
6-1 Schematic of Recycle Reactor Design...107
6-2 Schematic of Ozonation Apparatus...110
6-3 TOC Breakthrough Curve for Run No. 1: Untreated
Lake Drummond Water; TOC =25 mg/L; EBCT = 41.6
min/13 . 9 min...115
6-4 TOC Breakthrough Curve for Run No. 2: Ozonated
Lake Drummond Water (1 mg 03/mg TOC); TOC = 25 mg/L;
EBCT =13.9 min...117
6-5 Model Predictions for TOC Breakthrough Curves of
a Two-Component Mixture of Humic Substances:
Biodegradable/Slightly Adsorbable and
Non-Biodegradable/Adsorbable Components (from
Garber, 1987)...120
6-6 TOC Breakthrough Curve for Run No. 3: Ozonated
Lake Drummond Water (1 mg 03/mg TOC); TOC = 7 mg/L;
Page
6-7 TOC Breakthrough Curve for Run No. 4: Ozonated
Lake Drummond Water (1 mg 03/mg TOC); TOC = 7 mg/L;
EBCT = 3.9 min...124
6-8 Breakthrough Curves for TOC and DOC, and CO2
Production, in Run No. 4...126
6-9 TOC Breakthrough Curves and C02' Production for
Run No. 5 (Humic Substances from t = 0, Phenol from t = 210 hrs) and Run No. 6 (Humic Substances and Phenol from t = 0): TOC = 7 mg/L; EBCT =
3 . 9 min ...137
6-10 """^CO^ Production (Phenol Biodegradation) in Run Nos.
5 (Phenol from 210 hrs), 6 (Phenol from t = 0),
and 7 (Phenol from t = 0, no Humic Substances)...138
6-11 Shearing Loss of
ͣ
'
ͣ
^C-Labeled Cells in Run Nos. 5
(Phenol from 210 hrs), 6 (Phenol from t = 0), and 7
(Phenol from t = 0, no Humic Substances)...140
6-12 Total Phenol Metabolized vs. Total Phenol Applied,
in Run Nos. 5 (Phenol from 210 hrs), 6 (Phenol
from t = 0), and 7 (Phenol from t = 0, no HumicSubstances)...142
7-1 DOC Breakthrough Curves and CO2 Production for
Columns used in Biofilm Development Study:
TOC = 7 mg/L; EBCT = 3.9 min...150
7-2 Phenol Respiration Rate vs. Substrate Concentration,
by Microbial Samples Recovered from a Humic
Substances-Grown Biofilm at Different Stages of
Development: Rates Expressed per gm. GAC...156
7-3 Phenol Respiration Rate vs. Substrate Concentration,
by Microbial Samples Recovered from a Humic
Substances-Grown Biofilm at Different Stages of
\ /
1.1 Background
Activated Carbon is used in water treatment processes
for the removal of taste and odor causing compounds,
trihalomethane precursors and trace organics which may be present in a water supply. The combination of large
internal surface area (up to 100 m /gm) and surface-active
sites enables adsorption of a wide range of organic
molecules from solution. This also creates a favorable
environment for bacterial growth. Microorganisms are
attracted to the sorbed substrate, and a biofilm readily
develops. The presence of this actively growing biofilm could enhance the water purification process; in addition to adsorption, organic chemicals (both sorbed and in
solution) may be biologically degraded by the active
microbial population.
Granular activated carbon placed in columns or filter
beds takes advantage of microbial activity in the treatment
process, by providing a fixed surface to which biofilm can adhere. A biologically active GAC filter offers several
advantages over a purely adsorptive treatment process, as
well as over a process which is purely biological, such as a slow sand filter. Biodegradation lengthens filter run time by offering continuous regeneration of sorptive sites on the GAC surface. After extended operation, a steady state
removal rather than complete breakthrough of contaminants
degradable compounds. Moreover, adsorption can remove
contaminants in the event of a chemical spill, in which the microbial community may not be prepared to respond or may be
damaged by toxicity.
The characteristics of a biofilm which develops within a GAC bed depend to a large extent on the nature of organic substrate in the incoming water. A water may be rich in organic matter, but if these organics are not readily biodegraded, an active biofilm may not develop. In
addition, anthropogenic organic compounds present at
extremely low levels (jug/L to ng/L concentrations) or for
short periods may not meet minimum growth requirements of
the biofilm population.
The bulk of the organic content in most potable water supplies is comprised of humic substances, which are the macromolecular decomposition products of plant material.
Since humic substances are, by definition, the end products of decomposition, they are in general not easily
biodegraded. Some form of pre-treatment is needed to
enhance biodegradation of the humic substances, and thus to
promote biofilm development. Ozonation, sometimes used as a
disinfectant in water treatment, has been proposed as amethod for increasing the biodegradability of humic
substances and for encouraging biological activity in a GAC
treatment process.
The interactions between adsorption and biodegradation at the carbon surface and the extent to which biological activity will aid in the treatment process are not fully
understood. Increased removal of TOC in GAC filters due to
microbial activity is variable and depends on the nature of the organic matter. Preozonation may enhance biofilm
micropollutants which may be present in a water supply
seasonally and/or at low concentrations.
1.2 Objectives
This research is intended to develop a better
understanding of biofilm activity in a flow-through GAC
reactor receiving ozonated naturally occurring aquatic humic
substances, and to investigate the behavior of a traceorganic, such as phenol, in the presence of the humic
substances-grown biofilm.
The specific research objectives are as follow:
1. Develop a method to recover viable bacteria from the adsorptive carbon surface, in order to quantify biological activity and to enable biokinetic studies of micropollutant
degradation that utilize the microbial community indigenous
to the GAC.
2. Study the biokinetics of phenol metabolism by a
microbial community recovered from GAC colonized primarily
by bacteria adapted to ozonated humic substances.
3. Observe interactions between adsorption and
biodegradation of a trace amount of phenol in the presence
of ozonated humic substances in a laboratory scale,
fixed-bed reactor.
2.1 General Interest in Granular Activated Carbon
Carbon has long been known for its ability to remove
contaminants from water. Filtering water through charcoal
for purification is mentioned in Sanskrit writings, and
ancient mariners are said to have stored their drinking
water in charred wooden barrels to maintain purity (Symons,
1984) .
Modern use of granular activated carbon in the U.S.
began with the work of Rosen and Middleton (Braus et al.,
1951) , who used GAC to concentrate organic compounds from
the aqueous phase for later extraction and identification.
With respect to drinking water treatment, carbon was used
largely for the removal of taste and odor causing compounds.
Baylis conducted experiments with GAC as a water treatment
aid in the late 1920's in Chicago (Baylis, 1929), and in
1929 GAC beds were installed in Bay City, Michigan
(Harrison, 1940). During the 1930's, GAC filters were
installed in Dundee, Michigan (Finkbeiner, 1931), in Oshkosh
and Neenah, Wisconsin (Howson, 1938) , and in Culver City,
California (Harnish, 1937). Through the 1940's and 1950's,
powdered activated carbon (PAC) largely replaced GAC as a state-of-the-art method for water purification, but during
the 1960's interest in GAC was revived and by 1975 an
unpublished survey by the U.S. Environmental Protection Agency (USEPA) indicated that 28 water utilities in the U.S.
were routinely using GAC adsorption, while eight more were
to the Safe Drinking Water Act, which specify GAC as the
best available technology for removal of many of the
synthetic organic contaminants which will require monitoring (Cook & Schnare, 1986). .
Interest in biological growth on GAC filters, and in interactions between biodegradation and adsorption, is more recent than is interest in purely adsorptive mechanisms. In 1975, Eberhardt, Madsen, and Sontheimer showed that
contaminants in the effluent from a GAC bed would reach
steady state concentrations prior to complete breakthrough,
as indicated by such parameters as UV absorbance, chemical
oxygen demand (COD), and total organic carbon concentration (TOC). Biodegradation of influent substrate as well as substrate bound to the GAC surface was evidenced by
measurement of CO2 production and dissolved oxygen uptake
across the column (Eberhardt et al., 1975). From a
comparison between a sterile and a nonsterile pilot plant, Werner and co-workers (1979) conclude that microorganisms are responsible for about 60% of the total oxygen
consumption and CO2 production, while the remaining 40% is
due to abiotic processes. They note that microbial activity
increases filter efficiency and prolongs run time for GAC by continuous regeneration of sorptive sites.
The presence of bacterial and protozoan growth on GAC
has been documented with the aid of scanning electron
microscopy (Weber et al., 1978). Accumulation of bacteria on the GAC surface is said to follow a sigmoidal growth-type
curve (Bancroft et al., 1983; Cairo & Suffet, 1979).
Maximum population densities reportedly vary; Bancroft and co-workers report that populations increased to an
Q
approximate steady state of 10 cells/gm of dry carbon,
cells/gm, for carbon used in drinking water treatment (Van
der Kooij, 1976; Cairo et al., 1979). Maximum numbers
attained have been described as a function of both substrate
availability and influent bacterial density (Bancroft et al., 1983).
Several attempts have been made to identify microbial
populations associated with GAC filters. In a study carried
out at a water treatment plant on the Rhine River, Werner
and co-workers found a more diverse population in the filter
influent than in the effluent. The fraction of bacterial
strains belonging to the genus Pseudomonas was found to
increase from 55% in the raw water, to 80% in the filter
effluent (Werner et al., 1979). In a 6 month pilot plant
study investigating the removal of synthetic organic chemicals by GAC, bacterial analyses identified the
predominant bacteria isolated from effluent and core samples as gram negative fermenters and Bacillus species;
Pseudomonas aeruginosa were occassionally detected in the
effluent in low numbers (Donlan et al., 1981). Research performed in a GAC treatment study on the Delaware River
identified species of the genus Pseudomonas as most
predominant; several Bacillus species were also detected
(Cairo & Suffet, 1979).
2.2 Biofilm Development
Bacteria have long been known to accumulate on
submerged surfaces. Zobell and Allen, in 1935, found that
marine bacteria accumulated on glass surfaces and became
firmly attached after only one to two hours. In 1943, Zobell determined that incubation bottles with a higher
1. In conditions of low substrate concentration, the
accumulation of nutrients at the solid/liquid interface will
enhance biological growth.
2. Solid surfaces may retard the diffusion of exoenzymes away from the cell, promoting assimilation of nutrients
which must be hydrolyzed extracellularly.
Additional advantages for microbial attachment include the
following (Marshall, 1976; Characklis, 1973):
3. Biomass accumulated at the surface can be utilized for
sustenance during periods of starvation.
4. Biomass can remain fixed within a flowing environment, and receive a constant supply of fresh nutrients without
motility requirements.
5. Predation is reduced by the protection of the
surrounding media.
6. Extracellular enzymes may be shared between bacteria.
The accumulation of bacteria at the solid/liquid
interface results in the formation of a biofilm, which is
generally a very adsorptive and porous structure, greater
than 95% water. Biofilms can be a monolayer of cells or asmuch as 3 0 to 40 centimeters thick, as observed in algal
mats (Characklis, 1984).
Biofilm development, as described by Characklis (1984),
involves five processes:
1. transport of organic molecules to the surface;
2. adsorption of organic molecules to the wetted surface,
4. metabolism by attached microbial cells resulting in more
attached cells and associated material; and,
5. detachment of portions of the biofilm.
Marshall and co-workers (Marshall et al., 1971a & b; Marshall & Cruickshank, 1973; Marshall, 1976) propose that
the attachment process involves two distinct phases. Phase
1 is an almost instantaneous phase, where bacterial adhesion
is relatively weak and reversible. Phase 2 is irreversible
film attachment, requiring an "incubation period" during
which exocellular polymers are produced to achieve firm adhesion. During initial attachment, both motile and
nonmotile bacteria remain in motion. At this stage the
bacteria remain some small but finite distance from the
surface by physical forces which result from a balance of
Van der Waals attractive forces and electron double layer
repulsion (Marshall et al., 1971a).
Culture age, time, temperature, and growth phase all
affect Phase 1 attachment (Fletcher, 1977). Findings
indicate that cells adsorb best in log growth and worst during death phases, that the number of attached cells is
proportional to solution phase bacterial concentration until
saturation is reached, and that the rate of adsorption is
proportional to temperature. The total adsorption capacity
has been found to be independent of temperature and solution
phase population density. Breyers and Characklis (1982)
have also observed, when feeding a biofilm reactor from a
chemostat, that the rate and extent of attachment is directly proportional to growth rate in a mixed culture
system.
A change in pH can cause cells to sorb or desorb due to
found by Werner and co-workers, however, for changes in pH
from 5 to 8, nor temperature dependence between 5°C to 37°C,
for bacterial loadings on carbon (Werner et al., 1979).
Phase 2 attachment, according to Marshall et al.
(1971a), includes the bacterial production of exocellular
polymers. Characklis (1984) has also included this
phenomenon as the fourth step of biofilm development.
Zobell (1943) was first to suggest that firm attachment
of bacteria to surfaces was mediated by some sort of
adhesive bacterial secretion. Corpe and co-workers (Corpe,
1970a & b, 1972, 1973; Tosteson & Corpe, 1975) observed
that marine bacteria attached to surfaces produced an
exocellular polysaccharidic material which was found to be an acidic mucopolysaccharide composed mostly of polyanionic carbohydrates.
The relationship between the growth rate of Pseudoroonas aeruginosa and the rate of exocellular polymeric substance
(EPS) production under carbon limited conditions is
quantified in a detailed study presented by Robinson and
co-workers (Robinson et al., 1984). They investigated theextent to which growth rate affected EPS formation, and the fractionation of glucose consumption between EPS formation and purposes other than cellular reproduction. Their
findings indicate that EPS was both growth and non-growth associated. Approximately 0.2 mg of polymer were formed per
mg total glucose consumed; the fraction of glucose
converted to EPS by P. aeruginosa was greater at lower
growth rates. Others have also found that the extent of
polymer formation is inversely proportional to the
p. aeruginosa leads to significant overestimation of
cellular yields, since such a large portion of energy and
carbon is diverted to EPS formation. Differences in this
study are as follows; Y = 0.6 mg cellular carbon/mg glucose carbon consumed (neglecting EPS production) and Y = 0.3 mg
cellular carbon/mg glucose carbon consumed (accounting for EPS production). This is significant in light of the number of studies which use results obtained from suspended growth
cultures to describe biofilm behavior (Chang & Rittmann,
1987; Namkung & Rittmann, 1986a & b; Rittmann & McCarty,
1980a & b; Speitel & DiGiano, 1987; Stratton et al., 1983).
A need for calcium and magnesium ions in secondary
attachment has been observed. Marshall (1976) found that
irreversible attachment failed to occur in the absence of
both ions, while the addition of either was sufficient to
allow attachment to proceed. Turakhia et al. (1983)
observed a dramatic increase in biofilm detachment with the
addition of EDTA, a calcium-specific chelant, emphasizing
the importance of calcium to biofilm adhesion.
In addition to solution phase properties,
characteristics of the solid surface affect bacterial
attachment. Increased rates of attachment may be encouraged by a rough surface, which provides more surface area as well
as some degree of protection from fluid shear, which may
promote detachment (Characklis, 1984). Surfaces with lower
energy have been found to retard cell adhesion; precoating
exposed surfaces with a synthetic cationic polymer may
significantly enhance initial biofilm attachment. Attachment in waters of low hardness, also, may be
encouraged by the addition of divalent cations not only to the solution phase but to the solid surface as well.
Given that bacterial attachment and accumulation will
condition of steady state which is ensured by the
equilibrium maintained between cellular attachment and reproduction, and microbial decay and detachment.
Characklis (1984) notes that detachment occurs from the
moment of initial attachment, and results from two distinct
contributions: shearing and sloughing. Shearing refers to the continuous removal of small portions of biofilm, and is highly dependent on hydrodynamic conditions within the
fluid. The rate of shearing increases with biofilm
thickness and fluid shear stress at the fluid/biofilm
interface. Sloughing refers to the random removal of large sections of biofilm and is generally attributed to nutrient
or oxygen limitations deep within the film, or to some dramatic change in the environment. Sloughing is more
frequently observed in thick biofilms in a nutrient rich environment, such as a trickling filter wastewater treatment
process.
Detachment may also result from chemical treatment.
Oxidizing herbicides, chlorine, XJV radiation, surfactants, and non-oxidizing biocides all will promote biofilm
detachment to some degree.
2.3. Biodeqradation Within the Biofilm
Biofilms are responsible for the removal of soluble and
particulate contaminants from natural streams as well as in
engineered treatment processes (Characklis, 1984). In natural waters, biofilms may determine water quality by
influencing dissolved oxygen levels and may serve as a sink for many toxic and/or hazardous materials.
The rates of fundamental microbial processes within a biofilm are difficult to measure and are generally inferred
(2) electron acceptor consumption (e.g., dissolved oxygen depletion), (3) biomass production, and (4) product
formation (Characklis, 1984).
Substrate utilization within the biofilm is usually
assumed to follow the Monod kinetic model:
dS dt
k«s«x
Kg + S
(2-1)
where S = substrate concentration within
the biofilm (mass/vol)
k = maximum rate coefficient
(mass substrate/biomass-hr)
X = biomass concentration (mass/vol)
Kg = half saturation coefficient
(mass/vol)
t = time
(Utilization is considered to be a positive quantity.)
Utilization rates in the biofilm may be controlled by mass transfer limitations within the biofilm (Rittmann &
Mccarty, 1980a). Mass transport within the biofilm is
governed by molecular diffusion, which is related to
substrate concentration by Pick's law:
Flux = -Df---.
dS dz
(2-2)
where D^ = molecular diffusivity of
substrate in biofilm (L /time)
A material balance over an element of biofilm at steady state yields:
(Flux in) - (Flux out) - (Reaction Rate) = 0
d^S k'X'S
Df --; = ---• (2-3)
dz^ Kg + S
utilization rates within the biofilm may also be
controlled by mass transfer limitations in the bulk fluid (Characklis, 1984). At low fluid velocities, a thick mass
transfer boundary layer can cause fluid phase mass transfer
resistance, which will serve to decrease substrate '--.^
concentrations at the fluid-biofilm interface and as a result will reduce the rate of utilization. This same
phenomenon could be caused by a dilute liquid phase
substrate concentration.
Substrate removal rates increase with an increase in
biofilm thickness until a critical thickness is reached,
beyond which removal remains constant. Trulear and
Characklis (1982) observed that this critical thickness
increases with bulk substrate concentration. Once the
biofilm thickness exceeds the depth of substrate penetration
(as determined by bulk substrate concentration and substrate
utilization rates), removal rates will be unaffected by additional cells.
2.4 Characterizing Biofilm Behavior;
Comparisons Between Free-Living and Fixed-Film Bacteria
In characterizing the kinetics of biofilm degradation,
a common approach has been to use suspended cultures to
determine parameters of the Monod equation for metabolism of
1987; Namkung & Rittmann, 1986b; Rittmann & McCarty,
1980b; Speitel & DiGiano, 1987; Stratton et al., 1983).
Parameters obtained in such studies are then used to predict
the metabolic behavior of a biofilm grown in a flow-through
system which has been seeded, usually, with organisms from
the suspended population.
While the same principles of substrate utilization and
microbial growth kinetics apply to both fixed-film and
suspended-growth cultures, some differences in activity have been noted. Attached organisms are generally found to be
more active in taking up nutrients, and are more resistant
to such environmental stresses as starvation, heavy metals,
and chlorine (Herson et al., 1987).
The applicability of stoichiometric data obtained in suspended culture to describe steady state biofilm processes
was investigated in a study by Bakke and co-workers (1984). Their work suggests that, at a 5% level of statistical
significance, there is no difference in substrate removal
rates between chemostat data and combined chemostat/biofilm
data. Furthermore, the biofilm growth rate data correlate
well with chemostat data, supporting the use of chemostat
derived kinetic coefficients to predict biofilm behavior.
Several investigators have used experimental techniques
in a laboratory chemostat reactor to c[uantify rate and
stoichiometry of fundamental processes within a biofilm
(Breyers & Characklis, 1982; Trulear, 1983). Results
suggest that chemostat-derived expressions may be used
successfully to predict biofilm behavior in some cases. Important questions still remain, however, with respect to exocellular polymer production and microbial detachment.
Differences between the physiology of suspended-growth
differences in their metabolic behavior. We might also question whether a heterogeneous population of
microorganisms which colonizes a granular activated carbon
filter in a water treatment process will behave similarly to cultures grown under conditions which basically select for
degraders of the specific substrate or substrates under
investigation. These uncertainties could be circumvented by
utilizing the GAC-colonized microbial population in
laboratory studies to determine biokinetic parameters. This
more closely simulates conditions of the system about which predictions are to be made; thus, there should be greater
confidence in the applicability of results.
In order to use the GAC biofilm population in a
metabolic degradation study, the bacteria must first be removed from the carbon surface with minimal alteration of their metabolic activity. Methods have been presented in the literature for removal of viable bacteria from soil
samples utilizing a variety of enzymatic, ionic, and
polymeric substances in combination with blending, mixing,
or homogenization (Balkwill et al., 1975, 1977; Bone &
Balkwill, 1986; Macdonald, 1986). Balkwill et al. (1975)
report a procedure whereby a soil sample suspended in sodium pyrophosphate solution (PPi, 0.1%) is subject to a series of blending and sonication treatments separated by slow speed
centrifugation. This method, followed by additional
centrifugation (15 centrifuge washes at 650xg) is said to
have recovered 90% to 99% of a sample of Arthrobacter
globiformis cells added to sterile and non-sterile soil (Balkwill, et al., 1977). Cells are recovered in the
supernatant fraction from each centrifuged sample. In later
work. Bone and Balkwill (1986) recommend the polymer
polyvinyl pyrrolidone (PVP, molecular weight ranging from 10,000 to 360,000) as a releasing agent for all types of
flotation studies. The material is said to release
unsaturated samples, although without physical agitation only 3.4% to 10.1% of the viable cells are recovered.
An entirely different procedure has been reported for removal of viable cells from colonized samples of granular activated carbon (Camper et al., 1985a). Homogenization of
carbon particles at 16,000 rpm (4°C) with a mixture of
Zwittergent 3-12 (10~^ M), EGTA (10"^ M), tris buffer (0.01 M, pH 7.0), and peptone (0.01%) recovered approximately 90%
of a known concentration of Escherichia coli attached to a sample of GAC (10 cells per 0.1 gram carbon).
Cell recoveries in these studies have been determined
by colony forming unit counts. Cell densities in
supernatant samples are compared with those remaining in the pellet fraction, or with densities in the original untreated
sample. While this method is preferable to a total cell
count because only viable cells are enumerated, results may
be biased. By definition, a viable cell plate count will
only indicate the presence of microorganisms capable of utilizing nutrients present in the media chosen for growth. Cells which are viable yet unable to metabolize the media
will go undetected. Extremely small colonies
("microcolonies") may develop, yet also go unobserved due to
their size. Furthermore, a plate count is especially
inapplicable to samples containing solid material since, while a particle may be inhabited by several bacteria, only one colony per particle is likely to be detected in the petri dish. This problem is often compensated for by
introducing a normalizing factor to multiply up solid sample
plate counts; this however introduces additional bias into the procedure by assuming a constant cell density per
particle. The difficulties involved in quantifying biofilm
bacteria raise questions regarding the actual cell
2.5 Biodeqradation - Adsorption Interactions
The presence of an adsorptive media may affect
substrate utilization within the biofilm by altering solution phase concentrations, as well as by providing
substrate at the biofilm/solid interface. The "biological
activated carbon" (BAG) process refers to a granular
activated carbon filter in which biological activity is
encouraged. The mechanisms involved are similar to those of
a slow sand (biological) filter, except that interactions between adsorption and biodegradation enhance contaminant
removal. These interactions may be important not only during the initial stages of filter operation, before
biological activity becomes significant, but also in the event of a chemical spill in that surface area is provided
to adsorb non- or slowly-degradable molecules. Many
compounds which may be toxic at higher levels will adsorb to the GAC surface, effectively reducing solution phase
concentrations to non-toxic levels which can be managed by the microbial population. Alternatively, compounds present
at concentrations below those necessary to support a
community of specific degraders may sorb and be accumulated
until, again, a manageable concentration is reached for
biodegradation to proceed.
The influence of GAC on bacterial metabolism was
investigated by Werner and co-workers (1979), using phenol
as a substrate. They found that at 0.3 mg/L phenol the
presence of GAC has a negative influence on utilization. At
such low concentrations carbon hinders microbial metabolism.
At 2.5 mg/L phenol, however, they noted utilization only in
the presence of GAC. This concentration is evidently toxic, and the adsorptive surface tends to decrease solution phase
Higher metabolic activity has been detected on GAC than
on non-adsorptive media. Speitel and DiGiano (1983) present an investigation of biofilm degradation on GAC vs. that on
glass beads in which GAC, preequilibrated with phenol at 0.5
to 1.2 mg/L, was used in an effort to eliminate adsorption.
Their results show enhanced phenol biodegradation in the GAC
system, due presumably to the availability of sorbed substrate. The same phenomenon was shown at higher
concentrations by Li and DiGiano (1983). Higher specific
growth rates and biodegradation rates of o-cresol,
acetophenone, phenol, and benzoic acid were detected on GAC
as compared to sand or glass beads. The enhanced specific growth rate increased with sorbed substrate concentration.
A decrease in particle size also gave rise to increased
growth rates, suggesting the importance of internal
diffusion to the rate of resupply of substrate to the
biofilm.
While many authors suggest interactions between the
activated carbon surface and attached microorganisms, others
claim that long-term contaminant removal is due not to
biodegradation but to a slow adsorption process. Peel and
Benedek (1983) used a dual rate adsorption kinetic model to
predict purely adsorptive behavior in packed columns. The
model suggests a two-step adsorption process consisting of
diffusion into the macropores and then, more slowly, into the micropores of the GAC. Although biological activity was
documented in their experimental column, as detected by
oxygen uptake and microscopic examination, they conclude
that relatively degradable organics are oxidized but that
materials which resist degradation will either adsorb or
pass through the process unaltered. Continued removal of
substrate after long operating times, they propose, is due
not to biodegradation but to the slow kinetics of adsorption
2.6 Describing the Process; Biofilm Models
A great deal of interest during the past decade has
been directed toward understanding the fundamental processes
involved in biofilm degradation, both in the presence and in the absence of adsorption. A major thrust of the research
has been to develop models which describe adsorption and
biofilm degradation, for single and multiple substrate
systems. ,
In 1976, Williamson and McCarty presented a basic
biofilm model which idealizes the biofilm as a homogeneous matrix of bacteria and extracellular polymers which bind the
bacteria together and to the surface (Williamson & McCarty, 1976a & b). The model takes into account mass transport of substrate from the bulk liquid phase to the biofilm surface, mass transprot within the biofilm, and substrate utilization within the biofilm. Rittmann and McCarty further developed
the model by incorporating cell growth, and showed that by equating energy capture and energy expenditure in the
biofilm a steady state biofilm thickness can be calculated
(Rittmann & McCarty, 1980a). By equating the ratios of
energy capture and expenditure, they predicted the existence
of a minimum substrate concentration, S^j^j^^^, below which no
significant biofilm activity occurs:
Kg'b
Smin = —----• (2-4) Y-k - b
where b = endogeneous decay coefficient (1/time)
Y = microbial yield coefficient
Additional models for describing interactions between biodegradation and adsorption have been developed (Benedek,
1980; Chang & Rittmann, 1987; Tien, 1980; Ying & Weber,
1979; Speitel et al., 1987a). A model is presented by Speitel and co-workers (1987a) which describes simultaneous
adsorption and biodegradation of a single substrate in a column system. Adsorption is described by the Fruendlich
isotherm and surface diffusion in the adsorbent; Monod
kinetics are used to describe biodegradation. Film
transport resistance and biofilm growth and decay are also
included.
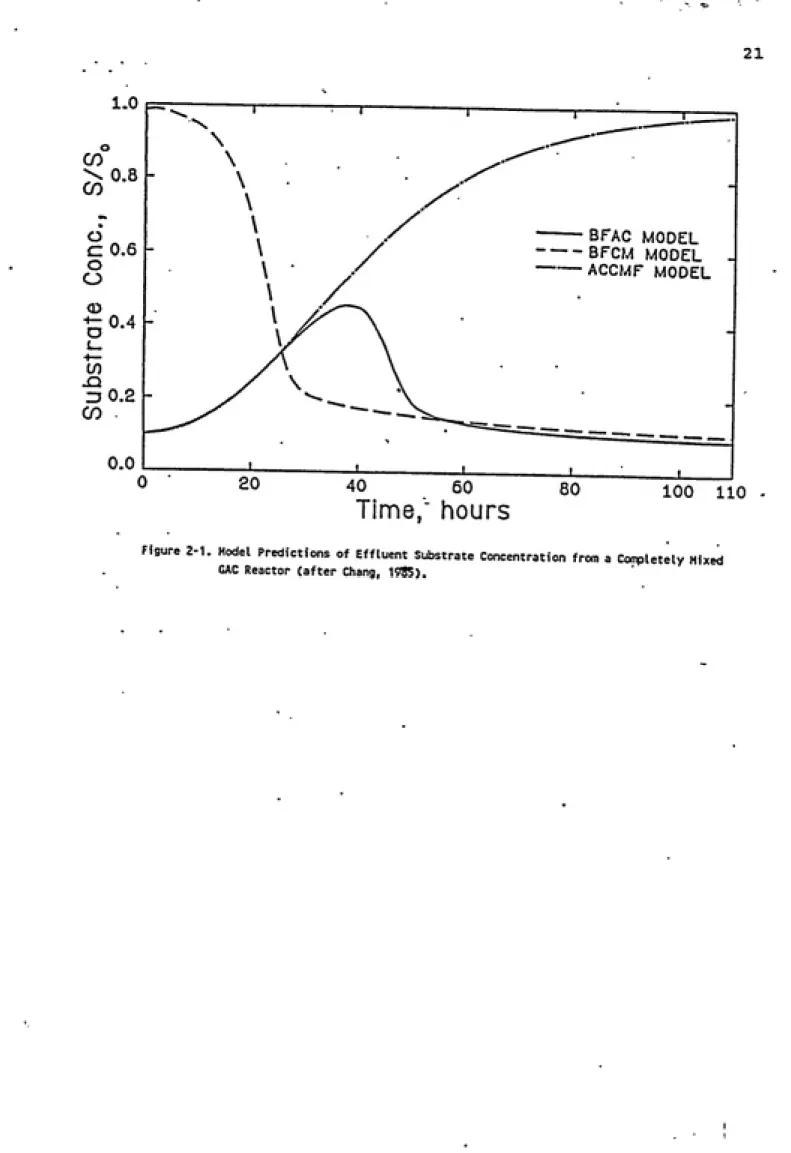
Of special interest to this research is the model developed by Chang and Rittmann (1987). The model closely
parallels that of Speitel et al. (1987a), except that
instead of describing a column system, the model developed
by Chang and Rittmann describes biofilm growth and substrate
utilization in a reactor operating under a completely mixed
regime (the Biofilm Activated Carbon model, BFAC). Axial
concentration gradients are eliminated. The model is a combination of two component-models: the biofilm on glass
beads (BFCM) model which describes biofilm degradation in
the absence of adsorption, and the activated carbon in completely mixed flow (ACCMF) model which describes
adsorption with little or no biodegradation. Effluent
concentrations as predicted by each of the models are
presented in Figure 2-1. Without adsorption, effluent
concentrations are close to influent concentrations in the
early stages of operation, before the biofilm is
established. As microbial activity increases, effluent
concentrations are reduced through biodegradation. With
adsorption in the absence of biodegradation, effluent
concentrations rise gradually until, eventually, there is no
reduction in concentration across the filter. Biological
activity in combination with adsorption offers protection
1.0
0.8 H
C 0.6
r5 0.2
0.0
— BFAC MODEL -- BFCM MODEL —ͣ ACCMF MODEL
20 40 60 80
Time, hours
100 110
Figure 2-1. Model Predictions of Effluent Substrate Concentration from a Conpletely Mixed
GAC Reactor (after Chang, 19SS).
predominates, as well as later in the run when, although adsorptive capacity may be exhausted, contaminant removal across the bed is achieved as a result of biological
activity.
2.7 Secondary Substrate Utilization
An expansion of the Rittmann & McCarty model has been
presented which describes bisubstrate removal by biofilms
(Namkung & Rittmann, 1986a & b). The model is based on a
concept that substrate can be utilized by biomass which derives energy for growth and maintenance not from the substrate in question but from another substrate present.
In such a way, compounds which are present at concentrations
below those necessary to support growth (as determined by
minimum energy requirements) may be degraded in the presence
of additional compounds at concentrations greater than S^j^^^j^.
The utilization of a specific compound can be increased byaltering the concentrations of growth-supporting substrate.
This concept, the biodegradation of compounds at
concentrations below those necessary to support growth at
the expense of an additional electron donor which provides
energy and nutrients for growth and maintenance, is termed
secondary substrate utilization. The secondary substrates
do not supply energy for long term biofilm growth either
because their concentrations are too low, or they are present in high concentrations but for only a short time.
The model presented by Namkung and Rittmann describes steady
state secondary utilization and biofilm accumulation in a
bisubstrate system, as opposed to a shock loading scenario.
The biofilm model for bisubstrate utilization was
tested using phenol as a target organic contaminant and
& Rittmann, 1986b). It was found that when phenol was
present at concentrations higher than Sjjjj^j^, an increase in
acetate concentration enhanced phenol degradation. When
phenol concentration was reduced below S^^j^j^, a minimum
concentration of 3.3 ng acetate COD/L was required to
stimulate phenol degradation; increasing acetate concentrations beyond this served to enhance phenol
degradation. Further reductions in influent phenol
concentrations required still higher acetate concentrations to stimulate degradation. In general they conclude that
bisubstrate systems show significantly better removal than
single substrate systems.
The effect of acetate addition on biological activity
was also investigated by Speitel and co-workers (1987b).
They added 2 mg/L sodium acetate to a GAC column receiving paranitrophenol (PNP) , at 2 liq/lt, in an effort to enhance biofilm growth. Degradation of PNP was less in the
bisubstrate system than in a column which received 5 jug/L PNP without the supplemental acetate. The lower biological
activity may have resulted from decreased PNP
concentrations, or the microorganisms may have
preferentially metabolized sodium acetate over the less
biodegradable PNP.
Stratton and co-workers studied primary and secondary
utilization of five different substrates in tubular reactors
filled with glass beads (Stratton et al., 1983). Acetate,
D-galactose, L-alanine, thymine, and phenol were tested as primary substrates at 3 mg/L, and as secondary substrates at
0.3 to 3.0 mg/L. They conclude from the work that, for the
same test concentration, secondary utilization of a
particular compound is less than primary utilization. Secondary utilization is more effective for removal of substrates at lower feed concentrations; as the secondary
increases. They also postulate that utilization of a permanent secondary substrate at low concentrations will
usually be greater than that of a secondary substrate present in short duration.
Secondary substrate utilization of trace contaminants
may occur in the presence of natural background organics (humic substances), which could serve as primary electron
donors. Rittmann and co-workers, in a study of aquifer
recharge in the Santa Clara Valley Water District, demonstrated that the utilization of general organics
promoted and sustained the growth of a biofilm in an aquifer near the injection well. Certain individual compounds such as naphthalene and heptaldehyde were utilized as secondary
substrates within the first meter of the well; other
compounds were not degraded and were deemed either non- or
slowly-biodegradable (Rittmann et al., 1980).
Biofilms grown on humic substances have been used to
remove taste and odor causing compounds (Namkung & Rittmann,
1987c). Short-term secondary-utilization tests were
performed, adding secondary substrates for two to three
hours to biofilm reactors which had received 1 mg/L peat fulvic acid at 3 L/day for 290 to 360 days. Mineralization of the fulvic acids was constant at about 10%, as determined by TOC measurements. Results of the study indicate that natural humic substances are capable of supporting a biofilm
which will degrade secondary compounds, both man-made
(phenol, naphthalene) and of natural origin (Geosmin, 2-methylisoborneol (MIB)), which are present at very low
concentrations. Best removals were noted at the lowest feed
concentrations (1 iiq/li for phenol and naphthalene; 100 jug/L
2.8 The BAC Process; Contributions by Ozone
Noting the widespread occurrence of natural organic
matter and its potential for serving as primary substrate
for microbial growth brings us to consider a biologically
active carbon filter as an effective means for controlling trace organics in a water supply. While the large majority of contaminants are present in the natural environment at
concentrations below the minimum required to support growth,
many may be degraded in the presence of biodegradable humic
substances. Ozonation prior to a GAC filter should promote
contaminant degradation, since ozone has been noted by
several authors to increase the biodegradability of humic
substances (Benedek, 1979; Hubele & Sontheimer, 1984;
Schalekamp, 1979; Somiya et al., 1983).
Reactions between ozone and humic substances have been
shown to result in the formation of carbonyl groups (chiefly COOH) among the volatiles from the humic and fulvic acids
(Killops, 1986). Ozonation causes a shift in the molecular
weight distribution, resulting in an increased percentage of
lower molecular weight compounds (Lienhard & Sontheimer,
1979). Other effects due to ozonation include increased
polarity, and a loss of double bonds and aromaticity,
resulting in decreased adsorbability (Lienhard & Sontheimer,
1979). P
Ozonation has been shown to increase the
biodegradability of humic substances. Using a recycle
reactor containing nonadsorbing anthracite coal, Hubele and
Sontheimer (1984) demonstrated an increase in biodegradation
with ozone dosage, from 0.18 to 1.82 gm 03/gm TOC.
Preozonation has been proposed as a method for
increasing biological activity in a GAC filter. In a pilot
ozonation prior to GAC filtration with respect to organic
matter removal and reduction of assimilable organic carbon
(AOC). It was found that an ozone dose up to 2 mg/L could
increase filter service time by 60% to 65%. Ozonation
increased AOC in an amount proportional to the applied dose. Their results, in addition, suggest that ozonation may alter the pattern of the breakthrough curve due to the production of a higher proportion of biodegradable compounds as well as
compounds of lower molecular weight and higher polarity,
which may be less adsorbable.
In an attempt to adapt ozonation and GAC filters to produce "biological reactors", Hascoet and co-workers (1986) assert that while ozone may or may not decrease dissolved organic carbon (DOC), biodegradable dissolved organic carbon
(BDOC) is always increased. In a full scale filter at Rouen-La-Chapelle, France, containing 1-year-old GAC, they determined that the dissolved organic carbon removed during
filtration consists essentially of biodegradable dissolved
organic carbon (ABDOC//^DOC = 0.7 to 0.9), and that this removal occurs in the top 20 to 40 centimeters of the
filter.
A study was carried out on site in a potable water
treatment plant for Paris which uses ozone at various points in the process train (Bourbigot et al., 1986). The
experimental focus here was the role of ozone and GAC in removing mutagenic compounds and trihalomethane (THM) precursors. Samples were withdrawn at several points and
tested for mutagenicity. An important finding is that, while ozone is successful in reducing mutagenicity, a
sufficient dose must be applied. The number of mutants in
water which received 1.5 mg/L ozone was 2.4 times higher
than in the control sample, while no mutagenicity was found
in water which received 3 mg/L ozone. Characteristics of
reported here as one of the best methods for eliminating mutagenic compounds and for decreasing chlorine consumption and THM formation.
Preozonation has also been demonstrated to have a
negligible effect on TOC removal. In a USEPA-sponsored pilot plant study at Shreveport, Louisiana, GAC beds were operated with and without preozonation at an empty bed
contact time of 24 minutes (Glaze & Wallace, 1984). The organic content of the raw water ranged from 3 to 11 mg/L as
TOC; ozone dosage was variable, but was usually less than 3.4 mg/L. Although microbial activity was important in both the ozonated and unozonated systems, results indicate that
preozonation did not effect TOC removal at any time.
Similar studies using a different source of TOC, a shorter empty bed contact time, and a higher dose of ozone have shown improved removal of TOC with preozonation
(Neukrug et al., 1984). Prechlorination of the influent water reduced the enhanced TOC removals in a parallel study, despite ozonation. This suggests that the beneficial
aspects of ozonation prior to a GAC filter with respect to
increased TOC biodegradation are dependent on
characteristics of the raw water, as well as on the ozone
dose applied.
2.9 Phenol Biodegradation
Phenol is a relatively degradable aromatic compound,
and has been the subject of several investigations involving
degradation kinetics at low substrate concentrations (Chesney et al., 1985; Jones & Alexander, 1986; Pipes, 1976; Scow et al., 1986; Shimp & Pfaender, 1985a & b;
Phenol utilization has been modeled as a second order
process, depending equally on substrate and biomass
concentrations (Paris et al., 1982), a first order process,
depending only on substrate concentration (Subba-Rao et al., 1982), and also as following Monod kinetics, a mixed order model (Chang & Rittmann, 1987; Speitel & DiGiano, 1987). Jones and Alexander (1986), in a study to determine the applicability of various kinetic models to phenol
mineralization in lake water, found that phenol
concentration had great impact on the fit of a particular
model. They determined that at 0.5 ug/L, the data fit a first order model; a Monod model without growth was best
for concentrations near 1 ug/L, a logistic model at 2.0 ug/L, and logarithmic models at all higher concentrations.
The effect of additional substrates on phenol
utilization has been investigated by several authors (Rozich
& Colvin, 1986; Shimp & Pfaender, 1985a & b; Subba-Rao et al., 1982). Rozich and Colvin (1986) compared phenol
utilization by cultures acclimated to phenol (500 mg/L) and
to a phenol/glucose mixture (250 mg/L phenol, 500 mg/L glucose). Phenol removal rates were inhibited by the
presence of glucose under both growth and nonproliferating
conditions, indicating that the interference is occurring at
the level of enzyme functioning. During the test, cells
previously acclimated to phenol switched their preference to glucose. Cells may preferentially utilize compounds which
will yield most rapid growth.
The addition of glucose at 10 gm/L had no effect on
phenol mineralization in Cayuga Lake water (Subba-Rao et
al., 1982); 78 to 96% of the phenol was mineralized in four
days. t
carbohydrates, fatty acids) as well as naturally occurring
humic acids (1985b) on the degradation of monosubstituted phenols (m-cresol, m-aminophenol, p-chlorophenol). Phenol degradation was enhanced by adaptation to increasing
concentrations of the readily degradable substrates;
enhancement was the same for all three substrates,
suggesting that the results are due to a general stimulation
of metabolic activity.
Adaptation to increasing concentrations of humic substances, however, significantly reduced the ability of
the community to degrade the monosubstituted phenols. The
decrease in phenol degradation was not accompanied by a reduction in total cell counts, plate counts, or amino acid
turnover times (an indication of the general metabolic state
of the community), although a decrease in the population of
specific compound degraders was noted. These results were
unexpected; humic substances have been known to stimulate
microbial activity (DeHaan, 1974, 1976; Seki, 1982). Since
humic substances are relatively non-biodegradable, the
community may have been starved for an additional carbon and
energy source. Yet even with the addition of acetate, a
readily utilizable substrate, the suppressive effect of the
humic substances persisted.
It is possible that the suppressive effects noted by
Shimp and Pfaender were caused by a release of heavy metals,
previously bound to the humic substances, into the microbial
feed solution. Another explanation may be that the humic
substances interacted with bacterial enzymes. Butler and
Ladd (1971) found that humic substances suppressed the activities of a number of proteases, presumably through
irreversible binding of the enzyme to the humic and fulvic
acid molecules. In any case, the authors emphasize that the
investigation; the pervasiveness of such results has yet to
be proven.
2.10 Summary
The presence of bacterial growth in granular activated carbon water filters is well documented. Numerous studies
have investigated interactions between adsorption and
biodegradation, and models have been developed to describe the process in single- and multiple-substrate systems.
Many investigators have used stoichiometric data
obtained in chemostat or batch studies, utilizing suspended
cultures, to describe biofilm behavior. Differences between
characteristics of suspended-growth and fixed-film bacteria
have been noted. It may be more desirable to utilize the
microbial community indigenous to the GAC filter for
obtaining stoichiometric data.
The interactions between adsorption and biodegradation
at the carbon surface and the extent to which biological
activity will aid in the treatment process are not fully understood. The growth of a biofilm on humic substances
after ozonation, and the possible biodegradation of trace
organic contaminants by the humic substances-grown biofilm,
The objectives of this research are directed toward
obtaining a better understanding of the role played by
biodegradation in a GAC filter receiving water which
contains naturally occurring humic substances. We are
interested in the ability of humic substances to serve as
substrate for biofilm microorganisms, and in the ability of
this humic substances-grown biofilm population to degrade a
trace micropollutant as a secondary metabolite.
The overall experimental approach is summarized here
to clarify how the different project phases are interlinked.
Each phase will then be described separately in detail, including a description of experimental methods and the
analysis of results.
The general experimental effort is outlined in Figure
3-1, which reiterates each of the objectives and shows how the accomplishment of one has enabled us to address the
next. .
Prerequisite to investigating the metabolic behavior of
biofilm microorganisms is the elimination of the adsorptive
system in which they have developed. The presence of an
adsorptive surface such as GAC will interfere with
biokinetic studies, since organic compounds will
preferentially sorb to the carbon surface, altering their
availability as substrate. Removing the biofilm
Develop Method
to Desorb Cells from GAC.
Recover Blofilm from iLaboratory Scale GACi
Reactor in order to
Determine Operating
Conditions for GAC Reactor which will
exhibit Adsorption and Biodegradation
of Ozonated HS.
Note how Extent of
HS Biodegradation
Depends on:
1. Feed Conditions
- Ozonated vs. Unozonated - TOC Concentration
2. EBCT
Use this Laboratory
Scale GAC Reactor to
Study Biokinetics of Phenol Utilization. Compare Monod Kinetic
Parameters with Literature Values obtained with
Suspended Cultures.
Observe Trends in:
1. Cell Density
2. Phenol Utilization
During Biofilm
Development in a GAC Reactor treating
Ozonated HS, from Reactor Start-up until Steady State TOC
Removal.____________
Investigate Interaction Between Adsorption and Biodegradation of Trace
Concentrations of Phenol in the Presence of Ozonated HS.
their viability, was considered to be a necessary first step in the experimental design.
Also important during the initial stages of
experimentation was the development of a laboratory scale column system which would exhibit adsorption and
biodegradation of natural humic substances. The successful design of such a system would serve as the means for
generating microbial samples to be used, in conjunction with
the removal procedure, for such microbial analyses as
biokinetic rate studies, and the assessment of total and
viable cell densities, with cultures grown under different operating conditions. In addition, the column system would enable in situ investigations of the interactions between adsorption and biodegradation of a micropollutant in the presence of natural humic substances.
Phenol was chosen as the model micropollutant for use in this study. The compound is readily biodegradable, and in addition there is widespread information available in the literature concerning its behavior in both natural and
engineered systems. While these may be good reasons for using phenol to develop and test the experimental
procedures, the long-range plan for further research in this
#-4.1 Experimental Methods
Methods are presented in the literature for removing viable cells from soil samples (Balkwill et al., 1975, 1977; Bone & Balkwill, 1986; Macdonald, 1986) and from colonized granular activated carbon (Camper et al., 1985a) utilizing a variety of chemical solutions in combination with mixing, blending, or homogenization. Dobbins and Pfaender (1988)
have developed a method for quantitative recovery of cells
from subsurface soil samples using a solution of polyvinyl pyrrolidone (PVP-360, average molecular weight 360,000; Sigma Chemical Company, St. Louis, Missouri), a polymeric substance recommended by Bone and Balkwill (1986) as a releasing agent for microbial films, and sodium
pyrophosphate buffer (PPi, Na2P207•IOH2O; Aldrich Chemical
Company, Milwaukee, Wisconsin). The soil suspension is
shaken vigorously on a rotary shaker, followed by slow speed centrifugation. Biomass is recovered in the liquid
supernatant.
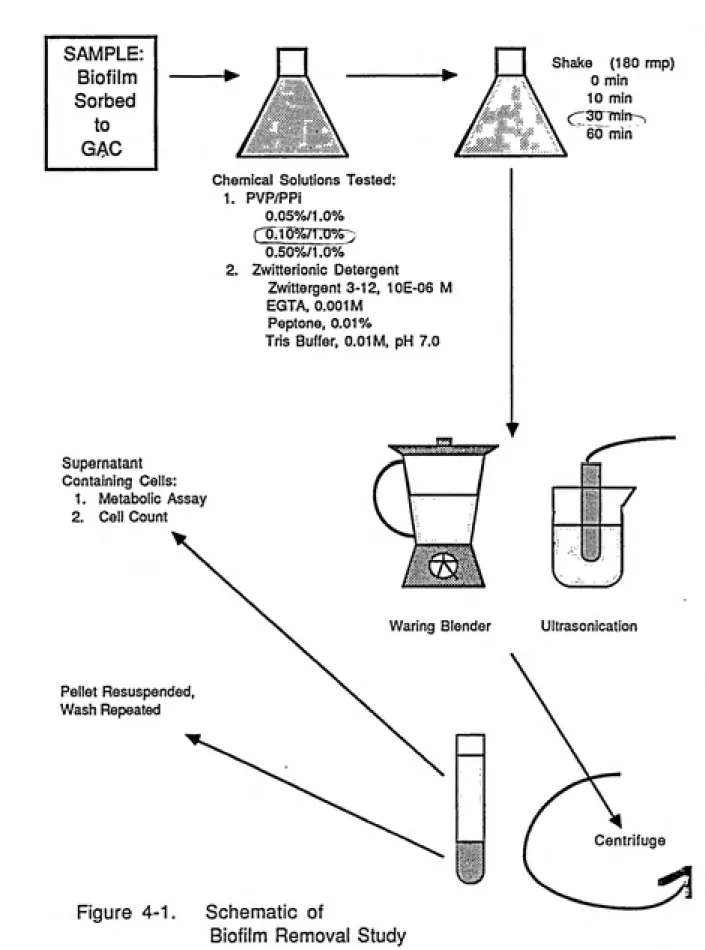
We have attempted to adapt the methods developed by
Dobbins and Pfaender to the removal of viable cells from
GAC. A general outline of our experimental program is presented in Figure 4-1. In an effort to optimize the
procedure, we focused on the effects of physical parameters
(length of time the suspension is shaken; ultrasonication
vs. blending) as well as chemical parameters (three
SAMPLE: Biofilm Sorbed
to
GAC
Shake (180 rmp)
0 min
10 min
(;;;'30 rntiT^
60 min
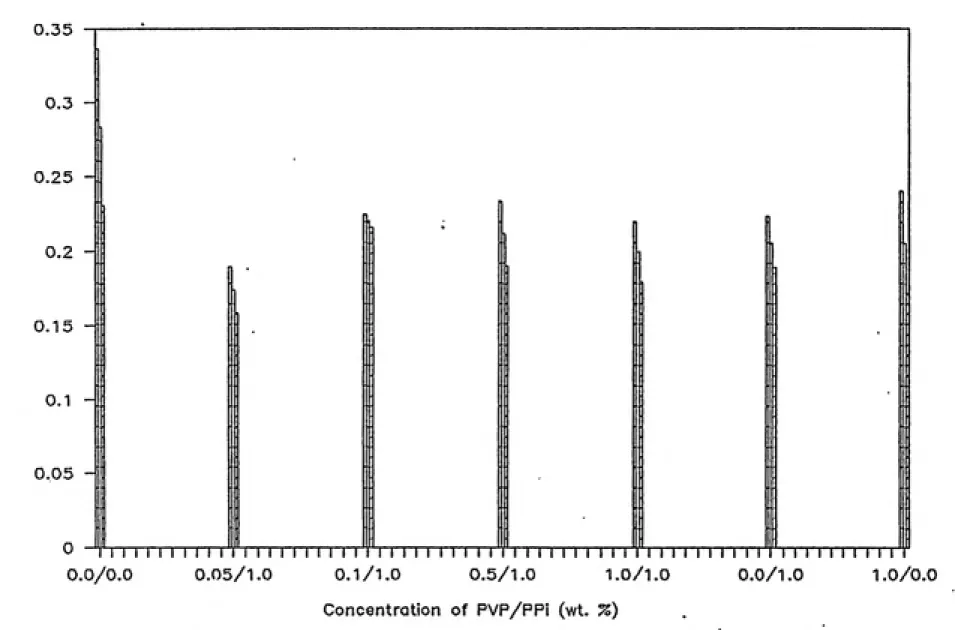
Chemical Solutions Tested:
1.
2.
PVP/PPi
0.05%/1.0%
L0.10%/1:0%5)
0.50%/1.0%
Zwitterionic Detergent
Zwittergent 3-12, 10E-06 M
EGTA, 0.001 M Peptone, 0.01%
Tris Buffer, 0.01 M, pH 7.0
Supernatant Containing Cells:
1. Metabolic Assay
2. Cell Count
Pellet Resuspended, Wash Repeated
Waring Blender Ultrasonication
Figure 4-1. Schematic of
Biofilm Removal Study
zwitterionic detergent presented by Camper et al., 1985) on
the quantitative recovery of metabolically active cells.
A feasible and efficient method was needed for
determining both the total number of bacteria in the
original sample as well as the percent recovered into the
supernatant phase. Viable cell plate counts are commonly used to quantify cell recoveries. In addition to problems noted with respect to media selectivity and the formation of
"microcolonies", the method is inapplicable to solid
samples; while a particle may be inhabited by several
bacteria, only one colony per particle is likely to be
enumerated.
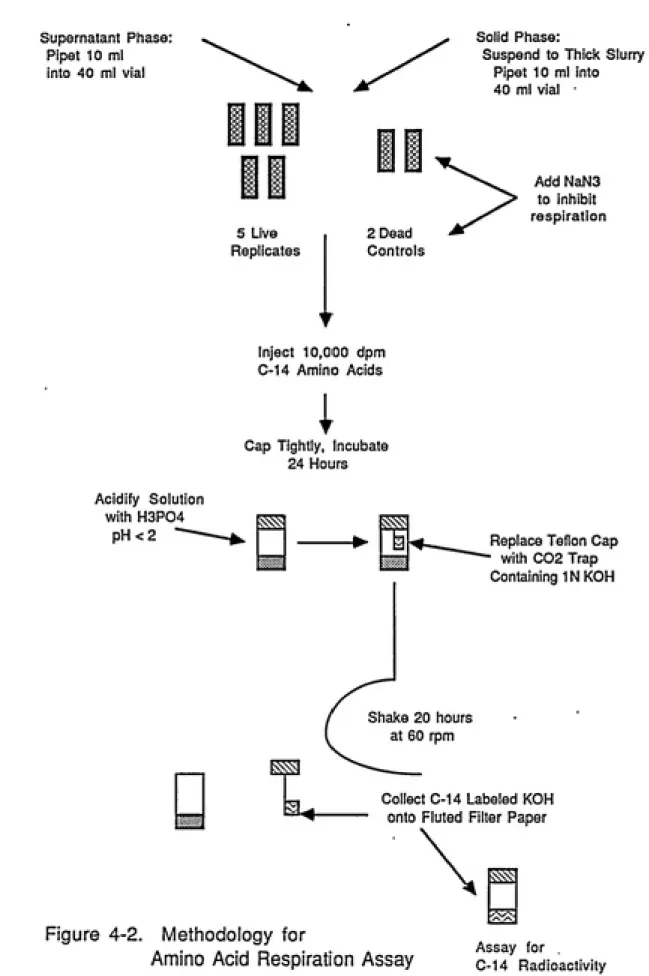
We attempted, therefore, to utilize an amino acid
respiration assay to quantify the general metabolic activity of the original sample as well as supernatant and pellet fractions obtained after subjecting the sample to a removal procedure. The technique involves incubation with a mixture
of carbon-14 labeled amino acids and subsequent measurement
of CO2 evolved from solution as a result of respiration.
The method could provide an unbiased measure of the recovery
of metabolically active cells from the carbon surface;
microscopic cell counts served as a check on the ability of
this procedure to quantify cell recoveries.
Carbon Sample. Granular activated carbon was obtained from an operating GAC filter at the Sanford Water Treatment Plant
in Sanford, North Carolina (5 MGD, population 18,000). The sample was collected from the top layer of the filter,
packed into a clean unsterile mason jar and refrigerated at 4°C until use. Since only one carbon sample was obtained,
it was necessary to store the carbon, refrigerated,
throughout the duration of this phase of the project