Katherine G. Knott. The Effect of Library Instruction on Undergraduate Library Use. A Master’s Paper for the M.S. in L.S degree. November, 2008. 70 pages. Advisor: Dr. Deborah Barreau.
In today’s society, someone is always predicting the imminent demise of libraries, who in return, are constantly having to prove their worth. In this attempt, libraries are/have evolved their mission with expanded services and facilities. However, services and facilities mean nothing if they are not utilized by patrons, which makes it vital that libraries capture new patrons and turn them into life-long users. This study examines the role library instruction sessions play in creating this return-user base that is the
foundation for our organizations. The researcher surveys two groups of first-year undergraduate students – one group that attends a library session in the House
Undergraduate Library on the campus of UNC-CH and one group that does not – in order to study and compare their habits of library use.
Headings:
Bibliographic Instruction – College and University Students Use Studies – College and University Students
By
Katherine G. Knott
A Master’s paper submitted to the faculty of the School of Information and Library Science of the University of North Carolina at Chapel Hill
in partial fulfillment of the requirements for the degree of Master of Science in
Library Science.
Chapel Hill, North Carolina November 2008
Approved by
Introduction:
In a world of ever-shrinking budgets, academic libraries are often caught in a constant battle to prove their worth. Their competition is two-fold. One is the
Literature Review:
Why focus on the library instruction session to increase library use? Because it’s good business, according to P. B. Brown’s article “Return Engagements.” First-time customers — or in the library’s case, patrons — are vital to the success of an
organization, and in order to keep customers returning, an impression needs to be made. Brown notes that first time customers are often anxious about their new experience, so the impression needs to be as friendly and comfortable as possible. Things that can help include heavy signage, an “orientation center” up front to intercept and direct newcomers — perhaps providing a map of the building as well — offering introductory instruction classes, and assigning an organization’s most senior staff to first-time users. Brown’s article suggests that many businesses try to grow by stealing customers from competitors, using such incentives as longer hours, lower prices and more services, and while this works some, catering to new customers seems to do more to increase business, especially in the end. This article, though not about libraries, sends a message to which libraries should pay attention. First-year library instruction classes are invaluable to a student’s future library use. If they have a bad first experience, they are not likely to return; whereas, if their first experience is informative and comfortable, if they feel like the library is vested in their success and can support their information needs, then they will be much more inclined to visit in the future. It is vital, therefore, that libraries strive to reduce the anxiety of their first time users and utilize the library instruction sessions to inform them of all the benefits that the library provides.
“Library anxiety: a grounded theory and its development,” published in Library Journal (Vol. 113, No. 14, p 137-9), to describe the negative feelings of fear and inadequacy between 75% and 85% of undergraduates feel when they first use their academic library. Through a two-year qualitative study, four underlying reasons for this anxiety were identified: 1.) students were intimidated by the size of the library; 2.) students didn’t know where resources were located; 3.) students didn’t know what to do in the library; and 4.) students didn’t know how to begin the research process. This anxiety, she found, hinders students from being able to use the library effectively to fulfill their information needs. In addition, because professors often assume that students are already familiar with the library and the research process (when, in fact, the students do not know how to utilize the library), the burden of information literacy falls on the shoulders of the
academic librarians. Since the librarians have very limited access to students —
essentially only through the library instruction session — these sessions become vital in reducing the anxiety many students feel upon their introduction to college.
In the 1990s, researchers Jiao and Onwuegbuzie, found that students who receive library instruction upon entering college were less likely to experience anxiety about using the library. Their recommendation for library instructors is to make the instruction session a positive one: be friendly and approachable; address the issue of library anxiety so students are aware of its existence and that they are not alone in their feelings; and encourage cooperative learning as a part of instruction programs (since this has been shown to decrease library anxiety).
Students: a Comparison.” In this comparative study, Sellen and Jirouch find that there is a serious disconnect between faculty expectations of students’ library use and library use students’ perceive necessary. Exacerbating this problem is the faculty’s unrealistic expectation that their students know how to do effective research and how to take full advantage of the library’s resources without incorporating any type of library instruction or orientation into their courses (264-5). This study was conducted at a university where at least half the students were not receiving the basic library orientation tour, much less any library instruction. Because of this statistic, the researchers were not surprised to find that students’ library use and research skills remained on much the same level throughout their entire college career. Seniors and juniors were performing at the same level at freshman and sophomores. This suggested to the researchers that because of the lack of library instruction, these undergraduates’ library use was dominated by research skills they acquired in high school (265-6). This study—even though a bit out-dated where technology is concerned—is important because it shows that students do not gain knowledge of the library or research skills on their own. They need instruction, which can most effectively be conducted by the academic librarians who work in the library. However, this study also shows that faculty cooperation is needed to require students to become familiar with the library both through their course work and through instruction, since they are not inclined to use it effectively on their own (267).
Martin’s College April 2005: An Investigation Into the Non-Use of Library Services by Current Students,” found that libraries need to market their services better to the student population, especially those students that are not frequent visitors to the library. If all English composition instructors brought their classes to the library once a semester for an instruction session, academic librarians would have a captive audience on which to market the advantages of the library. This includes not only library services, but also the library building itself. Ruth Vondracek found that students seek comfort and
convenience when searching for a location to study or conduct research—comfort being the most important factor for students studying alone and convenience, the most
important factor for studying in a group (286). Comfort includes characteristics such as the ability to spread out, listen to music, and the level of privacy. Convenience is indicated by location, ability to take study breaks and having no hours (open 24 hours a day or close to it). Talbot, Lowell, and Martin indicate that this last feature is extremely important to undergraduates who are extremely busy and usually work late into the night (362). Other important characteristics of study locations were level of noise, availability of resources (books, supplies, food, computers, study rooms) and assistance (Vondracek 284). If, as Vondracek’s study suggests, these are the characteristics of students’ desire in a study location, the academic library has a tall order to fill. Many of these
characteristics are contradictory depending on whether the student is working alone or in a group, and while one cannot expect the library to be all things to all people, as a service organization; it is the library’s mission to cater to as many of its patrons’ needs as
study, noise and quiet, spreading out at a large table or curling up in a comfortable chair (1). Library instruction programs conducted in the library have the benefit of introducing students to the library’s physical space as well as intangible services. Students are
extremely busy, and the library instruction sessions are the perfect time to show them how much the library can help them manage their academic endeavors (Marshall, Burns, Briden 29). Students can see that the library is a comfortable and friendly place to work that provides convenient help for all their information needs.
By introducing themselves to the students, showing them that librarians can help them without judging or being condescending, librarians can increase a students’ likelihood to use the library and librarians for their information needs. If a good impression is made during a library instruction session, students may feel comfortable emailing a librarian directly for help, or coming up to the reference desk if they recognize (i.e. ‘know’) the librarian behind the desk.
All the reasons discussed above are positive results of library instruction programs that, in theory, lead students to use the library’s resources more often. This includes coming to the library building more often, which raises the question – what do students actually do in the library? Does coming to the library more encourage academic success? Introducing students to the library’s services and space is useful, but only if students are in fact using the library to perform academic activities. Doug Suarez, a reference librarian at Brock University, took on this questions during a six-month
research study during which he conducted ethnographic observations and semi-structured interviews of students who spent time in the library (1, 3-4). Suarez noted many common activities students conducted in the library and classed them into three groups: engaging behaviors, social behaviors and leisure behaviors. Engaging behaviors were defined as those activities that involved and supported the academic mission of the library. Some of the engaging behaviors were reading, writing, consulting notes/texts, collaborating with fellow students on assignments, and studying. The social behaviors included chatting with other students, flirting, joking, resting/napping, eating/drinking, and communicating via cell phones. Examples of leisure behaviors were playing games, talking (less
similar conclusion in their study of undergraduate library use. They surveyed people leaving the undergraduate library and determined that the top three reported usages of the facility were academic in nature: studying alone, using the computer for academic work, and studying with a group (408). Talbot, Lowell, and Martin observe that undergraduate students typically use the library more as a study hall than as a place to conduct research (362). Even if this is true, the implication of this study and the others for instructional services is large. If instructional sessions can orient students to the library and encourage them come back on their own, then it seems likely that the academic activity in the library will increase, thus further promoting the library’s place as an academic center on campus.
Methodology:
methodology as the Portmann and Roush study; however, most of the questions will be very structured and direct to insure quality responses.
The same survey was given out to all students who participated in the initial library, follow-up library, and control surveys. The initial survey group was made up of all freshman English composition classes that attended a library instruction session during a three-week period. Members of the library staff, as well as SILS graduate students taught the library instruction sessions in the House Undergraduate Library on the UNC-CH campus. Professors of first-year English classes requested these classes, which were generally centered on a specific research assignment, though some professors did sign their classes up for library instruction sessions at the beginning of the semester in order to gain an introduction to the library and its resources. The library session
instructor facilitates the class assignment by demonstrating specific resources (and how to use them) to members of each class.
The students were all undergraduates at the University of North Carolina at Chapel Hill, who were enrolled in a freshman English composition class, attended a library instruction session with the class, and who elected to participate in this study. Students were considered ‘attending’ if they were present in the classroom while the library instruction was going on, spending no more than five minutes of the class period out of the room. The House Undergraduate Library is responsible for teaching
two course sequence, with 2 exceptions: students who demonstrate sufficient mastery of communication skills, and students with English-language deficiencies, who are offered appropriate alternative instruction (“Criteria for General Education Requirements” 4).
The surveys were distributed to all classes who came to a library instruction session in the House Undergraduate Library during the second through fourth weeks of the fall 2008 semester because this was determined to be the optimal period for
distribution – it represented the highest number of classes taught within the time
constraints of this study. This was determined by analyzing the instruction statistics from last fall (fall 2007 semester). The fall 2007 semester’s instruction sessions are
represented by the graph below:
Instruction Classes per Week: Fall 2007
0 2 4 6 8 10 12 14 16 18 20 We ek 1
Wee k 2
Wee k 3
We ek 4
We ek 5
We ek 6
Wee k 7
Wee k 8
We ek 9
We ek 1
0
Wee k 11
Wee k 12
Wee k 13
We ek 14
We ek 15
Wee k 16
Weeks Into Semester
# o
f C
lasses
Even though weeks two through four did not represent the three-week period with the largest number of instruction classers, the integrity of the study depended on surveying students during a period in which most of them had not attended a library instruction session previously. Since many English professors bring their classes to the library for an instruction session for each of the three units in English 101 and 102, the researcher believed that many of the students that would come later in the semester — perhaps during weeks six through eight — would have already come to the library for an
instruction session. This would have compromised the reliability of the study. Twenty-six classes visited the House Undergraduate Library for an instruction session during weeks two through four of the fall 2007 semester, and the researcher had no reason to believe that these numbers would change greatly for the fall 2008 semester. The maximum number of students able to enroll in each class is nineteen, which means, assuming last year’s numbers are consistent with this year’s, up to 500 students could be surveyed.
participate in the follow-up. For the instructors who agreed to participate, the researcher distributed the survey and information sheet to their classes, read a script once again describing their rights as a research participant, and gave them five minutes of class time to complete the questions (to see a copy of the email sent to instructors or the
administrator script see the Appendixes). With both the initial survey and the follow-up survey, the professor and the researcher / administrator of the survey left the room while the students were filling out the survey. A volunteer from the class was asked to oversee the students placing the completed surveys in a manila envelope and to let the professor and the administrator know when every member of the class was done with the survey.
The follow-up survey asked the same questions as the initial survey to determine whether their library usage behavior was different after the library instruction session than it was before they attended. Specifically, the researcher wanted to determine
whether students who attended the library instruction session returned to the library more often after having attended the session. Neither of the surveys will asked for any
identifying information. Rate of return was determined by the self-reported number of times a student entered the library building in the week prior to the survey. An increase in this rate of return was determined by a larger number of times entered on the follow-up survey in comparison with the initial.
enrolled in a first-year, undergraduate English course whose instructor did not schedule a library instruction session for them. Non-attending students were identified by contacting the instructors via email for permission to hand out surveys to their class (to see a copy of this email see the Appendixes). The control group surveys were administered in the same way as the follow-up surveys, since they needed to simulate the natural progression of a student’s library use throughout the semester if they did not attend a library session. The researcher administered all of the control surveys. She went to the classroom, read a prepared script informing subjects of their rights a participants in a research study, handed out the survey and an information sheet, and then left the room with the professor while the surveys were completed (to see a copy of the script read to the control group see the Appendixes).
Limitations:
Results:
During the three weeks of initial surveying, twenty-four classes came to the library – two fewer than the equivalent three-week period last fall (2007). Over three hundred students completed the survey (309). Of the twenty-four classes surveyed, the researcher administered the surveys to nineteen of them – six English 101 classes and thirteen English 102 classes. No English 100 classes came to the library during the surveying. Two of the classes that did not complete the survey did not have time during their session, and instructors that did not regularly teach classes for the instruction program taught the other three classes. Of the nineteen classes, the researcher administered the survey for four of them, while her colleagues at the undergraduate library administered the other fifteen.
During the first week, four classes – sixty-five students – completed surveys. Two of these were English 101 classes and two were English 102 classes. During the second week, nine classes – 152 students – completed surveys. Three classes were English 101 and the rest (6) were English 102. Six classes – ninety-one students – completed the survey during the third week; only one was an English 101 class, and the other five were English 102.
For the most part, the data was good; however if a particular question had multiple answers circled or was unclear in any way, that question’s answer was thrown out. The parts of the survey where the data was good, though, were kept. Survey data was analyzed by class, week, and as a whole.
requests. The other seventeen instructors graciously allowed the researcher to come to their classroom two to three weeks after the initial surveying. Two weeks was the preferred amount of time, but some instructors requested a later date due to scheduling conflicts; however, eleven of the seventeen classes completed the survey exactly two weeks after their initial survey. Three classes completed the follow-up sixteen days (2 extra days) after the initial, and three classes completed the follow-up twenty-one days (7 extra days) after the initial. In total, 257 students completed the follow-up survey.
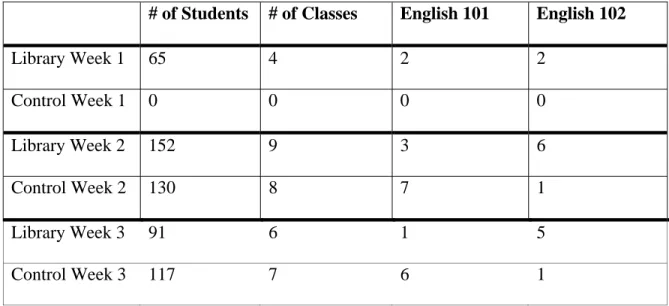
Table: 0.1: Break down of Library Session and Control Groups by Week
# of Students # of Classes English 101 English 102
Library Week 1 65 4 2 2
Control Week 1 0 0 0 0
Library Week 2 152 9 3 6
Control Week 2 130 8 7 1
Library Week 3 91 6 1 5
Control Week 3 117 7 6 1
Question 1:
The first question on the survey asked students to report the number of times they had physically entered the House Undergraduate Library building in the last seven days. They had five options: 0, 1-2, 3-4, 5-6, 7 or more. Half of the students (50.16%) from the initial survey reported that they had visited the undergraduate library only 1 to 2 times the previous week. Almost 16% answered that they had not been to the library at all in the past seven days.
Table 1.1: Number of visits to the physical library building in last 7 days (Initial
survey)
Question 1 (Initial)
0 visits 1 - 2 visits 3 - 4 visits 5 - 6 visits 7 or more
# Students 49 155 86 12 7
On the Follow-up survey, two to three weeks later, the same set of students reported only 40.47 % had still only been to the library one to two times the week previous – a 10% reduction from the initial survey. While this was a reduction, in
exchange for higher percentages in other categories, it still represented the largest answer group. The percentage of students who did not go to the library at all in the 7 days prior to this study remained about the same at 16.73%. The second largest answer group also remained steady at 27.63% for students that went 3 to 4 times during the week. There was a large increase of over 8% for those that came to the library 5 to 6 times that week. The percentages of students who answered 0 times, 3 to 4 times, and 7 or more times changed less than 1%; however, while the 1 to 2 visits category dropped by 9.69%, the 5 to 6 times category jumped by 8.18%.
Table 1.2: Number of visits to the physical library building in last 7 days (Follow-up
survey)
Question 1 (Follow-up)
0 visits 1 – 2 visits 3 – 4 visits 5 – 6 visits 7 or more
# Students 43 104 71 31 8
Percentage 16.73 % 40.47 % 27.63 % 12.06 % 3.11 %
% Change from Initial
0.87 % -9.69 % -0.21 % 8.18 % 0.85 %
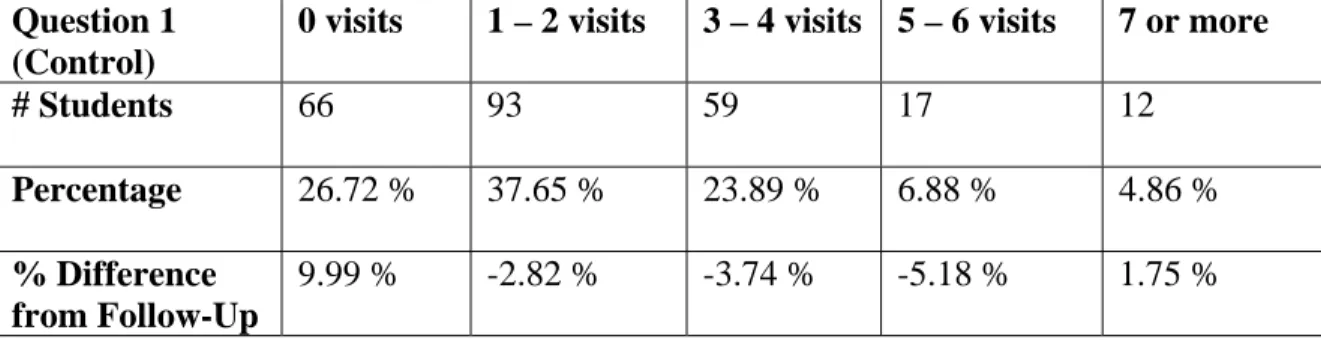
respectively. When the control group was compared to the follow-up survey, the largest difference was that 9.99% more of the control students did not go to the library at all. The control group also had fewer students answer in the 1 to 2 times, 3 to 4 times, and 5 to 6 times answer groups; although 1.75% more of the control students reported going 7 or more times in the week prior.
Table 1.3: Number of visits to the physical library building in last 7 days (Control
survey)
Question 1 (Control)
0 visits 1 – 2 visits 3 – 4 visits 5 – 6 visits 7 or more
# Students 66 93 59 17 12
Percentage 26.72 % 37.65 % 23.89 % 6.88 % 4.86 %
% Difference from Follow-Up
9.99 % -2.82 % -3.74 % -5.18 % 1.75 %
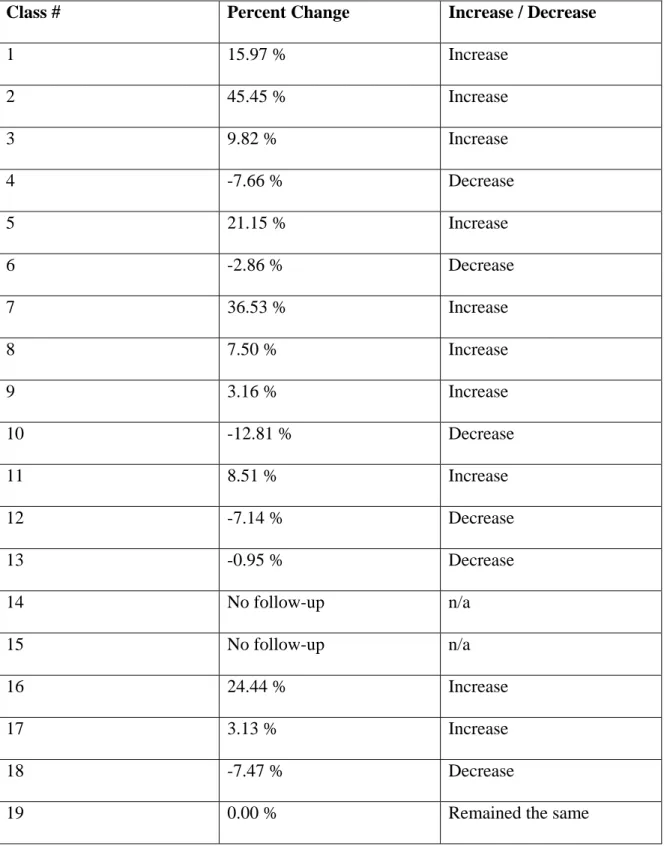
When the average was taken of all the answers given for question one, there was a 7.87% increase from the initial survey to the follow-up, and a 0.46% decrease from the initial survey to the control, which simulated the natural progression of library use throughout the semester without attending a library instruction session. The averages from the three weeks show that week 1 increased far more at 17.10% than the other weeks 2 and 3, which both hovered around a 5% increase (5.37% and 5.03% respectively).
8%. Class #2 had the greatest change from initial to follow-up survey, with an average increase of 45.45%. The class that decreased the most was #10 at 12.81%.
Table 1.4: Percent change of average answer by class, for question 1
Class # Percent Change Increase / Decrease
1 15.97 % Increase
2 45.45 % Increase
3 9.82 % Increase
4 -7.66 % Decrease
5 21.15 % Increase
6 -2.86 % Decrease
7 36.53 % Increase
8 7.50 % Increase
9 3.16 % Increase
10 -12.81 % Decrease
11 8.51 % Increase
12 -7.14 % Decrease
13 -0.95 % Decrease
14 No follow-up n/a
15 No follow-up n/a
16 24.44 % Increase
17 3.13 % Increase
18 -7.47 % Decrease
Question 2:
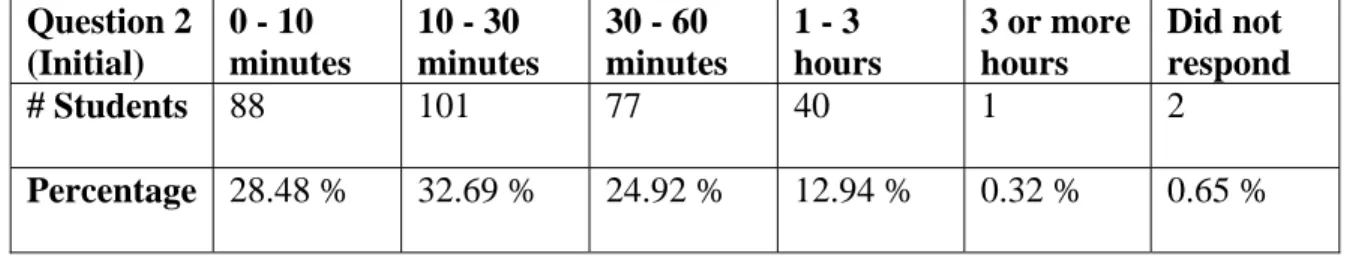
The second question on the survey asked students to report how long their visits to the Undergraduate Library were on average. They once again had five options: 0-10 minutes, 10-30 minutes, 30-60 minutes, 1-3 hours, and 3 or more hours. Unlike question one, there was no category with a majority – the student responses were much more distributed. The answer groups 0-10 minutes, 10-30 minutes, and 30-60 minutes were separated by less than 8%. Almost a third of the students answered in the 10-30 minutes category; the next highest category was 0-10 minutes, and almost a quarter of students responded 30-60 minutes (the third highest category). The percentages dropped off sharply for the longest lengths of time. About 13% of students surveyed said they averaged 1-3 hours a visit, and less than 1% responded that they averaged more than 3 hours per visit. Two students did not respond to this question on this survey, which was again less than 1%.
Table 2.1: Average length of time for visits to the library building (Initial survey)
Question 2 (Initial)
0 - 10 minutes
10 - 30 minutes
30 - 60 minutes
1 - 3 hours
3 or more hours
Did not respond
# Students 88 101 77 40 1 2
Percentage 28.48 % 32.69 % 24.92 % 12.94 % 0.32 % 0.65 %
0-10 minutes the second highest, and 30-60 the third highest; however, they all decreased by several percentage points, while 1-3 hour visits and 3 or more hour visits increased. 1 to 3 hour visits increased by almost 4%, and 3 or more hour visits increased by not quite 2%. Since everyone that completed the follow-up survey answered the second question, the percentage of no-responses dropped to 0%.
Table 2.2: Average length of time for visits to the library building (Follow-up
survey)
Question 2 (Follow-up)
0 – 10 minutes
10 – 30 minutes
30 – 60 minutes
1 – 3 hours 3 or more hours
# Students 69 79 61 43 5
Percentage 26.85 % 30.74 % 23.74 % 16.73 % 1.95 %
% Change from Initial
-1.63 % -1.95 % -1.18 % 3.79 % 1.62 %
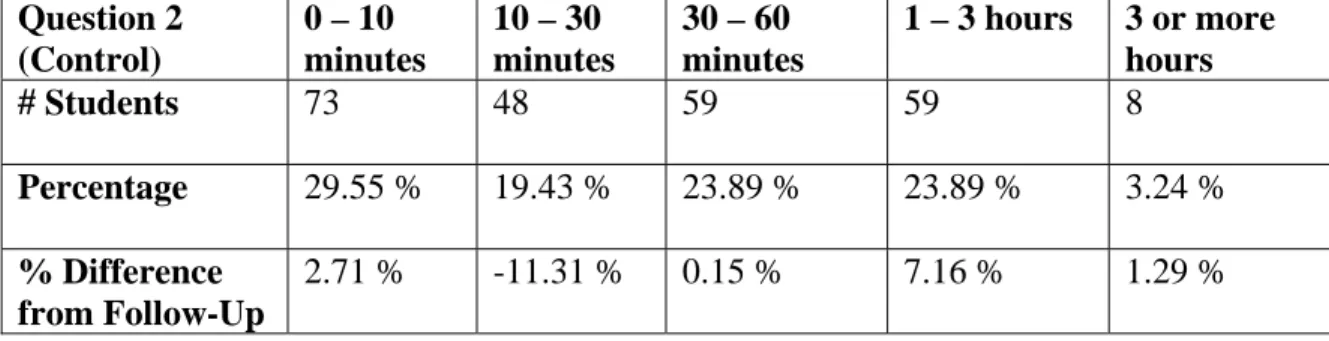
The Control group surveys, which were conducted during the same three weeks as the follow-up surveys did not follow the same distribution as the initial and follow-up surveys. For the control group, the highest answer group by more than 5% was the 0-10 minutes category. The 30-60 minutes and 1-3 hours categories were second highest at about 24% each. Then the 10-30 minutes category, which had the most responses in the initial and follow-up survey, was the forth-ranked answer group for the control surveys. The 3 or more hours answer group was once again the smallest, but it was almost 3% higher than the initial group and over 1% higher than the follow-up survey.
other categories – 0 to 10 minutes, 30 to 60 minutes, 1 to 3 hours, and 3 or more hours – had more students choose them in the control group than in the follow-up group.
Table 2.3: Average length of time for visits to the library building (Control survey)
Question 2 (Control)
0 – 10 minutes
10 – 30 minutes
30 – 60 minutes
1 – 3 hours 3 or more hours
# Students 73 48 59 59 8
Percentage 29.55 % 19.43 % 23.89 % 23.89 % 3.24 %
% Difference from Follow-Up
2.71 % -11.31 % 0.15 % 7.16 % 1.29 %
When the average was taken of all the answers given for question two, there was a 24.45% decrease from the initial survey to the follow-up, and a 19.45% decrease from the initial survey to the control, which simulated the natural progression of library use throughout the semester without attending a library instruction session. The averages from the three weeks showed a large difference between the three weeks, though all three averages decreased between the initial and follow-up surveys. Week 1 decreased the least at 12.41%, week 2 had a 22.83% drop, and finally week three decreased the most at 27.05%.
Interestingly these same two classes had the greatest increase and greatest decrease for question one, respectively.
Table 2.4: Percent change of average answer by class, for question 2
Class # Percent Change Increase / Decrease
1 -29.41 % Decrease
2 36.84 % Increase
3 -15.63 % Decrease
4 -33.96 % Decrease
5 7.69 % Increase
6 -41.43 % Decrease
7 -6.47 % Decrease
8 -35.48 % Decrease
9 -30.73 % Decrease
10 -42.88 % Decrease
11 3.66 % Increase
12 -35.00 % Decrease
13 -32.28 % Decrease
14 No follow-up n/a
15 No follow-up n/a
16 -31.06 % Decrease
17 -23.53 % Decrease
18 -13.22 % Decrease
Question 3:
The third question on the survey asked respondents about which activities they performed most often while in the library building. They were given a list of ten activities and asked to pick the three they did the most often. The activities listed were study / read / work alone, meet with groups, use the library’s printers, conduct research, spend time in between classes, socialize, use the computer for personal reasons, use the computer for academic reasons, use various technology available at the library (scanning, filming, edit audio/visual material, equipment rental), and “other,” which had a blank for specification of an activity not listed. Since each respondent was asked to choose three activities, the total number of responses from each group of surveys was triple what it was for the other questions; however, there were many more “blank” answers
(represented by zeros) for this question because a lot of data had to be thrown out due to respondents circling more than three activities. For surveys that had more than three responses circled, all of the answers for that question had to be recorded as zero because the researcher could not determine which of the circled answers were the respondents’ top three choices. Responses from students who chose less than three activities were counted and recorded normally, with zeros filled in for the second or third answer choice as appropriate.
throughout campus. It is not a part of the library (the library has its own support through the systems department); however it is housed in the Undergraduate Library for
convenience. The second most common activity reported was going to the library with a class (i.e. the instruction sessions). This represented 22% of respondents choosing “other.” Other activities reported included sleeping / napping, using the bathroom, working at the UL (as an employee), picking up scantrons and blue books, and even picking up girls. The only real library-specific activities that were reported were checking out books and finding reserves (which are housed in the Undergraduate Library), but this only represented 7% of responses.
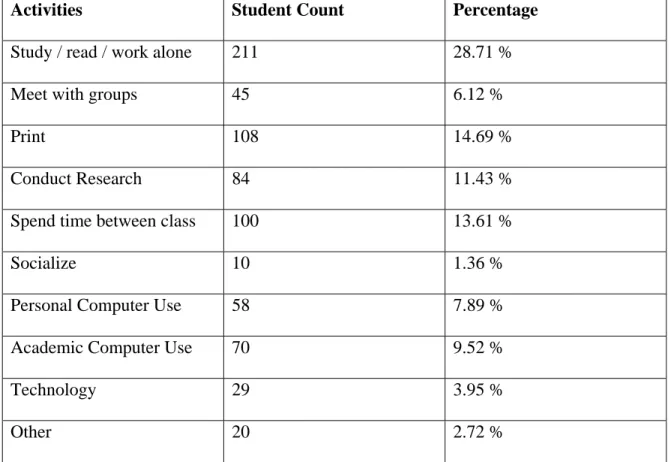
Table 3.1: Most common activities performed in the library, question 3 (Initial
Survey)
Activities Student Count Percentage
Study / read / work alone 211 28.71 %
Meet with groups 45 6.12 %
Print 108 14.69 %
Conduct Research 84 11.43 %
Spend time between class 100 13.61 %
Socialize 10 1.36 %
Personal Computer Use 58 7.89 %
Academic Computer Use 70 9.52 %
Technology 29 3.95 %
Other 20 2.72 %
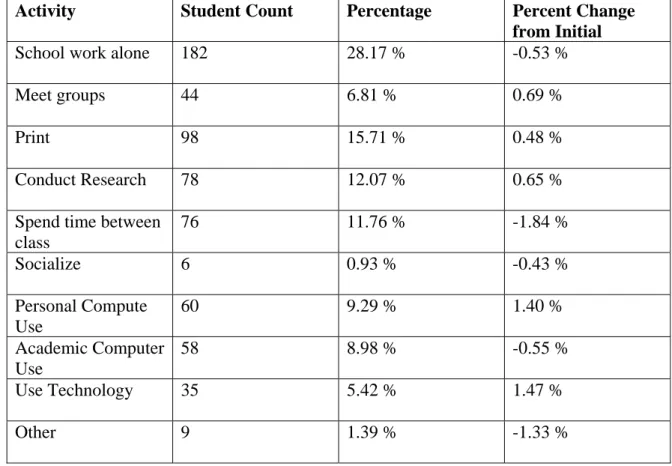
The follow-up survey results were very similar to the initial survey. The
percentage of change for each answer group was less than 2%. Doing class work alone was still the most popular activity, with printing as the second most popular; however, researching surpassed spending time between classes as the third most frequent activity. The least common activities remained the same, though, with socializing being the least popular, then “other” and using technology respectively. Personal and academic
initial survey to the follow-up. Five of the activities increased slightly: meeting with groups, printing, research, personal computer use, and use of technology.
Table 3.2: Most common activities performed in the library, question 3 (Follow-Up
Survey)
Activity Student Count Percentage Percent Change
from Initial
School work alone 182 28.17 % -0.53 %
Meet groups 44 6.81 % 0.69 %
Print 98 15.71 % 0.48 %
Conduct Research 78 12.07 % 0.65 %
Spend time between class
76 11.76 % -1.84 %
Socialize 6 0.93 % -0.43 %
Personal Compute Use
60 9.29 % 1.40 %
Academic Computer Use
58 8.98 % -0.55 %
Use Technology 35 5.42 % 1.47 %
Other 9 1.39 % -1.33 %
library group. The least popular activities remained socializing, using technology, and “other,” though they changed their order around. Socializing was the eighth most popular activity reported, which was over a 2 % increase from the follow-up surveys.
Table 3.3: Most common activities performed in the library, question 3 (Control
Survey)
Activities Student Count Percentage Percent Difference
from Follow-Up
School work alone 166 29.86 % 1.68 %
Meet groups 53 9.53 % 2.72 %
Print 77 13.85 % -1.32 %
Conduct Research 33 5.94 % -6.14 %
Spend time between class
79 14.21 % 2.44 %
Socialize 17 3.06 % 2.13 %
Personal Compute Use
56 10.07 % 0.78 %
Academic Computer Use
47 8.45 % -0.53 %
Use Technology 16 2.88 % -2.54 %
Table 3.4: Most common activities performed in the library (All Survey Groups) 0.00% 5.00% 10.00% 15.00% 20.00% 25.00%
S tud y / R
ead
/ Cla ss w
ork alon
e
Meet
group s
P rint R ese
arch
Tim e Be
tween
C las
s
S ocia lize
P ers onal
C om
pute r Us
e
Acad emic
C om pute
r Us
e Tech nolo gy Othe r Initial F ollow‐Up C ontrol
T op
3 L ibrary
Ac tivities
Question 4:
The forth question on the survey asked students where they did most of their studying / class work? The survey listed seven options from which students could chose: the Undergraduate Library, another library on campus, their dorm or apartment, the student union, a coffee shop, outside, or “other.” Both the “other” option and the “other library” option had space next to them where respondents were prompted to specify which library they worked most at or where else they studied. Students were asked to circle only one option. Those surveys that had more than one response circled were discarded.
was their library of choice. Wilson Library, which houses the university libraries’ special collections and the Math / Physics library were also mentioned.
For students who responded in the “other” category, 92% of them wrote that the place they studied the most was the student-athlete study center. The only other place mentioned was the NROTC armory.
On the initial survey, before students had attended a library session, over 80% of them reported their residence (dorm or apartment) as the location in which they did the most studying and / or schoolwork. The next most commonly reported place was only 7% for the “other library” category, which as discussed above almost always referred to Davis Library. The Undergraduate Library was the third most popular place at just over 6 ½ %. The least common study location was coffee shops at a third of a percent. Not far above that, studying outside was reported at two-thirds of a percent.
Table 4.1: Where students study most (Initial survey).
Location Student Count Percentage
Undergraduate Library 20 6.64 %
Other Library 21 6.98 %
Dorm / Apartment 243 80.73 %
Student Union 5 1.66 %
Coffee Shop 1 0.33 %
Outside 2 0.66 %
The follow-up survey, a few weeks later with the same students, showed that their habits had changed somewhat after attending the library instruction session. Dorms and apartments were still the most popular places to study, but their popularity decreased by almost 10% from the initial survey. The Undergraduate Library surpassed Davis Library for the second most-common place to study, gaining over 5%. Students who liked to study at other libraries on campus (including Davis) also increased, gaining almost 3% to make up 10% of the surveyed population. Studying outside and studying in a coffee shop were still the least favorite study locations, but they did switch places, coffee shops now being more popular than studying outside.
Table 4.2: Where students study most (Follow-up survey).
Location Student Count Percentage Percent Change
from Initial Survey
Undergraduate Library
30 11.95 % 5.31 %
Other Library 25 9.96 % 2.98 %
Dorm / Apartment 178 70.92 % -9.81 %
Student Union 9 3.59 % 1.92 %
Coffee Shop 2 0.80 % 0.46 %
Outside 1 0.40 % -0.27 %
Other 6 2.39 % -0.60 %
the follow-up survey. The Undergraduate Library, still second most popular, was almost 2% more popular with the control group than with the library-session group. The least popular location was the coffee shop at 0%, followed by outside at less than 1%.
Table 4.3: Where students study most (Control survey).
Location Student Count Percentage Percent Difference
from Follow-Up
Undergraduate Library
33 13.81 % 1.86 %
Other Library 23 9.62 % -0.34 %
Dorm / Apartment 165 69.04 % -1.88 %
Student Union 5 2.09 % -1.49 %
Coffee Shop 2 0.84 % 0.04 %
Outside 0 0.00 % -0.40 %
Other 11 4.60 % 2.21 %
Question 5:
The “other library” category allowed students to select a different library, other than the Undergraduate Library as the place they spend the most time between class. Of the students who chose this option, the overwhelming majority (89%) chose the main campus library, Davis. The Park Journalism Library, Wilson Library (special collections) and the Math / Physics Library also received mentions, though in much smaller numbers.
For students that selected the “other” category, the most common location specified was the dining hall (about 40%). Other common answers were classroom buildings on campus, the gym, and at a place of employment (between 10-15% each). Other locations that received mention were the campus bookstore, a sorority or fraternity house, the athletic academic center, the pit (courtyard area), and the flag-pole (smoking area).
Table 5.1: Where students spend time between classes (initial survey).
Location Student Count Percentage
Undergraduate Library 39 13.09 %
Other Library 20 6.71 %
Dorm / Apartment 118 39.60 %
Student Union 36 12.08 %
Coffee Shop 7 2.35 %
Outside 63 21.14 %
Other 15 5.03 %
Table 5.2: Where students spend time between classes (follow-up survey).
Location Student Count Percentage Percent Change
from Initial Survey
Undergraduate Library
35 14.23 % 1.14 %
Other Library 16 6.50 % -0.21 %
Dorm / Apartment 104 42.28 % 2.68 %
Student Union 22 8.94 % -3.14 %
Coffee Shop 0 0.00 % -2.35 %
Outside 53 21.54 % 0.40 %
Other 16 6.50 % 1.47 %
Table 5.3: Where students spend time between classes (control survey).
Location Student Count Percentage Percent Difference
Follow-Up Survey
Undergraduate Library
36 15.00 % 0.77 %
Other Library 10 4.17 % -2.34 %
Dorm / Apartment 110 45.83 % 3.56 %
Student Union 21 8.75 % -0.19 %
Coffee Shop 7 2.92 % 2.92 %
Outside 43 17.92 % -3.63 %
Other 13 5.42 % -1.09 %
Question 6:
The sixth question on the survey asked students from what location they conducted most of their research. They were provided with the same seven choices of location as they were with the previous two questions: the Undergraduate Library, another library on campus, their dorm or apartment, the student union, a coffee shop, outside, or another location. Both the “other” option and the “other library” option had space next to them where respondents were asked to specify which library they worked most at or where else they conducted research. Students were asked to circle only one option. Those surveys that had more than response circled were discarded.
Sciences Library, Wilson Library (special collections), and the Biology / Chemistry Library.
In the “other” category, the responses were unanimous. Every student who chose the “other” option wrote that they conduct most of their research from the student athlete academic center.
The initial survey of students revealed that 60% of them performed their research from their dorm rooms (presumably electronically). The second most popular location for conducting research was the Undergraduate Library at 29%, which was about half the number of students who did research from their dorm room. The “other library” category was the third most-common answer group at 10%. No students reported doing research from a coffee house, and less than 1% of students reported researching from the student union or outside.
Table 6.1: The physical location from which students conduct most of their research
(Initial survey).
Location Student Count Percentage
Undergraduate Library 86 28.86 %
Other Library 29 9.73 %
Dorm / Apartment 176 59.06 %
Student Union 2 0.67 %
Coffee Shop 0 0.00 %
Outside 1 0.34 %
On the follow-up survey, several weeks later, the top three research locations were still the same: dorm / apartment, Undergraduate Library, and “other library” (in that order); however there was some shift away from the dorm room towards the libraries. The dorm / apartment category decreased 3% to 56%, while the Undergraduate Library and other libraries on campus gained almost 4 % between them. The Undergraduate Library ranked second at 30% and “other libraries” had the largest increase, arriving at almost 13%. The coffee shop, outside, and “other” locations tied for the least popular research location at less than 1% each.
Table 6.2: The physical location from which students conduct most of their research
(follow-up survey).
Location Student Count Percentage Percent Change
from Initial Survey
Undergraduate Library
74 29.60 % 0.74 %
Other Library 31 12.40 % 2.67 %
Dorm / Apartment 140 56.00 % -3.06 %
Student Union 2 0.80 % 0.13 %
Coffee Shop 1 0.40 % 0.40 %
Outside 1 0.40 % 0.06 %
Other 1 0.40 % -0.94 %
less for the other libraries on campus. The libraries were still the second and third most-common answer groups, though. The coffee shop and outside both received zero selections from students, with the student union as the next least popular location at less than 1%.
Table 6.3: The physical location from which students conduct most of their research
(control survey).
Location Student Count Percentage Percent Difference
from Follow-up
Undergraduate Library
61 25.63 % -3.97 %
Other Library 15 6.30 % -6.10 %
Dorm / Apartment 154 64.71 % 8.71 %
Student Union 2 0.84 % 0.04 %
Coffee Shop 0 0.00 % -0.40 %
Outside 0 0.00 % -0.40 %
Other 6 2.52 % 2.12 %
Discussion:
There were some interesting caveats in the data though. Attending the library session did not seem to affect the students who had not been to the Undergraduate Library in the week prior to the library session. On the follow-up survey, almost the exact same number of students said that they still had not been to the Undergraduate Library in the last seven days. However, there was a large decrease in the number of students visiting the library just once or twice a week in favor of more frequent visits. This may be because there were some students who just do not use the library, for whatever reason, and no amount of library instruction is going to change those habits. Students that were already predisposed to come to the library once or twice were more familiar and more comfortable with it after their library session and therefore returned more frequently. This would explain the 10% decrease in students who visited 1 to 2 times a week and the over 8% increase in students who visited 5 to 6 times a week.
Another interesting result of the surveys was the large difference between certain aspects of the initial and control survey. The initial survey was given to classes who were about to attend a library session but had not yet. The control surveys were given during the same time period as the follow-up surveys to simulate the natural continuation of the initial group had they not attended the library session, in order to balance out the follow-up survey. Thus, similar numbers between the initial survey and the control survey were expected. The numbers for the three most-frequent categories were very similar (3-4 visits, 5-6 visits, and 7 or more visits). The control surveys revealed slightly increased numbers in these three categories, but that is to be expected later in the
surveys. The control survey had 11% more students report that they had not been to the library in the past seven days, while the initial survey showed that over 12% more students had made 1 to 2 visits to the library in that time. This discrepancy can be
explained if one assumes that those students taking the initial survey who had not been to the Undergraduate Library in the past seven days selected the 1-2 visits option, instead of 0 visits, because they counted the fact that they were in the Undergraduate Library at the time about to attend a library instruction session as 1 visit to the Undergraduate Library.
Another interesting discrepancy, the drastic increase in library visits from students who attended a library session during week 1 of the surveying, the researcher believes can be explained by how early in the semester that first week was. The first week of surveying took place on the second week of class, so when reporting their library habits for the previous week, they were reporting on the first week of classes, during which the academic rigors of the semester have not usually begun. The students who participated in the second and third weeks of surveying would have had more of a chance and reason to go the library prior to their library session. However, it is important to note that during all three weeks of the survey students increased their usage by at least 5%, while the control group decreased slightly overall.
There was a lot of variation in the amount of change individual classes
between classes, so it would not be surprising if a particular instructor had a constant effect (increase or decrease) on their classes. This does not, however, appear to be the case. Every instructor that taught more than one class during the survey period had at least one class that increased and one class that decreased.
This increased rate of return among students indicates that the library instruction session was successful in decreasing the library anxiety of some students, though perhaps not as much as the instructors of the program would have liked. This may be because no formal, systemized way of teaching library instruction exists – therefore, there is not a concerted effort to reduce library anxiety; it is treated more as a by-product of library instruction rather than a goal. In addition, different instructors focus on it more than others do. Another possibility is that when the students came to their library instruction session, they did not have a high level of library anxiety – especially since the
Undergraduate Library is one of the most user-friendly libraries on campus. Perhaps they had already been on a library tour or visited the library on their own, and those fears had already been dispelled. Both these possibilities may account for the small increase experienced after the library instruction session, but the literature shows that the majority of students do experience some sort of library anxiety and because so many of the
students surveyed were first-time visitors, the researcher believes that some of the increased rate of return must be, in part, due to the success of this program. Future studies should ask these questions directly in order to gain more-accurate insight.
visit than the group that did go. For the students that did go to the library session, short visits decreased slightly in exchange for longer visits, but the control group had even fewer short visits and more long ones – with the exception of visits under 10 minutes, in which the control group had more than the library group. This indicates perhaps that after attending a library session, those users became more efficient in meeting their information needs and thus had to spend less time in the library to meet those needs. Activities that took non-library-session attendees a while to figure out, may not have taken library session goers as long because they had been introduced to the library’s policies, the layout of the library building, and how various processes work in the library. Another possibility is that library-session users increasingly took advantage of the
library’s virtual resources – chat reference assistance, electronic journals and article database, e-reference tools, and e-books – which were often explained and promoted during library instruction sessions. This possibility is supported in a study done by Wen-Hua Ren that shows students who attend library instruction sessions can gain confidence in conducting research electronically if they are not only taught the technical skills, but are also taught to have self-assurance in their abilities to execute those skills (328).
spending less time in the library. They may have been making more frequent, shorter trips later in the semester.
Similarly, each progressive week saw a greater decrease in the average length of time spent per visit, and for 82% of the library-group classes, their average length of visit decreased from the initial visit to the follow-up. The ones that did not decrease were in the first (one class) and second (two classes) weeks of surveying. A different professor taught each of the three classes that increased. Two of the classes had the same instructor for their library session, but the third had a different instructor. However, there seemed to be no pattern to the increases and decreases. The percentage for each class jumped around quite a lot. The one interesting point was the class that had the greatest increase in number of visits also had the greatest increase in length of visit. Similarly, the class that had the greatest decrease in number of visits had the greatest decrease in length of visit. This does not seem to be completely random, but it is not consistent throughout all of the classes. Four of the seventeen classes had the exact same ranking in terms of increase and decrease for number of visits and lengths of visit. When the classes were ranked by the average increase they experienced in number of visits and length of visit, almost half (8 out of 17) of the classes had ranks that were within two places of each other. Eleven out of seventeen had a ranking within three places. It is unclear what implications this might have for library instruction.
academic – studying alone, meeting with groups, conducting research, and using the computer for academic reasons – far outweighed activities such as socializing and personal computer use that were not academic. Even the activities that could be classed in either category – printing, spending time between classes, and using library technology – were only about half as popular as those purely academic activities.
The academic activities popular with this study were different from the Gardener and Eng survey. Studying alone was still the top-cited activity, but their second and third choices – academic computer use and meeting with groups – did not appear in the top three most-popular activities from this study. The highest ranking either of those
activities received on this survey was fifth; they were usually in the bottom half of survey responses. This may be a result of the different social pressure felt from an anonymous survey as opposed to an in-person question – the Gardener and Eng survey questioned students about their activities as they were leaving the library building.
While studying alone was the activity that students performed most in the
Undergraduate Library, it is important to put that in the perspective of where they studied most overall. Only a small fraction of students reported that they did most of their
In addition, even though the percentage of students who reported the
Undergraduate Library as their favorite place to study increased on the follow-up survey, it also increased almost the same amount on the control survey. This makes it likely that the shift from the dorms to the Undergraduate Library was not caused by the library instruction session. Rather, the shift probably illustrates the natural increase in work flow over the semester.
Similarly, dorms and apartments were also the most popular place to spend time between classes, while the Undergraduate Library was third. However, spending time between classes in the Undergraduate Library made up only about 10% of students activities there. It was the third most popular activity behind studying and printing. In addition, while control group students liked to spend more time between classes in the Undergraduate Library than library session students, control students also spent more time in their dorms. Control group students did, however, spend less time between classes in other libraries around campus. Even though the library instruction classes are taught in the Undergraduate Library, library session goers may feel more comfortable in other libraries because of their positive experience with the Undergraduate Library. Whereas both groups may feel fairly comfortable with using the Undergraduate Library because it is not as intimating – there should be less library anxiety – as with other libraries around campus, where there is more of a learning curve.
between classes in one. A much larger percentage studied, conducted research, and spent time between classes in their place of residence. This might have repercussions for those academic libraries considering putting coffee houses in their library with the idea that it will increase library use. Along the same lines, no other location emerged from this study as major competition for the library other than student residences.
One of the most encouraging outcomes of the survey, though, was the large difference between the library group and the control group in the amount of research they conducted in the Undergraduate Library. As the third most popular activity for the library group on the follow-up survey, performing research in the Undergraduate Library was over twice as popular with library-session attendees as with the control group. Both groups still performed most research from their dorm rooms, but those that attended a library session conducted less research from their dorm room and more research from the Undergraduate Library. One would also like to assume that even though both groups were conducting research from their dorm rooms, the library-session group was
conducting better, more efficient research due to their exposure to the library’s electronic resources.
Also coming to the library session seemed to have a positive affect on the amount of research conducted in other campus libraries as well, particularly Davis. The control group was much less likely to venture into Davis for their research needs than those who attended a library session. So even though this study was mainly focused on the use of the Undergraduate Library – because the library sessions were conducted in the
The differences between the library group and the control group in the activities they perform in the library also pointed to increased academic use of the library.
Students who attended a library session seemed to not only use the library more, but they generally used it for more-academic purposes. Students who attended a library session studied in the Undergraduate Library more, they conducted research in the library a lot more, and they took more advantage of the library’s technology resources (including using library computers and printing). They also socialized less than students who had not attended a library session. They did not spend quite as much time between classes in the library, but from the other data in this study, it seems safe to assume that while they were in the library between classes they were conducting more-academic activities than the control group, who had never been to a library session.
Conclusion:
WORKS CITED
Brown, P. B. “Return Engagements.” Inc. 12.7 (July 1990): 99-101
Cleveland, Alison. “Library anxiety: a decade of empirical research.” Library Review 53.3 (2004): 177-185.
“Criteria for General Education Requirements.” Revised by Administrative Boards of the General College and the College of Arts and Sciences. 6 December 2008. Posted by Office of Undergraduate Curricula. 29 October 2008
<http://www.unc.edu/depts/uc/docs/criteria_12-6-06.pdf)>.
Gardner, Susan, and Susanna Eng. “What Students Want: Generation Y and the
Changing Function of the Academic Library.” Portal: Libraries and the Academy 5.3 (July 2005): 405–420.
Givens, Lisa M. “Faculty and Librarians’ Perspectives on Academic Space: Setting the Stage for Students’ Information Behaviour.” Information Research 10.1 (2004): summary 2. 18 April 2008. <http://InformationR.net/ir/10-1/abs2>.
Marshall, Ann, Vicki Burns, and Judi Briden. "Know Your Students: Rochester's two-year ethnographic study reveals what students do on campus and how the library fits in." Library Journal 132.18 (Nov 2007): 26-29.
Ren, Wen-Hua. “Library Instruction and College Student Self-Efficacy in Electronic Information Searching.” The Journal of Academic Librarianship 26.5 (September 2000): 323-28.
Sellen, Mary K., and Jan Jirouch. “Perceptions of Library Use by Faculty and Students: a comparison.” College & Research Libraries 45.4 (July 1984): 259-267.
Suarez, Doug. “What Students Do When They Study in the Library: Using Ethnographic Methods to Observe Student Behavior.” Electronic journal of academic and special librarianship. 8.3 (Winter 2007).
Talbot, Dawn E., Gerald R. Lowell, and Kerry Martin. "From the users' perspective--the UCSD libraries user survey project." Journal of Academic Librarianship 24.5 (September 1998): 357-364.
Toner, Lisa. “Information Access Survey at St. Martin’s College April 2005: An Investigation Into the Non-Use of Library Services by Current Students.” St. Martin’s College Library Services (June 2005): 2-8. 18 April 2008.
<http://www.ucsm.ac.uk/library/localfiles/infaccesssurveys/report.pdf>.
WORKS CONSULTED
Dillman, Don A. Mail and Internet Surveys: the Tailored Design Method. Second Edition. New York: John Wiley & Sons, Inc., 2000.
Norusis, Marija J. SPSS/PC+ Studentware. SPSS Inc., 1988.
Appendix A
Katherine Knott IRB number 08-1248
Survey*
1.) How many times have you physically entered the House Undergraduate Library building in the last 7 days? (Please circle one.)
0 1-2 3-4 5-6 7 or more
2.) On average, how long were your visits? (Please circle one.)
0-10 minutes 10-30 minutes 30-60 minutes 1-3 hours 3 or more hours
3.) Please circle the 3 activities that best describe what you do in the Undergraduate Library normally:
Study/read/class work alone Meet groups Print Research Spend time in between classes Socialize Personal computer use Academic computer use Use technology
(scan, film, edit, equipment rental) Other: ______________
4.) Where do you do most of your studying/class work? (Please circle one.)
Undergraduate Library Other Library: _____________ Dorm/Apt.
Student Union Coffee Shop Outside Other: ____________
5.) Where do you most often spend time in between classes? (Please circle one.)
6.) From what location do you do most of your research? (Please circle one.)
Undergraduate Library Other Library: _____________ Dorm/Apt.
Student Union Coffee Shop Outside Other: ____________
Appendix B
Katherine Knott IRB number 08-1248
Survey Information Sheet (for Library Group)*
Title of Study: The Affect of Library Instruction on Undergraduate Library Use
Principal Investigator: Katherine Knott (email: [email protected])
Faculty Advisor: Dr. Deborah Barreau (email: [email protected])
UNC-Chapel Hill Department: Information and Library Science
What is the purpose of this study?
The purpose of this research study is to learn about the affect, if any, that library instruction classes have on undergraduate library use.
What will happen if you take part in the study?
If you take part in this study, you will be asked to fill out a brief, six-question survey during your library instruction session. Two weeks later, you may be asked to fill out a follow-up survey (with the same six questions) in order to see if your behavior has changed after attending the library session. If you fill out the initial survey, you are not obligated to complete the follow-up survey. You do not have to complete either survey or participate in this study in any way if you do not wish. The entire process is
completely voluntary, and you may stop at any time. You do not have to answer any question that makes you feel uncomfortable—simply leave any blank. Completion or non-completion of this survey will have no effect (positive or negative) on your
performance/grades in your current class. Your professor will not know if you completed the survey, nor will he/she be informed of any answers you may provide.
What are the possible benefits from being in this study?
Research is designed to benefit society by gaining new knowledge. You may not benefit personally from being in this research study.
What are the possible risks or discomforts involved from being in this study?
There are no risks or discomforts associated with this study.
How will your privacy be protected?
If you choose to take part in this study, you will NOT be asked for any identifying information. The surveys will not be evaluated until all surveys have been completed, so I will not know which responses belong to you—nor will your professor or any other person.
Will you receive anything for being in this study?
What if you have questions about this study?
You have the right to ask, and have answered, any questions you may have about this research. If you have questions, or concerns, you should contact the researchers listed at the top of this page.
What if you have questions about your rights as a research participant?
All research on human volunteers is reviewed by a committee that works to protect your rights and welfare. If you have questions or concerns about your rights as a research subject you may contact, anonymously if you wish, the Institutional Review Board at 919-966-3113 or by email to [email protected].
Appendix C
Katherine Knott IRB number 08-1248
Survey Information Sheet (for Control Group)*
Title of Study: The Affect of Library Instruction on Undergraduate Library Use
Principal Investigator: Katherine Knott (email: [email protected])
Faculty Advisor: Dr. Deborah Barreau (email: [email protected])
UNC-Chapel Hill Department: Information and Library Science
What is the purpose of this study?
The purpose of this research study is to learn about the affect, if any, that library instruction classes have on undergraduate library use.
What will happen if you take part in the study?
If you take part in this study, you will be asked to fill out a brief, six-question survey (should take about five minutes). You do not have to complete this survey or participate in this study in any way if you do not wish. The entire process is completely voluntary and you may stop at any time. You do not have to answer any question that makes you feel uncomfortable—simply leave any blank. Completion or non-completion of this survey will have no effect (positive or negative) on your performance/grades in your current class. Your professor will not know if you completed the survey, nor will he/she be informed of any answers you may provide.
What are the possible benefits from being in this study?
Research is designed to benefit society by gaining new knowledge. You may not benefit personally from being in this research study.
What are the possible risks or discomforts involved from being in this study?
There are no risks or discomforts associated with this study.
How will your privacy be protected?
If you choose to take part in this study, you will NOT be asked for any identifying information. The surveys will not be evaluated until all surveys have been completed, so I will not know which responses belong to you—nor will your professor or any other person.
Will you receive anything for being in this study?
You will not receive anything for taking part in this study.
What if you have questions about this study?
What if you have questions about your rights as a research participant?
All research on human volunteers is reviewed by a committee that works to protect your rights and welfare. If you have questions or concerns about your rights as a research subject you may contact, anonymously if you wish, the Institutional Review Board at 919-966-3113 or by email to [email protected].