Revolving
Loan
Funds
in
North
Carolina
A
Profile
of
the Industry
Matt
Hull
and Carl
RistCarlRist istheSenior
Program
Manager
fortheCorporation for
Enterprise
Development (CFED).
MattHullisa
programassociateat
CFED.
He
hasaMaster'sinRegionalPlanning
fromthe Universityof
North Carolinaat
ChapelHill.
Just
beyond
the gleaming corporate headquarters that herald NorthCarolina as one ofthe nation's banking centers exists a
$90
million lendingindustrythatquietly serves local markets. Withoutthe fanfare that
accompa-nies the corporate banking world, these revolving loan funds (RLFs)
make
loanstobuildbusinesses andrevitalizecommunities inareas underserved
by
private financial institutions.
As
inmost
states, little isknown
about thisin-dustry collectively, but as a result ofthe research described in this article, a
clearerpicture ofNorth Carolina's
RLF
industry hasbegun
to emerge. For example:•
RLFs
represent atleast $90million incapitaldedicatedto small businesslendinginNorthCarolina.
•
With
amedian
loan fund size of $1.3 milhon, North Carolina's fiondsare,
on
average, significantlylargerthantheRLFs
inany
other statesur-veyed.
• North Carolina's
RLF
industry has a unique structure—
larger fimds, but fewer ofthem
—
that is, in largepart, a product ofstategovernment
policyandfunding.
•
While
a handful ofhigh-performing funds dominate the state'sRLF
in-dustry, the rest
of
thestate'sRLFs
do nothave a very diversified capitalbaseand,
on
average,areonly revolvingtheircapital, if atall.What
isaRevolvingLoan Fund?
Revolving loan funds (RLFs) are community-based financial institutions
that provide access to capital for individuals and communities underserved
by
private financial institutions.RLFs
exist in every stateand
are supportedby
funders at all levels of government, as well asby
private andphilan-thropic institutions.
They
provide loanstolocalbusinessesthatcannotattractprivate financing, and recycle the repayments
by
relending the capital tootherbusinesses.
RLFs
are aflexible andeffective tool forpromotingbusi-ness development, job creation, and economic self-sufficiency.
RLFs
have proven to be financially sustainable institutions that collectivelymanage
up
toseveral billion dollars inassets.The
Counting on Local
Capital ProjectThe
profile ofNorth Carolina'sRLFs
in this articlewas
developedby
the Corporation forEn-terprise
Development
(CFED)
as partofa nationalresearch and policy project, Counting on Local
Capital. Counting on LocalCapital, fiinded
by
theFord Foundation, seeks to build
knowledge
aboutthe size, level of activity, and impact of
RLFs.
North Carolina is one of seven states profiled as part ofthe project, joining Arkansas, California,
Illinois,Minnesota,Ohio,and Washington.
Methodology
North Carolina
was
selected as one of sixstate partners in the national Counting on Local
Capital project in July 1997.
The
state'sapplica-tion
was
sponsoredjointlyby
the North CarolinaDepartment of
Commerce
andthe North CarolinaRural
Economic Development
Center.Since a single, comprehensive inventory of
RLFs
inNorth Carolina did not exist, one oftheprimary tasks
was
to develop such a list.With
help
from
various state andnon-profit sources, 88organizations thought to be operating loan flmds
were
identified and sent a detailed survey.From
this list, 53 organizations
(60%)
responded.Over
halfoftheresponding organizationsindicated that
they did not operate a loan fimd,while
24
organi-zations responded that they operated at least one
RLF.
Three of the organizations operatedtwo
separate loan funds, bringing the total
number
ofRLFs
in thestudyto27.Among
the 27RLFs
in our sample, specialnote should be
made
about four of these funds.While
the purpose ofour surveywas
to identifyand profile
economic
developmentRLFs,
we
re-ceived surveys
from
four of the larger cities inNorth Carolina that reported
on
relatively largeRLFs
frinded primarily withCommunity
Devel-opment
Block Grant(CDBG)
grants toEntitie-ment
Cities.Each
ofthese ftmdsmakes
acombi-nation of
economic
development and housingloans, butthe fund
managers were
unable topro-vide data on just the
economic
developmentpor-tion of the portfolio. Despite the fact that these differences
make
these four fundssomewhat
un-like the other funds in our profile, this report
in-cludes
them
in itsanalysisbecause:• theDepartment of
Housing
andUrban
Devel-opment
(HUD), which
funds both SmallCit-ies
CDBG
grants andCDBG
grants toEnti-tlement Cities, has been,
by
far, the largestsourceoffederal dollars for
RLFs,
and• data
on
RLFs
funded withCDBG
grants toEntitlement Cities, in particular, has
been
themost
difficultto obtainduringtheresearchon
RLFs
forthe Countingon
Local Capitalproj-ect.
Recognizing these differences, though, this articlewillattimes exclude these four fiinds
from
the analysis. Thus,
when
reference ismade
to"Economic
Development
ONLY
RLFs,"
thismeans
the 23RLFs
(excluding these four distinctfunds) that
make
economic
development loansonly. Otherwise,
when
this report refers to "AllRLFs," this will indicate the entire sample of 27
RLFs
from North
Carolina in the database,in-cluding thesefourdistinctfunds.
Findings
from
theNorth
CarolinaRLF
ProfUe
The
BasicsThe
organizations thatoperateRLFs
inNorthCarolina are predominantly nonprofits (46
per-cent)andpublic sectororganizations (42percent).
Moreover, the
27
RLFs
thatrespondedtooursur-veyare relatively active lenders. Eighty-three
per-cent
had
made
aloan withinthelast sixmonths.In addition,
compared
to the other statesstudied forthisproject.NorthCarolina's
RLFs
are relativelymore
mature.The
largestshare ofRLFs
inNorthCarolinahave
been
operating for6to 10Chart1. Yearsin operation:N.C.
revolvingloan
funds
45%- 40%- 35%- 30%- 25%- 20%- 15%- 10%-
5%-1
0%-y
y
j^^^^^^SJJ
i
Sbll
^-1to5 6to10 IVbrethanIO
years. One-third ofall funds began operating in
the last five years; the oldest fund started lending
in 1981.
Finally,the vastmajority oforganizationsthat
operate
RLFs
in North Carolina operate a singlefimd (88 percent), while only 12 percent operate
multiple funds.
Compared
to the other statesstudied for this project. North Carolina ranks
among
the states with the smallest percentage ofRLFs
with multiple fimds.Where
theMoney Comes
From:
Sourcesof
RLF
CapitalThe
27RLFs
thatrespondedto oursurveyre-port$90.5million in total capitalfrompublic,
pri-vate, and philanthropic sources.
The
total capitalin the "economic development only"
RLFs
isal-most
$70 million.Based
on total capital reportedin its RLFs, North Carolina ranks fifth
among
theseven states surveyed as part ofthe Counting
on
LocalCapital project.
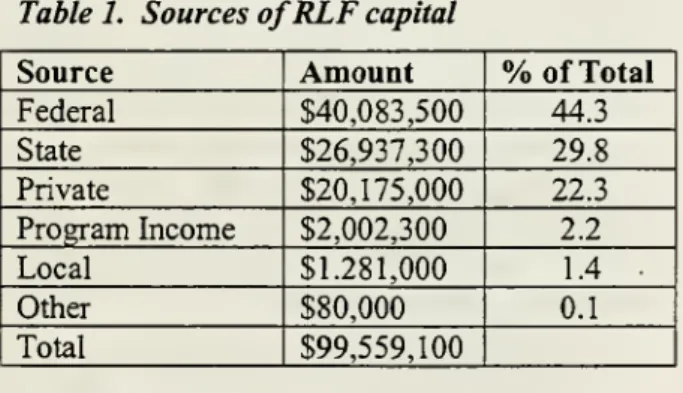
As
shown
in the following chart, the federalgovernment
has beenthe largest source ofcapitalfor these RLFs.
As
indicated in the chart below,the federal
government
has mvestedmore
than$40 million inNorthCarolina
RLFs,
oralmost45percent oftotal capital.
The
second largest sourcehas been state government, with an investment of $26,937 milHon or almost 30 percent of total capital.
The
third largest source hasbeen
thepri-vatesector,
which
accountsforalmostone quarteroftotal capital.
Table1. Sources
of
RLF
capitalSource
Amount
%
ofTotalFederal $40,083,500 44.3
State $26,937,300 29.8
Private $20,175,000 22.3
Program Income
$2,002,300 2.2Local $1,281,000 1.4
Other $80,000 0.1
Total $99,559,100
Federal
funding
Among
federal fimders, the Department ofHousing
andUrban
Development
(HUD)
hasmade
the largest investment inRLFs
in NorthCarolina. Largely through
Community
Develop-ment
Block Grants(CDBG)
made
to EntitlementCities,
HUD
has contributed roughly $22.5mil-lion or
56
percent of all federal dollars in NorthCarolina
RLFs.
Other contributing federalagen-cies in decreasing order include the U.S.
Depart-ment
ofAgriculture, theEconomic Development
Administration, the Small Business
Administra-tion, andtheAppalachian RegionalCommission.
Itshouldbe noted thatthe Small Cities
CDBG
program
is also funded with federal dollars fi^omHUD,
but is administered at the state level. Forthis reason. Small Cities
CDBG
grants arein-cluded as part ofstate capital sources in the
sec-tionthat follows.
However,
ifSmall CitiesCDBG
dollars are included with federal sources,HUD's
shareoftotal capital increasesto$33.9million, or
almost 38 percent oftotal capital in North
Caro-lina
RLFs.
State
funding
The
role of stategovernment
in supportingRLFs
is one of the unique features of theRLF
industry inNorth Carolina.
As
noted intheafore-mentioned chart, state
government
sourcesmake
up
the second largest share of capital in NorthCarolina
RLFs. With
roughly equalsharescoming
fi^om General
Assembly
appropriations andCDBG
grantsmade
through the Small Citiespro-gram, the state
government
has invested $26.9million in North Carolina
RLFs
or almost 30per-cent of total capital.
Among
the seven statesstudied in Counting
on
Local Capital, NorthCarolina ranks
among
the leading three statesbased on the share of total capital contributed
firomstatesources.
Of
particular note is the role of the GeneralAssembly
in appropriating funds to capitalizeRLFs
in North Carolina. Since the late 1980s,when
the GeneralAssembly
appropriated funds tothe North Carolina Rural
Economic Development
Center to establish a microenterprise
demonstra-tion, the state has directly appropriated funds to
several of the state's leading
RLFs
as part of acomprehensive development finance strategy
aimed
at fillingcapitalgaps inNorthCarolina.Private sector
funding
Overall, private sources of capital
make
up
the third largest source ofcapital in North
Caro-lina
RLFs,
accounting for approximately 22per-cent oftotal capital.
The
largest source ofprivate capital isfoundations ($15.9 million or 79percentofprivate sources), followed
by
banks ($2.6lion or 13 percentofprivate sources).
Among
theother statesstudied forthisproject, onlyArkansas
has such a major foundation investment in its RLFs.
However,
the distribution ofprivate capital ishighly uneven across
RLFs
in North Carolina.The
state's largestRLF,
the Self-Help Ventures Fund,which
is one ofthe nation's leadingcom-munity development financial institutions, has a
total of almost
$16
million in private capital ormore
than three quarters of all capital in NorthCarolina contributed
by
private sources.Capital sourcesfortheaverage
RLF
inNorth
CarolinaThe
majority of the capital in the typicalNorth Carolina
RLF
comes
from state sources,augmented by
a significant portion of federaldollars, and a smaller portion ofprivate dollars.
This is portrayed in the graph below,
which
ex-cludes from analysis boththe Self-Help Ventures
Fund
and the four large publicRLFs
that fundbotheconomic development andhousing.
CapitalizationStructure
and
Trends
Size
of
RLFs
The
sizeofthemedian
RLF
inNorthCarolinais significantly larger than in any of the other
states studied forthisproject. Overall, the
median
size of
RLFs
in North Carolina is $1.3 million,witlia range in size
from
$27.9 million (theSelf-Help Ventures Fund) to $90,000 (Metropolitan
Low-Income Housing and CDC).
In fact, inno
other state
was
themedian
RLF
size larger than$1 million. Moreover, this finding is notdistorted
by
the presenceofahandfuloflargerRLFs. Even
excluding the Self-Help Ventures
Fund
and thefour
RLFs
that fund both housingand
economic development loans, themedian
RLF
size inNorthCarolina is still $1.2 million.
At
thesame
time,basedonthe seven statesurveysconductedaspart
ofthe Counting on Local Capital project. North
Carolina has a smallertotal
number
offunds thanallbutone otherstate.
There are several
key
implicationsthatfollowfrom the larger average size of
North
Carolina'sRLFs.
First, the state'sRLFs
may
be closer toachieving sustainability than the funds in other
states. Practitioners interviewed for this project
estimate that it takes a capital base of $3 to $3.5
million and an active loan portfolio ofatleast $2
millionto generateboththe revenuesnecessaryto
supportthe staffneeded to operate a
RLF
profes-sionally, and the
volume
of loans necessary toachieve areasonablydiversifiedportfolio.
Second, larger average fund size
may
alsolead to
more
efficientRLF
administration. For example, 83 percent ofNorth CarolinaRLFs
re-ported
making
at least one loan in the past sixmonths, a figure thatis the second highest
among
all otherstatessurveyedforthisproject.
Debt
vs. equityOverall, debtcapital totals$27.7million or31
percent of the total capital in North Carolina
RLFs.
The
largest source ofdebt capital isfoun-dation investments, followed
by
federal sourcesand banks.Tj^jically, foundation investments and
federal loans carry highly subsidized rates and
terms,
making
much
ofthisdebt "nearequity."As
with private capital, debt financing ofRLFs
in North Carolina is highly uneven.Ex-cludingthe Self-HelpVentures Fund, debt capital
makes up
only 18 percentoftotal capitalinNorthCarolina
RLFs,
themajorityofwhich comes from
the
USDA's
Intermediary RelendingProgram
(IRP).
Based
on
thisfindingtherewould
appeartobe significant opportunities for
RLFs
in NorthCarolina to use their equity capital to leverage
additionaldebtcapital.
Capitalneedsvs. capital availability
Despite capital resources
of
roughly $90mil-lion in North Carolina's
RLF
industry,respon-dents to our surveyindicated a greatneed for
ad-ditional capital. In fact, a total of 15
RLFs
inNorthCarolina reported a
combined
need of$19.3million in additional capital, or almost 25 percent
ofthetotal capitalbase of
RLFs
inthestate.Another 19
RLFs
in the state reported $11.7million inavailable capital for lending. While this
might appear a likely source for funds that need
additional capital, this level of available funds
may
also represent a prudent reserve of 10-15percent.
Where
tlieMoney
Goes:Loan
productsAt
the median, the averageloan sizereportedby
North Carolina'sRLFs
was
$51,500, with theloans ranging in size
from
$17,500 to $100,000.This average loan size'
was
the largestamong
allStates studied as part of Counting
on
LocalCapi-tal. Moreover, the
median
minimum
loan size($17,500)
was
higher than that reported in anyother state. If outliers such as the Self-Help
Ven-tures
Fund
and the four housing/economicdevel-opment RLFs,
are excluded, the average loan sizeand the
median
minimum
loan size both increaseto $63,250 and $20,000, respectively.^
Interest-ingly,
when
examining averageloansizebased onthe age of the fund, it appears that older
RLFs
tend to have lower average loan sizes thannewer
funds.
In terms of fmancing position, the largest
share of
RLFs
in the state (45 percent) offersub-ordinated financing.
Almost
one-third ofRLFs
(30 percent) offer primary fmancing. Another 25
percent of funds reported "other" positions,
in-cluding "gap financing" and "equal collateral."
However,
ofthe funds that offer primaryfinanc-ing, one-halfare
newer
fimdsthathavemade
theirfirstloan since 1990.
RLF
loan termsThe
averageRLF
in North Carolina offersloans at an interest rate of4.5 percent and aterm
of8 years. In addition, the vast majority of
RLFs
(75 percent) charged fixed rates
—
only a smallminority (7 percent) reported offering variable
rates.
The method
of establishing the interest ratevaried across
RLFs
in North Carolina andpro-vided
some
rather contradictory fmdings.Of
the23
RLFs
that responded to a question aboutwhat
kind of interest rate they charge, almost
40
per-centindicated charging a subsidizedrate.
Twenty-five percent of respondents indicated charging a
market rate.
Another
37 percent of respondentsreported charging a rate based
on
some
"other"formula, typically one based
on
the prime rateplus a certain percentage point or
some
otherun-subsidizedrate.
Ifone
combines
these "other" responses withthose charging marketrates, it
would
appear thatthe majority of
RLFs
in North Carolina do notsubsidize the interest rate charged for their loans.
However,
basedon
the responsesfrom
the eightRLFs
that reported the interest rate that theycharge, a
median
figure of4.5 percent, itwould
appear that
RLFs
inNorth
Carolinado
charge asubsidizedinterest rate. Thus,the data
on
whetherRLFs
in North Carolina typically charge marketor subsidizedinterestratesisinconclusive.
Businessestargeted
Existing businesses are the primary target of
North Carolina
RLFs.
Of
the 23 respondents (outChart2. Types
of
businesses targetedbyRLFs
inNorth
Carolinaofa total of
27 RLFs)
who
reported that theytar-get particular groups ofpotential borrowers, the largestpercentage (87 percent) indicated that they
target existing businesses.
At
thesame
time, alarge percentage ofrespondents (78 percent) also indicated that they target start-up businesses. In
addition,almost half (48 percent)ofthe
RLFs
that target particular groups of borrowers report thatthey target microenterprises. Further, while both
older and
newer
funds targeted start-ups andex-isting businesses fairly equally,
newer
fimdstended to target microenterprises
more
frequentlythan olderfunds.
Additionalproduct
demand
Sixty-eight percent of the respondents
indi-cated that the
most
commonly
requested productnot offered
by
NorthCarolina'sRLFs
was
ventureor equity capital. Despite this
demand,
though,there is ver>' little activity around venture or
eq-uity capital
among
the state's RLFs.Only
onefund that
was
identified, butwhich
did notreturnCFED's
survey, offers equity financing tobor-rowers. This fund, the Innovation Research
Fund
(IRF) ofthe NorthCarolinaTechnological
Devel-opment
Authority, is yet anotherexample
of acentrally-operating, state-initiated
RLF.
The
sec-ond most
frequentlyrequested servicenot offeredby
North Carolina'sRLFs
was
management
training, followedby worker
training.LendiBg
Activityand
Fund
Performance
Lending
activityRLFs
in North Carolinamanage
a currentportfolioofalmost$46 millioninloans andreport
cumulative lending activity of over
2000
loansworth
more
than $102million.On
amedian
capi-tal base of$1.3 million, the average
RLF
hasal-most
20 loans outstanding worth $763,729.On
acumulative basis,the
same
averageRLF
hasmade
33 loans for slightly
more
than $1 million.From
theperspective oftheaveragefund, itappearsthat
RLFs
inNorth Carolina are only barely revolvingtheir capital, if atall.
However,
excludingthe fourhousing/economic development
RLFs
(forwhich
there isalmost
no
lending data), North Carolina's"economic developmentonly"
RLFs
havemade
atotal of $101,874,615 loans, cumulatively,
on
slightly less than $70 million in capital. Thisseems to indicate that
some
of the state's funds.particularly largerfunds, are revolvingtheir
capi-taltoa
much
largerextentthanothers.Compared
to the other states in the Counting on Local Capital project,RLFs
inNorth Carolinaappear to be relatively effective lenders. For
ex-ample,
among
the sixstatesthatreportedcumula-tivelendingfigures,
RLFs
inNorthCarolinamade
the thirdhighest cumulative
number
ofloans andthe third highest cumulative dollar
volume
ofloans. This
was
accomplisheddespite the fact thatNorth Carolina contains a smallertotal
number
offimds than all but one other state and thatNorth
Carolina ranks fifth
among
the seven statesstud-ied in terms of total capital. In addition, North
Carolina
RLFs
reported the highestmedian
per-centage (73 percent) ofcurrent loan
volume
as ashareoftotalcapital.
Additional data
on
lendingactivity:•
Only
22 percent (6 out of 27)RLFs
haveloan loss reserves.
The
total accumulated inthese loan loss reserves across all
RLFs
inNorth Carolina
was
only $1,619,841—
orslightlylessthan 2percentoftotalcapital
re-ported.
• Credit tests
on
borrowers are verycommon.
Eightypercent of respondents indicated
per-forming
some
type ofcrediteligibility teston
prospectiveborrowers.
Delinquencies
and
defaultsBecause
there isno
standard definition ofde-linquencies in the
RLF
industry, surveyrespon-dents
were
firstaskedhow
they definedelinquen-cies.
Almost
two-thirdsofthe surveyrespondents(63 percent) reported a definition for delinquent
loans.
The most
common
definitions ofdelin-quency
were
equally splitbetween
"paymentsover 30 days late" (35 percent) and "payments over60 days late"(35percent).
In total, the
20
RLFs
that reported ondelin-quencies reported a total of 135 delinquent loans
valued at $2,523,030. Delinquency rates
among
individual funds rangedfrom
percent to 16.9 percent.The
aggregatedelinquencyrate for the 15RLFs
that reported at least one delinquent loanwas
4.8 percent; the aggregate delinquency rate for the20
RLFs
who
reported zero ormore
delin-quencies
was
4.3 percent.These
rates contrastfavorably
when
compared
with delinquency ratesamong
small banks. For example, basedon
pre-liminary data for 1998, thepercentage ofpastdue
and "non-accrual"commercialloans
among
bankswith
$300
million in assets or lesswas
5.22per-cent.^
Compared
with delinquencies, informationabout defaults
was
not reported as consistentlyamong
theRLFs
that responded to our survey. Infact, only
40
percent of the survey respondents(11 out of27) could provide a definition of
de-faults.
The most
common
responses ranged from60 days pastdue (25 percent) to 90 days pastdue
(16 percent) to 120 dayspastdue(25 percent).
Intotal, the 14
RLFs
thatreported on defaultsreported a total of 173 loans in default valued at
$1,614,062. Defaultrates
among
individual fundsranged from percentto 11.2 percent.
The
aggre-gate default rate for the 9
RLFs
that reported at least one loan in defaultwas
4.1 percent; theag-gregatedefault rate forthe 14
RLFs
thatreportedeither or
more
loansindefaultwas
3.5 percent.Performance measure:
Portfolio atriskThe
RLFs
reporting defaulted and delinquentloans providethe
raw
dataneededtocalculateoneofthe
most
importantperformance measures:per-centage ofportfolio at risk. In assessing the
vi-ability andsustainability ofthe
RLF
industry, itisessential that practitioners and fimders determine
the total
amount
ofthe capital that is currently at risk, eitherbecause of delinquencyordefault.The
chart above reveals that eight to nine percent ofthe capital base is currently at risk.
While
thisdoes not
mean
thatall thiscapital willbe lost, itisan important indicator for evaluating the risk of
RLF
portfolios and the level ofloan lossreservesthat are necessary to ensure that the industry's
capital baseisnot eroded. Currently, the loan loss
reserves totaling slightly less than 2 percent of
totalcapital areinadequatetoreplace the capitalat risk.
Technicalassistance
The commitment
to providing quality techni-cal assistance services to borrowers appearsrela-tively strong
among RLFs
inNorth Carolina.The
large majority of the state's
RLFs
(80 percent)provide
some
type oftraining or technicalassis-tance to borrowers.
The
servicemost
commonly
provided is one-on-one technical assistance (80
percent).
The
secondmost
frequently offered typeofservice
was
classroomtraining(40percent).Of
the 16respondentswho
reportedprovidingone-on-onetechnical assistance, almosttwo-thirds
also reported providing
some
other type ofserv-ice. This
would
suggest thatmost
funds providetechnical assistance, not simply as a cursory
service, but rather as an essential part of their
products and services.
However,
this ismore
characteristic ofthe
newer
flmds, as 75 percent ofthose funds offering
no
technical assistanceserv-ices
made
their firstloanin 1985 orearlier.RLF
management and
administrationRLFs
in North Carolina typically rely onrather limited staff and resources to accomplish
their mission.
Based on
information reported by11 of27 survey respondents, the
median
RLF
inNorth Carolina has one staffperson and an
oper-ating budget of $60,000 peryear. This falls inthe
middle ofthe
few
states in the project that couldprovidesignificantdata
on
this question.Despite these rather limited resources,
RLFs
in North Carolina typically provide the range of managerial and administrative tasks
common
toRLFs,
andby
and large,do
soin-house.The most
common
tasks provided in-houseby
NorthCaro-lina
RLFs
were
loan packaging (92 percent),fol-lowed by
receipt of loanpayments
and portfoliomanagement
(83 percent each). North CarolinaRLFs
use outside contractors to a lesser extent,although a significant portion contracts out for
loan closings (29 percent)
and
liquidations (25percent).
The
taskmost
commonly
not providedby
North CarolinaRLFs
was
underwriting (25 percent).Thismay
be areflection ofthe fact that,since a large share of
North
CarolinaRLFs
(45percent)typically take a subordinated position on
deals, lenders with the primary position are likely
performthe underwriting.
The
Impact
ofRLF
Lending
The most
common
measure
for assessing theimpact of
RLF
lendingon
individuals andcom-munities underserved
by
private fmancialinstitu-tionsisto
measure
jobcreationandretention. Thismeasure
is notoriouslydifficultto quantify, giventhe inherent complexity ofthejob creation
proc-ess and the difficulty ofisolating the importance
ofa single factor, even one as important as
capi-tal, in such a
complex
process. Nonetheless, jobcreationremains thebest
proxy
availabletoRLFs
for
documenting
the impact oftheirlending ontheeconomic
condition ofdistressed communities or individuals.Thus,this articlepresentsthisdataforNorth Carolina
RLFs
below, along withinforma-tion about the extent to
which
RLFs
in the statetarget different types of communities and
indi-vidualsthat
may
lack accesstocapital.Job
creationand
retentionThe most
common
impact measures usedby
North Carolina
RLFs
arejob creation (70 percentofsurvey respondents) and job retention (63
per-cent). Together, the
RLFs
who
responded to thesurveyand couldprovide data
on
job creationandretention helped to create 5,257 jobs and retain
another 5,793.
By
far, the leaderamong
thestate's
RLFs
was
the Self-Help Ventures Fund,which
reportedhelpingtocreate 1,580jobs andto retain3,605,almosttwo-thirds ofalljobs retainedby
RLF
lendinginNorthCarolina. In comparison,the typical
RLF
was
focusedmore
on
jobcreation than retention, reporting amedian
of 170 jobscreated and
46
jobs retained.Only
a handful ofNorth Carolina
RLFs
reported data onself-employment.
This
median
figure of 170 jobs created perRLF
inNorthCarolinawas by
far thehighestme-dian job creation figure
among
the six states inour study that provided significant data
on
jobcreation and retention.
However,
onemust
becautious in interpreting these figures. In addition
to the difficulties with reportingjob creation and
retentionmentioned above, it
must
also be notedthat only 56 percentof NorthCarolina survey
re-spondents actually reported data
on
job creationand only
44
percenton
job retention. In general,there is a great
need
toimprove
the definitionsand reporting
methods
for impact measureswithinthe
RLF
industry.Targetingstrategiesfor
RLF
borrowersThe
practice of targeting capital to specificgroups of borrowers is essential to a strategy for
reaching underserved entrepreneurs.
Not
surpris-Table2.
Borrowers
targeted:
(%
of
RLFs)
Low/Moderate
income:
83%
Women:
58%
Disabled:
17%
Minorities:58%
Youth:
4%
Other:
29%
ingly, in North Carolina almost all
RLFs
target their lending to potential borrowers in particularunderservedgroups. In fact, only
two
respondents(7 percent) indicated that they did not practice
some
kind oftargeting.The
groupmost
likely tobe targeted
was low
to moderateincome
borrow-ers (83 percent).
Women
and
minorities (58per-cent each)
were
alsocommon
targets ofRLF
lendinginNorthCarolina.
Conclusions
ThisprofileofNorthCarolina's
RLF
industryleadsto a
number
ofbroadconclusions:In
North
Carolina,RLFs
area $90
millionindustry. Together,
on
a capital base of $90.5million,
RLFs
in North Carolina havemade
over2000
loans worth over$102
million.As
a resultofthis lending, these
RLFs
have helped to retainalmost 5,800jobsandcreateanother5,200.
Unlike
most
other states,North
Carolina'sRLF
industry hasa
unique
structure that is, inlarge part, aproduct
of
stategovernment
policyand
funding.While
most
states have a largenumber
ofrelatively smallRLFs,
North Carolina hasa fairly smallnumber
offundsthat are larger in size.With
amedian
loan fundsize of$1.3mil-lion.
North
Carolina's funds are,on
average,sig-nificantlylargerthan the
RLFs
in any oftheotherstatesstudiedforthisproject.
Moreover,
much
of the resources in theseRLFs
areconcentratedinafew
fundsthatoperatestatewide
and
havereceived significantresourcesfrom
the stategovernment.This includestheSelf-Help
Ventures Fund, the state's largestRLF,
whose
rapidgrowth hasbeen
aidedby
state gov-ernmentresources, including a multi-milliondol-larappropriation in 1995. This alsoincludes both
the Microenterprise
Loan
Program
of the NorthCarolina Rural
Economic Development
Centerand the Capital Support
Loan Fund
ofthe NorthCarolina Minority Support Center, each of
which
was
initially created with a GeneralAssembly
appropriation and operates statewide through a
network
of local organizations. Finally, this listcontains the large
Community
Development
Block
Grant(CDBG)
RLF
at the Department ofCommerce
Finance Center,which
hasgrown
rapidly as the result ofa
key
policy decision intheearly 1990s. Since 1992,allunitsoflocal
eminent have been required to return all
repay-ments from loans
made
to private companiesus-ing
CDBG
funds to theCommerce
FinanceCen-ter. Previously, these repayments had
been
usedby
some
local governments to create theirown
RLFs.
There is
some
evidence that the uniquestructure
of North
Carolina'sRLF
industryhasledtogreaterlendingefficiency. First ofall, on a
very basic level, almost all of
RLFs
in NorthCarolina are active. Eighty-three percent reported
making
at least one loan in the past six months, a figure that is the second highestamong
all otherstates surveyed as a part of this project. Second,
these funds are
making good
use oftheir capital.RLFs
inthestate reported the highestmedian
per-centage (73 percent) ofcurrent loan
volume
as ashare oftotal capital. Third,
among
the six statesthat reported cumulative lending figures,
RLFs
inNorth Carolina
made
the thirdhighest cumulativenumber
ofloans and the third highest cumulativedollar
volume
of loans. Thiswas
accomplisheddespite the fact that
North
Carolina contains asmaller total
number
of funds than all but oneother stateand that thestate ranksfifth
among
thesevenstatesstudiedintermsoftotalcapital.
Finally, with a larger
median
loan fund size ($1.3 million) than in all the other states studiedfor this project. North Carolina's
RLFs
may
beclosertoachievingsustainability thanthe fundsin
those other states. Practitioners estimate that it
takes a capital base of $3 to $3.5 million and an
active loanportfolio ofatleast$2 million to
gen-erate both the revenues necessary to support the staffneeded to operate a
RLF
professionally andthe
volume
of loans necessary to achieve area-sonablydiversified portfolio.
But, hasgreater efficiency ledtoless equity?
The
flip side ofNorth Carolina'sRLF
industry,which
is characterizedby
relatively larger,poten-tially
more
efficient funds, is the fact that there are fewer ofthem.While
this survey could notdetermine whether access to
RLF
capitalwas
relatively
more
uneven
across North Carolinacompared
with statesthathave
hundredsoffimds,such a fmding is not inconceivable. Moreover, North Carolina's typically larger funds carry the
highest average loan size ($51,500) of all the
states studied.
While
this loan size is still notwithin the range typically offered
by
commerciallenders, does this
mean
thatsome
smallerborrow-ers in the target markets ofthese funds are not
being served?
These
are questions that call for further inquiry.In order to continue growing, the state's
RLF
industrymust overcome
some
fundamental
barriers related to its unique structure.
The
handful of larger funds that dominate the state's
industry
and
havebeen
theprimarybeneficiaryofdirect state funding and policy support tendto be
high-performing,
have
a diversified capital base,and revolve their capital.
On
the other hand, therestofthe fundsinNorthCarolina's
RLF
industrydo
nothave avery diversified capitalbase and,on
average, are only barely revolving their capital, if
atall.
Building North Carolina's
RLF
industry willrequire a two-pronged strategy that will require
both increasing the total
amount
ofcapital in theindustry and, at the
same
time, building theman-agement
capacityand
sophistication oftheaver-age fund.
RLF
practitioners and statepolicymak-ers should consider a formal intermediary or
in-dustry associationto carry outthisstrategy.
Increasing the
Amount
of
Capital in NorthCaro-lina RLFs.
The
North CarolinaRLF
profilere-vealed asignificant
demand
foradditional capital.While
the state'sRLFs
appear to be, on average,more
efficient thatRLFs
inotherstates, thestate'sindustry is relatively small, even after adjusting
for population differences.
Among
the sevenstates studied for the Counting
on
Local Capital project, North Carolina ranked fifth inRLF
dol-larspercapita.
One
possible strategy for increasing theamount
ofcapitalinNorthCarolina'sRLFs
would
be to explore the creation of
mechanism
to poolexisting fiands so thatthey canbe used
more
effi-ciently and effectively. In order to explore this
possibility, the survey asked
RLFs
if theywould
supportthe creation ofa regional or statewide
in-termediary or support organization to deliverthis
typeofservice.
While
the responses in North Carolinawere
notquiteas enthusiastic asinother states,there
stillappearstobesignificant interest insucha
concept.
Given
this interest, the state'sRLF
prac-titioners should
now
considertheestablishmentofTable3.
Ranking of
needsinsurvey
(%
of
respondents ranking)"mostimportant" "second
most
important"
Data
Collection35%
10%
Portfolio
Management
16%
11%
Asset
Management
6%
0%
Policyand
Advocacy
10%
5%
CapacityBuilding
19%
33%
Evaluation
5%
25%
Secondary
Market
16%
21%
a
more
formal institution—
whether aninterme-diary or a tradeassociation
—
to assisttheindus-try.
With
the need for additional capital farout-weighing available capital
among
the state'sRLFs,
though, such aninstitution shouldfocus onmuch
more
thanjustre-allocating existingcapital.Rather, this
new
institution should have a broadmission that
would
include both increasing totalcapital in the state's
RLFs
and
building theman-agement
capacityofthestate'sfunds.Increasing the
Management
Capacity in NorthCarolina
RLF.
In considering strategies forin-creasing the capital in
North
Carolina'sRLFs,
whether
by
accessingnew
sourcesofcapital, suchas private
bank
capital or secondary markets, orby
utilizingnew
types of capital, such as debtcapital, one important consideration
must
not beoverlooked. All ofthese strategies will require a
new
level ofstandardization in loan underwritingand documentation procedures across
RLFs
inNorthCarolina.
For the
most
part, the North CarolinaRLF
profilerevealedthattheperformance ofthestate's
average fund lags behind the small cluster of
in-dustry leaders. Nevertheless, in a state with
rela-tively
few
funds, these funds are critical inen-suring equitable access to
RLF
capital across thestate.
Of
course, the state's average funds areby no
means
unsophisticated.For
example,compared
with the
RLFs
in the other states studied for thisproject. North Carolina's
RLF
reportedsome
ofthe highest levels
of
computer technology usagein datacollection. Yet,
when
asked abouttheim-portance of various support services needed to
improve
RLF
performanceand impact,oursurveyrespondents indicateda
number
ofneeds.The
needmost
frequentlymentioned as either"most
important" or "secondmost
important"by
respondents (52 percent)
was
capacity building.Assistance with data collection (45 percent) and
secondary markets (37 percent)
were
alsomen-tioned frequently
by
respondents as themost
im-portant orsecond
most
important need.These findings reinforcethe
need
fora formalmechanism
—
whetherinstituted in a tradeasso-ciation or intermediary
—
to build themanage-ment
capacity of the state's fundsby
capturingand
sharing the expertise of industry leaders inNorthCarolinaandnationwide,
^jj^
Endnotes
' Throughoutthisrqjort,
when
referenceis
made
tothe"average loansize"of NorthCarolinaRLFs,this refers to
—
moreprecisely—
themedianoftheaverage loansizeofall27
RLFs
includedinthis study.We
usethisabbreviatedterminologytomake
the textmorereadable.^Partofthereasonforthislarger
minimum
sizeof loansisthatmostofthestate'smicroenterpriseprogramscountasone
RLF
undertheRuralCen-ter'sMicroenterpriseLoanProgram.
^
FRBSF
EconomicLetter,"New
View
ofBank
Con-sohdation,"FederalReserve
Bank
ofSanFran-cisco,