Making
the
Land
Use
Water
Quality
Connection
An
Assessment
of
Land
Use
and
Water Resource
Planning
inNorth
Carolina
Sara Hinidey
and
Edward
J.Kaiser
In the
summer
of 1998, the N.C. Division ofCommunity
Assistancefianded a study
by
the authorstoexamine
thestate of waterquahty planningin North Carolina.
The
study included a survey and evaluation ofcompre-hensive/land use plans across the state. This article addresses the fmdings
from
the survey and evaluations, and proposes guidelines for effective land useand waterresource planning.From
the studywe
conclude North Carolinacommunities arenot yet ad-dressing water quality in theircomprehensive plansfor futureurban growth.The
localadministratorswe
surveyedsay waterquality issues areimportant-particularly the protectionofpublicwater supplies
-
buttheplanswe
evalu-ated do not reflect the magnitude ofthis concern.
The
plans,most
notably,fail to recognize the connection
between
landuse and waterresource plan-ning, evidencedby
their general inattention to water quahty issues andde-velopmentsuitabilityanalyses.
Part ofthe
problem
lies intheuneven
quality ofplanning itself. Forex-ample,
we
found that inadequate attention to the planning information base tended to cut across all subjects, notjust water resource issues.A
smallmi-nority ofcommunities have separate
documents
addressing waterresources, such as public water or sewer service area extension plans and stormwatermanagement
ordinances.But
theexistence ofsuchdocuments doesnotrem-edy the failureof comprehensiveness.
The
connectionsbetween landuseandwaterquality
must
beaddressedin acomprehensive landuse,environmental,and infrastructure plaiming process.
The
failure todraw
those connectionsadequately will ultimatelyhandicapanypolicies orprogramsintended to ad-dress waterquality.
Methodology
The
study included a surveyoflocal administratorsinevery municipalityand county in the state.
We
received survey responsesfrom
99 ofthestate'sSara Hinkleyisa
canidatefora
Master'sinRegional
Planningatthe
Department ofCity
andRegional
Planning. Universityoj
North Carolinaat
ChapelHill.
Dr.
Edward
J.Kaiserisaprofessoratthe
Department.
He
isaco-authoro/Urban
Land UsePlanning,
fourthedition.
100 counties,
47
municipalities with populationsover 10,000, and 283 municipalities with fewer
than 10,000 people.'
The
study also involved anevaluation of plans fi-om
44
counties, 22 citieswith populations over 10,000, and 32 cities with
fewerthan 10,000 people.
The
survey asked administrators about the importance of particular water quality issues tothe community.
The
survey also asked whetherthe
community had
a comprehensive or land useplan, and ordinances relevant to water quality.
(See Figure 1 forthelistofsurveyquestions.)
The
plan evaluation instrument addressedboth quality and scope ofcontent in the 98 plans
surveyed.
The
instrument reflects our convictionthat land use
and
water quality are inextricablyrelated, and that water resources can be
ade-quately protected only
by
inclusion ingood
com-prehensive land use plaiming.We
divided the evaluation into five elements: participation, val-ues, information base, policies, andimplementa-tion.
We
recorded inclusion or omission ofpar-ticular issues in plan component, and evaluated
the quality of the treatment of
some
planele-ments. (See Figure 2 foran outline ofthe
evalua-tioninstrument.)
Survey
ofCommunities
Our
survey revealed that theoverwhelming
majorityoflocal administratorsbelieve protectionof public water supplies is the
most
importantwater resource issue faced
by
their community.We
asked local officials to rate a list of17possi-ble water quality issues as "very important,"
"somewhat
important," or "not important." Table1 lists the issues
most
often listed as "veryim-portant."
Some
85 percent of North Carolinacounties and municipalities listed protection of
public water supplies as a "very important" issue;
andthe proportion goes over90 percentforcities.
The
plan evaluations revealed a similar emphasis-
the strategyand
value evidenced in the largestnumber
ofplanswas
"urban growth anddemand
forwater supply."
Perhaps
most
notable is thenumber
of issuesrankedasvery important
by
a significant share ofrespondents.
At
least half oflocal officials rated the following as "very important:" expanding wastewater collection/treatment capacity (56per-cent); protection/improvementof streamcorridors
(54 percent for all places, but 61 percent in the
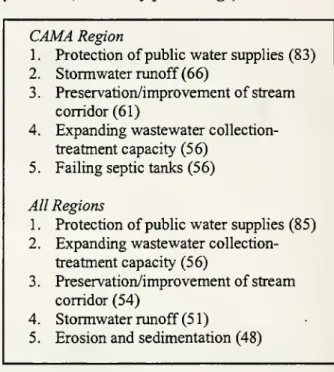
Table
1.Top
5
issues rated "veryim-portant"
(ranked
by
percentage)
CAMA
Region1. Protection ofpublicwatersupplies (83)
2. Stormwaterrunoff (66)
3. Preservation/improvement ofstream
corridor(61)
4.
Expanding
wastewatercollection-treatment capacity (56)
5. Failing septictanks (56)
Al'Regions
1. Protection ofpublicwatersupplies(85)
2.
Expanding
wastewatercollection-treatment capacity(56)
3. Preservation/improvementofstream
corridor(54)
4. Stormwaterrunoff (51)
5. Erosionandsedimentation(48)
CAMA
region);and
stormwaternmoff
(51per-cent for all places, but 66 percent in the
CAMA
region and61 percentofcities).
There is
some
variation in responseby
regionand type of government. Generally, counties and
towns placed higher importance
on
failing septictanks, agriculture runoff, protection of
shell-fish/fish habitats,
and
landfills. Citieswere
more
concerned with stormwater runoff, floodplain
management,
small wastewater treatment plants, andbrownfieldsthanwere
towns
andcounties.Different areas ofthe state also have varying concerns. Erosion and sedimentation
were
consid-ered very important to 61 percent of mountaincommunities (compared to
48
percent of allplaces).
Governments
intheregionaffectedby
theN.C. Coastal
Area
Management
Act(CAMA)
answered "very important"
more
than othergov-ernments for almost all water quality issues, and
significantly
more
in particular for protection ofhabitats and failing septic tanks.
When
asked,"whatisthe mostimportantwater quahty issue?",
halfofthe communities cite protection ofpublic water supplies.
The
proportionwas
fairlyconstant over all types ofjurisdictions and regions ofthestate. Wastewater collection
was
themost
Figure1.
Sample
of
surveyquestionsDoes
yourareahaveaplanwhich
specifiesthedesired landusepatternordevelopmentpoliciesforyourjurisdiction?
Does
theplanspecificallyaccountforanystate designatedstreamclassifications?Has
the landuse plan significantlyinfluencedany waterqualitypolicydebatesinthelastfiveyears?
Was
thelocation forthemost
recentwastewatertreatment plantselectedbefore orafterthecurrentplan
was
written? Ifafter,was
selectionofthesiteinfluencedby
thecurrentplan?Isanypartofyourjurisdictionserviced
by
aseparatewaterrelatedutility?Does
yourarea have: NaturalHazard
Mitigationplan, capitalimprovement program
orplan,public waterserviceareaextensionplan,publicsewerservicearea extensionplan, zoning
ordinance, subdivisioncontrolordinance,flood
damage
prevention ordinance, stormwatermanagement
ordinance?Figure2.
Summary
of
planevaluation1. Participation:
Forms
ofpublic participation • Characterization: verbalpolicies, landusementioned designation, small areaplans, land
• Explanation of plan
making
process classificationsystem• Explanation of planning,theplan'spurpose, or • Regulations: densitybonuses,impactfees,
missionstatement urbangrowth boundary,etc.
• Intergovernmental:
mechanisms
for2. Values: Predominantvaluesinplan intergovernmental coordination regarding
•
Method
usedtoexpress values(e.g.explicitor development,waterquality, orwastewaterimplicit, inoneplace ordispersed) treatment
•
What
goaldrives thewaterquality focusofthe •Plan
extensions: e.g. water supplyplan.plan watershed
management
plan,small areaplan,capital
improvement
plan3.
Data CoUection
&
Analysis: (elements scoredfi-om0-2) 5.
Water
QualityPolicies(same
asabove)Generalelements: population,
economy,
•Water
quality issuesaddressed: e.g. sewerexistinglanduses,etc. servicearea, agricultural runoff,wetlands
Land/Environmental: soil/geology; topography; • Waterquality tools: e.g.riparian buffers.
land cover;habitats; etc. waterconservation,criticalareas
Water: water supplysurface water; • Characterization
of
policies: characterizegroundwater; sedimentation;etc. values drivingwaterquality strategies
Other: airquality; solidwastedisposal;
developmentsuitability;etc. 6. Overall Quality Rating:
Demand/Capacity
Analysis: future • Implementationland/wastewater treatment/water
demand;
etc. • MonitoringandevaluationExistingpolicies: state,federal, localpolicies •
Water
qualityand/orrequirements •
Development
management
mindset(e.g.growth
accommodating)
4.
Intended
Policies (elements scored 1 if •referenced, included,or proposed, ifnot)
Complete
plan• Policies characteristics: are policies specificor
general,incorporate extra-local strategies
places, a concern that
was
also fairly constantamong
all local governments.Next
in order ofpriority were stormwater
management
and failingseptic tanks, though stormwaterrunoffis the
sec-ond most cited issue for larger municipalities.
Cities exhibited less variation in the issues
con-sidered "most important." Ninety-three percent
citedone of fourissues: protectionof public water
supplies, expanding wastewater
collec-tion/treatment capacity, stormwaterrunoff, or
de-finingwaterand sewerareas.
Just over half of all the survey respondents
have a land use orcomprehensive plan. That
fig-ure varied widely by type ofgovenunent: 91
per-cent ofcities hadplans,
compared
to only 39per-centoftowns and71 percentofcounties.
The
vastmajority
-
85 percent - of all plans have beenformally adopted.
Of
the remainder, half have been"formally accepted."Plan Evaluation
We
foundsome
indications thatcomprehen-siveplans arenot following general guidelines for
good
planning (e.g. those outlined by Kaiser,Godschalk and Chapin in
Urban
Land
Use
Plan-ning and the
Growing Smart
guidelines publishedby
theAmerican
Planning Association).Only
aslight majority of plans
made
connectionsbe-tween goals, objectives, andpolicies, and only
20
percent prioritized their proposals or strategies.Most
plans also lacked evaluationmechanisms
orcriteria.
The
evaluation results for three sections,values, information base, and policies are
dis-cussed below.
Plansection: Values
The
values section of a comprehensive plan provides the goals and objectives that will drivethe community's growth
management
strategiesand policies.
The
authors determined thatmost
plans based their approach on a narrow scope ofvalues.
A
majority of the plans' values sectionsrecognize the importance of
accommodating
ex-panded need for water
management
systems:60
percent value growth and
demand
for wastewatertreatment, and 63 percent value growth and
de-mand
forwater supply.An
underlyingassiraiptionbehind these values seems to be that water is a
managed
flow for basic domestic needs.Few
communities address water as an
economic
re-source for commercial or tourist uses (only
32
percent), or as a natural resource with
non-commercial value(also32percent).
County
governments value water qualityinat-ters
more
than city andtown
governments, theevaluation results suggest. For example,
42
per-cent of county governments value water as an
economic
resource to be protected, while only 17 percentofcitiesand 25 percentoftowns have thisperspective.
A
higher percentage of county plansalsoemphasizetheprotection ofwaterasa natural
resource
-
36percent-
than city (26percent) andtown
(31 percent).County
plansmore
often valueprotection ofthe public water supply (62 percent,
versus 55 percent city and
43
percent town).County
andtown
plans areabout equallylikelytoaddress growth and
demand
for wastewatertreat-ment
systems (67 percent) andmore
likely thancities (54percent). Cities are the
most
likelyjuris-dictions to address
growth
in thedemand
forwa-ter supply (83 percent, versus 74 percent county
and 81 percent town).
These
differences in valueorientation
may
reflect the variation in currentcapacities: cities are
more
likely to have largetreatment facilities, whereas a growing
town
orurbanizing county is
more
likely to be facing thetransition
from
septic systemstotreatmentplants.Plan values also varied significantlyregion to
region.
As
expected, protection of water as aneconomic
resource and natural habitatwas more
often cited inCAMA
communities. Failingwastewater treatment or septic tanks
was
citedmore
often for counties than municipalities, and forCAMA
more
often thannon-CAMA
commu-nities (again, thismay
reflect the larger relianceon septic systems
by
counties andCAMA
com-munities).
Growth and
demand
for wastewatertreatment (60 percent overall) were cited for 70
percent of cities,
and
nearly70
percent for thefast-growing
Piedmont
region communities(com-pared to around
50
percent for other regions).Growth
anddemand
for water supply followed asimilar pattern, ftotection or enhancement of
drinking waterquality
was
identified as a drivingvalue in less than
50
percent of the plans(inter-esting given the
overwhelming
prioritization ofprotection of public water supply
by
surveyre-spondents). Finally, "meeting state requirements"
was
cited as the primary value for nearly 70per-cent of
CAMA
plans,compared
to 45 percent ofallplans, and 68 percentof
town
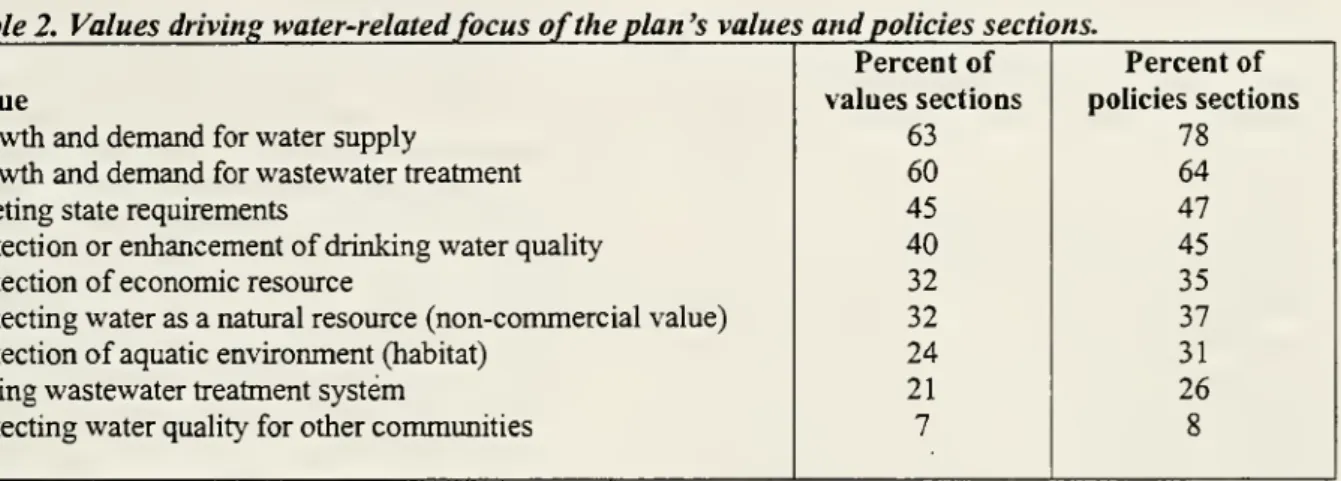
plans (See TableTable2. Valuesdriving water-relatedfocus
of
theplan'svaluesand
policies sections.Percentof Percentof
Value valuessections policiessections
Growth
anddemand
forwater supply 63 78Growth
anddemand
forwastewatertreatment 60 64Meetingstaterequirements 45 47
ProtectionorenhancementofdrinkingwaterquaUty 40 45
Protectionofeconomicresource 32 35
Protectingwaterasa naturalresource(non-commercialvalue) 32 37
Protectionofaquaticenvironment(habitat) 24 31
Failingwastewatertreatmentsystem 21 26
Protectingwaterqualityforothercommunities 7 8
Plan
section:Information baseOur
evaluationoftheinformation base ofplans revealed the greatest shortcomings, and gave ussome
insight into the reason for overall mediocrequality ofthe plans.
The
creation ofan adequateinformation base is perhaps the
most
expensive and time-consumingaspectofplan-making, but itis vital because it affects the quality ofthe
ele-ments that follow.
We
were
particularlydismayed
to finda very
weak
synthesisofthoseinformationelements that were included. For example, land
suitability analyses were rarely included and
few
plans adequatelytreated the
relation-ship
among
dataele-ments. In
most
com-munities, theinfor-mation base appears
to flinction
more
as areflexive preparatory
step topolicy-making,
rather than as a
sig-nificant part of the
policy-making
exer-cise.
The
elements thatcommimities included
in their planning
in-formation base reflect their general values as de-scribed above.
Over
80 percent ofthe plans pro-vide adequate discussion of water supply systemsand wastewater
management,
and roughly aquarter ofthose plans include relatively
sophisti-cated discussion ofthese issues.
However,
fewerthan halfoftheplans include projectionsoffuture
water use or water treatment demands.
The
plansFewer
than
half
of
the
plans
anticipate
future
water
use
demand
or
future
wastewater
treatment
demands.
also include little information about natural water
systems, including wetlands, groimdwater, and
non- water supply surface bodies.
The
plans'in-formation bases are particularly deficient regard-ing the sources of hazardous materials,
sedimen-tation, erodable soils, and the effectofagriculture
on
wetlands. Plans rarely include information ontopography and land cover.
Development
suit-ability analysis, identification of critical areas,
fiittire water and wastewater
demand,
and evenlanddevelopmentprojectionsare included in only
abouthalftheplans,
and
are rarelymapped.
We
alsocompared
eachplan to alistofwater-related information elements, includingboth
natu-ral resource water issues and issues directly
re-lated to public water supply.
Water
supply fromsiu-face water, the
most
commonly
includedin-formation, is addressed
by
fewerthan 50 percentofthe plans.
CAMA
plans are significantlymore
likely than
non-CAMA
plans to includewater-related information, particularly natural hazards
(92 percent
compared
to 40 percentnon-CAMA),
wetlands (78 percentto 24 percent), water quality
conditions (58 percent to
26
percent), andagri-culturalimpacts (27 percentto 8 percent).
We
were
particularlydismayed
by
theinade-quateattention to capacityand suitabilityanalysis.
Demand
and capacity analysis is needed to pro-vide a consistent set of projections for planningefforts and to ensurethat future development
pat-terns
do
not jeopardizethe quality of watersupplyor other water resource. Just imder half of the
plansincluded projections offiature landuse,
wa-ter use, or wastewater treatment demands.
Fewer
than half (46 percent) identifiedlandcontrol areas
jurisdiction).
Land
development trendsand
pro-jections were
more
commonly
analyzed; 60per-cent ofplans included them, and a third ofthose plans receivedhighscores forthe treatmentofthe
element.
Plan
section:IntendedpoliciesThe
policy sections ofmost
plans consist ofgeneral policy statements, rather than specific, measurableactions. Plans are particularlyunlikely
to include spatially-explicit policies.
We
charac-terized each plan as a land use design,
develop-ment managedevelop-ment,
and/or land classification plan(planscouldbe
marked
asmultipletypes). 81per-centofplans include verbal statements or actions (sometimes without explicit spatial designations). Justover halfoftheplans includeclusters of poli-cies associatedwith explicit spatial districts (such
as "urban transition districts" or "conservation
districts").
Land
use designs (for either an entirejurisdiction or small areas within a jurisdiction)
are included in just over a third ofplans.
Those
land use plans only occasionally designated areasforfuture expansion of water
and
sewer services,orannexation.
Inclusion
of
water-relatedstrategiesThe most
notable finding of our studywas
thedifference
between
thenumber
of communitiesplacing ahigh priority
on
public watersupply (83 percent) and thenumber
ofcommunitieswho
ad-dressed protection ofthe public water supply intheir policies (barely 50 percent). Fifty-nine
per-cent include provisions for a sewer service area, and 41 percent address on-site wastewater
treat-ment. Policies regarding natural water processes
and
human
impacton
these systems are evenlesscommon.
About
athird ofthe plans specifysome
sort of wetlands protection, storm water
manage-ment
or sedimentation and erosion prevention.The
plans are even less assertive in addressinghuman
pollutants to water systems. Less than 20percent featureprovisions to mitigate agricultural
runoff orhazardousmaterials.
Relatively
few
plans include developmentmanagement
tools that specifically address waterquality. Best
management
practices (both urban and rural), storm water detention systems, andstorm water detention systems are each included
in only 20 percentofplans. Critical area or
over-lay district designation is used
by
35 percent ofplans, in large part because
CAMA
communitiesare required to use it; the designation is rarely used
by
non-CAMA
communities. Plansmore
commonly
use typical developmentmanagement
tools: zoning or subdivision ordinances (84
per-cent), infi-astructure, provision of services and
capital improvements to
manage
growth (55per-cent), control ofthe type and
mix and
density ofland use (50percent), andcontrolofstructuraland
sitedesign (48percent). Particularly in larger
communities, water quality issues
may
bead-dressed in a separate water resource plan, and
some
growthmanagement
toolsmay
be includedin single-issue plans (particularly capital
im-provement
plans).We
found that althoughmany
communities do have plans in addition to a
com-prehensive plan, water-related plans are the least
common
plan extensions.While
transportationplans
were
referenced or proposed in 75 percentof
community
plans and capitalimprovement
plans in 45 percent; water supply plans were pro-posed in only 43 percent;open
space, recreation,or
greenway
plans in40
percent; storm watermanagement
plans in27
percent; watershedman-agement
plans in 31 percent; and wastewatertreatment plans in 34 percent.
The
surveyques-tionnaire produced similar results: 35 percent of
respondents said they have a capital
improve-ments
plan, but fewer than a quarter have publicwater or sewer service area extension plans.
Nearlyhalfhavea flood
damage
preventionordi-nance but only 15 percent have a storm water
management
ordinance.Are
theplans influencing,orinfluencedby, waterqualitydecisions?
One
measure
ofthe quality of a plan'streat-ment
of waterresource issues is whethertheplan has alreadybeenusefiil in addressing suchissues.We
asked local administrators to indicate there-lationship, if any,
between
their comprehensiveplan
and
the siting of a wastewater treatmentplant.
The
plan significantly affected the locationofthe wastewatertreatment plant in only 15
per-cent (4 of
26
communities) of those communitieswhere
their currentplanswere
written priorto thelocation ofthe wastewater treatmentplants.
Con-versely, the location ofthe wastewater treatment
plants significantly influenced the land use plans
tieat-ment
plantswere
in placewhen
the currentplanswere
written.The
percentage is even lower formountainjurisdictions and for communities under
10,000.
Only
17percentoflocaljurisdictions with land use plans claim that the plans significantlyinfluenced any water qualitypolicy debatesin the
last five years.
One
reason for this lack ofcon-nection
may
be the quality of the plans;most
planswe
reviewed could not in practice provideguidanceforresolving awaterquality decision.
Guidelines:
Ways
tobetteraddresswater
resourceissuesinland use plansGood
water resource protection can only beaccomplished in conjunction with
good
land useplanning. In order to protect water quality,
com-munitiesmust
have alanduse andwater resourceplan that
work
together, although theymay
beseparate
documents
or included as separateele-ments
in acomprehensiveplan.Both
the landuseplan and the water resource plan
must
recognizethe fundamental reciprocity of the relationship
between
landuseand
water resources.The
futureland use plan
must
incorporate the technology,economics, andnaturalprocesses that govern
wa-ter resource planning. Similarly, water resource plans
must
be consistent with proposed fiitureland use patterns. Elements ofthe plans
must
bedesigned in consideration of each other. In
addi-tion, they
must
be developed jointly, each partconsistentwith
and
reinforcingthe other.Three elements are critical to the development ofthisconnection.
1.
Both
land useand
water
resource plansshould
be based
on
acommon,
consistent,and
persuasive set offacts
and
assumptions.Most
importantly, the
demand
estimates for land andlocation that drive the land use plan should be
basedon the
same
populationandeconomic
fore-casts as the
demand
estimates for water andwastewater treatment used in water resource
plans. (In that
way,
both the land use and waterresource planningwill share the basic assumption
about future size
and
shape ofthecommunity
tobe accommodated.) Similarly, planning should be
based
on
athoroughbaselineofinformationabout carrying capacity of the area and potentialenvi-ronmental threats.
2.
The
two
plans shouldhave
compatiblefu-ture spatial designs. Forthat to happen, the
dis-tribution offuture land uses
and
densities shouldbe analyzedand
summarized
by
existing andpro-posed waterand sewerservice areas, aswell as
by
sensitive environmental areas such as watersheds,
flood plains, and wetlands. That is, the plan should estimate the future intended population,
employment, and water/sewer-sensitive land uses
(which represent
demand
for water and sewerservices) notjust forthe entire jurisdictionbut
by
eachseparate water
and
sewerservice area.Simi-larly, highrisk impacts shouldbe
summarized
by
sensitiveenvironmentalareas.
3.
The
land use plan should use landsuitabil-ity
maps
in exploring options for the futureland use pattern of a
community.
Thesemaps
represent assessments ofthe variation in
suitabil-ityofareas for future urban development, as well
as agricultural andnatural resource uses and
eco-logicalprocesses.
Those
analysesandexplorationsshould include the feasibility and
economy
of ex-tending water and sewerinfrastructure, as well as the usual assessmentsofaccessibilityandphysicalfeatures ofthe land. In that way, proposed future
land use designs can incorporate infrastructure
design principles and thus reflect responsible
in-frastructure planning including water and sewer
infirastructure.
The
suitability analysis should alsoreflect relative vulnerability of environmental
features and processes to land use changes and
thus promote environmentally responsible land
usedesigns, aswell aswaterand sewerplanning.
The
following sections provide furtherguid-ance foreach elementofthe
community
plan.Information for
good
planning
The
information base, in addition to includingspecific and consistent assumptions about future
population and
economic
growth, should bein-formed
by
studies ofexisting land use, includingclassifications based
on
the impact of the use onwaterresources. For example, usesmight be
clas-sified as high risk,
medium
risk, andlow
risk towaterquality.
Land
supplyshould not onlybeas-sessed for its market-oriented suitability (i.e.,
as-sessing factors that affect the costs of
develop-ment
andconsumer
preferences about locations),but also for the vulnerability of development to
environmental hazards atthat location, the
vulner-ability of environmental systems to development
at that location, and the reasonableness of
exten-sion ofinfrastructure.
To
conduct the appropriate suitability studies,it isnecessary to construct data inventories for at leastthree categoriesofnatural resources:
• Natural resources tobe respected (e.g.,
state-designated streams and watersheds,
ground-waterrecharge areas, wetlands, and other
ar-easof environmentalconcern);
•
Land
characteristics affecting suitability fordevelopment
and
potential of development tocause environmental degradation (e.g., steep
slopes,erodable soils);and
• Culturalandhistoricsites.
Inaddition tothe studiesofland use,land
sup-ply, and environmentalresources, theinformation
base should
examine
the existingcommunity
fa-cilities with special attention to
pubhc
water sup-ply systems, wastewatermanagement
systerns,and
storm waterand
flood plainmanagement
fa-cilitiesandpolicies. Thesestudies should
map
andinventorytheconditions andcapacitiesofexisting
facilities and proposed changes in those systems; including existing and planned service area boundaries. For larger water supply systems, the
inventory should include sources ofsupply,
treat-ment
works, storage facilities, and distributionnetworks.
Where
groundwater is used for publicwater supply sources, the plan should include an
assessment of groundwater quality and
map
thelocations of well-heads and well-head protection
areas.
Any
necessarynew
water supplywater-sheds should
be
addressed and delineated.The
inventory of wastewatermanagement
systemsshould be equally detailed, with special attention
to parts of the system with inadequate capacity
and where
there areknown
overflows, bypasses,andthreats topublic health,includingproblemsin
unseweredareas.
The
information base should include studiesofexistingwaterresourcepolicies, includingtheir
geographic boundaries, implications for future
land use change, implementation issues, and
gov-ernment capabilities (administrative, financial,
legal) to
modify and
extend its development andenvironmental
management
programs. State andfederal policies or plans with implications for
lo-cal development, and their relationship to local
policy, should
be
described. For example, statewater quality classifications for segments of
streams and lakes should be identified, with
re-lated assessments of
how
well those segmentssupporttheirdesignateduses.
Goals, objectives,
and
prioritiesThe
valuessectionshouldincludebothgoals-ideal future conditions to
which
thecommunity
aspires - and objectives -
which
are measurableintermediate achievements leading to progress on
goals. Objectivesalso serve as
benchmarks
inthemonitoring
component
ofthe plan (See Figiires 3 and4.)The
valuescomponent
oftheplan shouldin-corporate natural resource goals explicitly,
in-cluding goalsandstandards
mandated
by
stateandfederal policy
which
the localgovernment
isle-gally or politically
bound
to implement. Forex-ample, state programs such as the water supply
watershedclassificationsincludebothexplicitand
implicit water quality protection goals,
which
shouldbe includedinthe
community's
plan.They
also include the
commimity's
judgments aboutlevels of water and sewer services required and
environmental qualities
which
are valued. Thesejudgments and values will determine
infi-astruc-ture capacity needs
and
environmental protectionprograms.
Intendedpolicies
The
proposed policies and programs of theplan should incorporate land-oriented policies,
general policies about environmentally sensitive
land use patterns and development practices, as
well aspolicy
maps
ofintendedservice areas,en-vironmentally sensitive areas, and non-urban use
areas.
Beyond
that level of policy, the land useplan can incorporate water and sewer plans and
particular environmental protection plans (e.g., a
watershed land
management
plan)by
referenceorby
summarizingthem
within the land use plan.Ideally,plans shouldutilizeboth the land use and
land classification formats to indicate the future
land development pattern.
As
described at thebeginning ofthis section, the plans shouldbe de-veloped in conjunction with water resource
plan-ningforthe
community.
A
land classification plan should delineatethose areas ofthe planningjurisdiction
where
de-velopment should not occur, such as
environ-mental-conservation areas, areas to be preserved
for agriculture, or lands suitable for development
only in the long-term. Policies for these areas
Figure3.
Orange County Comprehensive Plan
This plan's strong information base
in-cludedinformation likethefollowing:
Water
resourcesWatersheds:
mapped
and analyzedby
riverbasin, with description of existing protection
measures, communities serviced, and head-waters.
Geology
and eroundwater yields: includesdescription and
map
of principal rock types,assessmentofrainfallandyield
by
season, andassessment of contamination problems. Also
includes tables
showing
tj'pe of water sourcefor all housing units
summarized
by
townshipand
number
ofwells and well yields for eachprincipalrocktype.
Floodplains: includes description and
map
of 100-year floodplains and alluvial/hydric
soils,and atable illustrating the frequencyand
duration offlooding and watertable depth
by
typeofsoil.Wetlands: includes a discussion ofthe
en-vironmental benefits thatwetlands provide, an assessment ofthe type and nature of wetlands
in the region, and a description and
map
ofwetlands using information from the National
Wetlands Inventory,
LANDSAT
satellite data,andfieldsurveys.
Land
resourcesSoil conditions: includes tables and
maps
showing method
ofsewage
disposal for allhousing units
by
township, assessment ofsoillimitations for septic tank absorption fields,
andfordwellingswithout basements.
Plant
and
animal resourcesIncludes
maps
ofwildlife corridors,vege-tation, and habitats, and assigns each natural
area a rating for significance, integrity, and
threat.
The
information base concludes withiden-tification and
mapping
ofprimary and secon-dary conservation areas, and aDevelopment
ConstraintsMap, which
consists of overlaysfor floodplains, steep slopes, and impermeable
soils. I*rimary Conservation areas include
"sensitive envirormiental resources,
histori-cally significant sites,and features considered
unbuildable because oftheir limitations or
in-herentunsuitability fordevelopment."
Figure4.Illustrativegoals
and
policy statement(from
Orange County Comprehensive
Plan)Goal
Five: Direct growth to areaswhere
it isdesirable
and
can beaccommodated
Policies/Actions
5.1 Designate landinwater supplywatersheds
which
encircles the water supplyim-poundment
andwhich
drains directly into theimpoundment
and into themain
chan-nels of trunk sfreams feeding the
im-poundment
asWater
Quality CriticalAr-eas, not suitable formoderateto high
den-sity residential development or
nonresi-dential development.
Goal Nine
: Efficient provision of water andsewerservices
Policies/Actions
9.1
Develop
and
implement a cooperativejoint planning process
among
municipali-ties
and
other agencies responsible for waterand
sewer services in the county, toguide extensions in accordance with the
landuse plans and policies ofthe affected jurisdictions.
9.2 Establish a joint
Urban
ServicesArea
formunicipalitiesA, B,
and
C
that willcorre-spond to the 20-year transition areas of
their coordinated municipal land
classifi-cation plans.
9.3 Prohibit water and sewer services in areas
designated
Water
Quality Critical areas,excepttoaddress
emergency
situations.Goal
ten: Clean and safe water supplies ade-quate tomeet
futureneeds ofthe residents ofthecounty. Policies/Actions
10.1
Adopt and implement
policieswhich
specify land use patternsand
intensities ofdevelopment in water supply watershed
and watershed critical areas that will
minimize potential adverse impacts on
waterquality.
10.2 Designateprime futurereservoirsitesto
protect those areas from adverse
develop-ment
impacts while ensuring thatinappro-priate restrictionsarenotplaced
on
a largeproportion of the population or land
re-sourcesofthecounty.
by
statepolicy and locationswhere
water qualityisan issue.
The
plan should also include an intendedde-velopment
management
program,which
may
beoneintegrated
program
ororganizedinto separateparts. For eachcomponent, the development
pro-gram
should specify its content, geographicboundaries or location, relative priority and
tim-ing, and the agency responsible for
implementa-tion. Finally, the development
management
pro-gram
should be followedby
a monitoring andevaluation plan that is integrated into the
imple-mentationprocess.
Conclusions
The
CoastalArea
Management
Act:A
model?
CAMA
has raised the baseline standard ofplanning, especially regarding water quality
is-sues.
CAMA
plans (See Figure 5 forCAMA
counties) are stronger than plans elsewhere in
ad-dressing water
management
as part of a natural,environmental process.
CAMA
plans addresswetland protection
more
thanPiedmont
andmountain municipality plans. Ninety-one percent
of
CAMA
plans provide adequate protection ofwetlands,
compared
to less than 20 percent ofnon-CAMA
plans. Protection ofaquaticenviron-ment
is strongerinCAMA
plans-
itwas
evidentin 78 percent of
CAMA
planscompared
to about 20 percentofnon-CAMA
plans.CAMA
plans arealso consistently stronger than
non-CAMA
plansintheir treatmentofwaterqualityissues related to
human-made
watermanagement
systems.Over
75 percent of these plans address protection of thepublic water supply, sewer service area and
on-site wastewater treatment/septic use.
However,
CAMA
producedfew model
plan elements, andthe overall quality ratings of
CAMA
planswere
not significantly betterthan
non-CAMA
plans. Inparticular,
CAMA
plans areweak
in prescribinggoals and strong overarching policies.
They
ranked significantly behind
non-CAMA
plans inspecifyinga patternoffuturelanduses.
Althoughthe
CAMA
program
doesnotrequireregional planning efforts, it arose from the focus
on
the statewideand
regional impacts ofmultiplelocal plans
on
waterand air quality.By
requiringlocalities to create plans
and
follow a set ofguidelines,
CAMA
has certainly improved thestate of plaiming in the coastal region, but it has
not led to an integrated regional planning effort.
CAMA
could further improve the state ofplan-ning
by
requiring a stronger connection betweeninformation base
and
strategy, inclusionofa landuse design, and regional policy coordination for
protection of environmental resources and proc-esses
on
the coast.Implications
for
regionaland
statewideplanning
effortsCommunity
plans, evenCAMA
plans, do not adequately address statewide requirements orin-tergovernmental cooperation.
Whether
a planac-counts for and adequately incorporates existing
polices at other levels of
government
will affect Figure5.Statusof land
useplanning
inNorth
Carolina, bycounty.I I
CAMA
countiesStatus of landuseplan
I I
No
land use plan[
'""
I
Land
use planthe implementation of the plan, particularly for
issues that have regional implications or that are
affected by extraterritorial development patterns.
Approximately half of all survey respondents
in-dicated that their plans accounted for
state-designated stream and watershed classifications,
with significant variation
among
types ofjurisdic-tions (fewer than
40
percent of municipalities,compared
to approximately70
percent forcoun-ties and for
CAMA
region communities).Fewer
than halfoftheplans mentionedstatepoliciesandrequirements in their information base, about the
same
proportion that mentioned other localordi-nances and plans.
Only
27 percent of the policysections referenced regionally coordinated or
state-wide strategies, and 35 percent proposed
mechanisms
forintergovernmental coordination.The
existence of consistently strong compre-hensive plans across the state will still not ensuretheprotectionofwaterquality.
The
typesofissuesfaced by thecommunities
we
surveyed reveal the need for regional efforts to protect waterre-sources. For example.
Orange
County
containsstreams feeding public water supplies in Orange,
Durham, Chatham,
Person, andAlamance
coun-ties. State requirements can be used to ensure
minimum
levels of protection ofsuch streams, butin
many
cases communities will be unable toim-plement strategies for protection without coordi-nating with adjacent communities. Existing joint
city/countyplarming efforts provideroughmodels
for interjurisdictional plan-making, but
communi-ties need guidance
on
how
to deviseintergovern-mental strategies for particularresource protection
issues that cross county boundaries.
The
statecould promote regional planning
by
providingsuch models in conjunction with a set of general planning guidelines similar to those
we
haveout-lined here.
Such
guidance could helpcommunitiesachieve the water resource goals that are so
im-portant to the sustainability of their future
devel-opment.^^
Authors' note
The
authors wish to thankJeremy
KIop, JeffMasten,
Megan Owen,
and John Davies, Master'sstudents at the Department of City and Regional
Planning, for their assistance with developing and
conducting the survey and plan evaluations and for organizing and analyzing survey and plan evaluationdata.
John
Bemdt
andTom
Richter oftheNC
Divi-sion of
Community
Assistance provided valuableguidance throughoutthe project.
David
Moreau
isco-principal investigator for the project, giving
special attention to water resource protection and
infrastucture issues.
Endnotes
'
For simplicity,
we
refer to municipalities under10,000 population as "towns" and
municipali-tiesover 10,000as"cities."
References
American
Planning Association. August, 1998.Growing Smart
Legislative Guidelines:Model
Statuesfor Planning
and
theManagement
of Change.Kaiser,
Edward
J., D.R. Godschalk, and F.S.Chapin, Jr. 1995.
Urban
Land
Use Planning, fourth edition. Urbana: University of DlinoisPress.