FOR SAMPLING AN AIRBORNE PHARMACEUTICAL DUST
by
Mark Wendell Wood
University of North Carolina Chapel Hill, NC
ACKNOWLEGEMENTS
I would like to thank my academic and research
advisor. Dr. Michael Flynn, for his support and insight. I thank also the other members of my committee. Dr.
Nelson Couch and Dr. Robert Harris.
Mark Wendell Wood. An Evaluation of the 37 mm
Cassette for Seunpling an Airborne Pharmaceutical Dust. (Under the direction of Michael R. Flynn, Sc.D., CIH )
The use of the 37 mm cassette for sampling total
dust in industrial hygiene is well established. This
method is used to make full shift and short-term exposure
measurements. Environmental levels of ranitidine
hydrochloride are typically in the ug/m"^ range. This
necessitates taking short-term samples at flows markedly higher than the usual flow of 2 LPM. The results of these measures should be comparable. If not, then a bias exists in the method of collection in this flow range.
An evalution of the cassette to sample airborne
ranitidine was completed by comparing paired samples with respect to concentration obtained and particle size
sampled. Pairs were run at 2 and 4 liters per minute. No significant difference in concentration was found
in pairs taken in the Fette and dispensing areas. The particle size distributions sampled at 2 and 4 liters per minute were very similar. Thus, no bias was detected in the sampling method between 2 and 4 LPM. Full shift and short-term measures are comparable.
Analysis of the cassette indicates that significant
quantities of ranitidine are depositing on the wall. In
the Fette room more ranitidine deposited at low flow than at high flow. This indicates a possible residence time
phenomenon is responsible. Data from the dispensing area
indicates wall deposition is equal between 2 and 4 LPM.
Possible explanations include sedimentation, impaction
Ranitidine hydrochloride is a pale, yellow substance
•R
used as the active ingredient m Zantac tablets and
injection. Chemically, it is identified as N[2-[[[5- [(dimethylamino)methyl]-2-furanyl]methyl]thio]ethyl]-N-methyl-2-nitro-l,1 ethenediamine hydrochloride. Its
molecular structure is:
(CH3)2 NCH^/^ X5rCH2SCH2CH2NHN>,^/NHCH3* HCl
^C'^ CHNO3
The empirical formula is (C23H22N403S,HC1). Ranitidine
hydrochloride has a formula weight of 3 50.87 atomic mass
units. Its packed bulk density is 0.74g/cc. As a salt,
its vapor pressure is insignificant.
As a treatment for duodenal ulcers, ranitidine's
mode of action is as a histamine H2-receptor antagonist.
The manufacture of Zantac tablets involves a combination
of unit processes. The first is the dispensing of raw
materials. Dispensing in the Zantac suite is done by using a "Matsui". Essentially, this is a large metal
hopper attached to a vacuum source. Bulk ranitidine,
which the components are mixed thoroughly.
From the dispensing station the buls cube is taken
to the mixing room. It is here that the raw materials
are churned by rotating the buls cube continuously. No personnel are permitted in the mixing room during the
process.
After the components are mixed the hopper is moved to the Fette, or tablet compression room. The Fette
machine forms tablets by compressing the powdered mixture using a piston. The raw material is emptied into the Fette by placing the buls cube above the machine and allowing gravity to feed the materials into it. The
process is similar to using a funnel to load oil into an
automobile. Because the process is energy intensive, the
production of tablets creates an airborne dust. This is
evidenced by a heavy layer of dust coating the machine
after a batch is produced. After the tablets are made they are coated (hardened) in the coating room. The
final step before packaging is inspection. The tablets
are placed on a conveyor belt and are inspected by two to
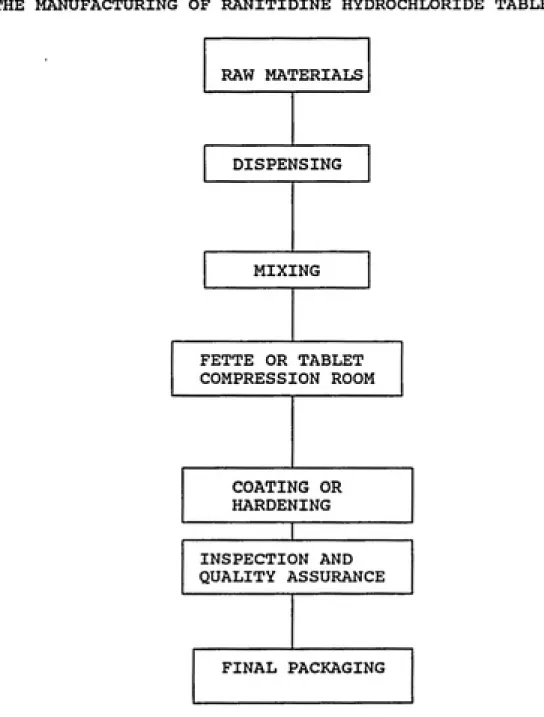
three persons. Figure l.l is a flowchart outlining the
manufacture of ranitidine tablets.
Occupational exposure to ranitidine is major concern
THE MANUFACTURING OF RANITIDINE HYDROCHLORIDE TABLETS
RAW MATERIALS
DISPENSING
MIXING
FETTE OR TABLET COMPRESSION ROOM
COATING OR HARDENING
INSPECTION AND QUALITY ASSURANCE
FINAL PACKAGING
Figure l.l: Flowchart outlining the manufacture of
Ranitidine Hydrochloride Tablets. The highest exposures are
be non-carcinogenic/tumorigenic in mice and rats with
oral doses up to 2,000 mg/kg day, rare cases of
hypersensitivity reactions (e.g. brochospasm) have been
seen (11). Slight dermal irritation has also been
observed (11).
The potential for exposure to ranitidine is mainly in the dispensing and Fette rooms, although, the coating room also presents concern. Based upon previous data collected by Glaxo it is suspected that the greatest exposures are in the Fette room (5).
Assessment of exposure to Ranitidine has been done by using an open-face 37-mm disposable cassette. The collection medium is a Gelman type A/E glass fiber
filter. No organic binders are contained in the filter (9). Chemical analysis has been performed using high
performance liquid chromatography (HPLC). Because ranitidine is a proprietary compound, produced only by Glaxo Inc., a method of air sampling has not been
evaluated. Therefore, it is necessary to objectively evaluate the current method of sampling and analysis.
SAMPLING AIRBORNE DUST
worker. This is done in many cases by an industrial
hygienist. The manner in which this is done depends
upon the chemical and physical characteristics of the contaminant. Also, the purpose of the sampling must be
considered. For example, one may wish to estimate a worker's exposure to respirable particulate. In this
case size selective sampling would be appropriate (4).
Given the plethora of sampling techniques available to
evaluate airborne dusts it is reasonable that the
selecton of a method should satisfy the requirements of sound aerosol science and practical industrial hygiene.
With this in mind, a method of sampling airborne
ranitidine is evaluated. The method considers both the
theory of sampling with cassettes and the practical
limitations imposed by the manufacture of Zantac.
Traditionally, hygienists have sampled airborne dusts using a closed-face cassette, or filter holder.
This practice is especially prevalent in governmental industrial hygiene (1). There exists, however, debate as to whether open or closed face cassettes provide the most
reliable estimate of airborne dust concentration (13). Prior to a detailed discussion of the sampling efficiency
of 37-mm cassettes a brief review of pertinent sampling
mechanics is indicated.
be accurate it is imperative that it be unbiased. That is, the sample should closely resemble the original
aerosol in both concentration and size distribution (4).
The most effective way to attain accurate sampling is to maintain isokinetic sampling conditions. This demands that the sampler inlet be parallel to the gas
streamlines. Additionally, the gas velocity of the
sampler inlet must be identical to that of the gas
approaching the inlet (13). Isokinetic sampling ensures that distortion of gas streamlines at the inlet does not
occur.
This is illustated in Figure 1.2a.
If the free stream velocity is Uq , the velocity of
gas in the sampler inlet by U, and the angle of the inlet
with respect to the streamlines is O, then isokinetic
conditions exist when U=Uq and 0=0 (13).
When these conditions are not met the sample will be biased. If the sample inlet is not properly aligned the
aerosol concentration is underestimated. This results
because particles in the original gas stream have inertia
too great to make the turn into the inlet. This is seen
-I
m
S*TwUr*t pro6«>..
s
ii^////////////////////^:^
(a)
•
(b)
(c)
^in,,:;ri-:ry-^_:y
(d)
Figure 1.2: Illustration of isokinetic and anisokinetic sampling conditions. Adapted from ( ).
Figure 1.2a: Isokinetic sampling conditions present 1.2b: Sampling probe is misalligned
1.2c: Sampling flowrate is > free airstream
1.2d: Sampling flowrate is < free airstream
relationship between misalignment of sampling inlets and aspiration efficiency. They found that collection
efficiency drops markedly as the a probe is moved away
from the airstream through angles of 15- 90 degrees.
Additionally, it was found that aspiration of particles
decreases as particle diameter increases.
If it happens that the sampling flowrate is greater than the isokinetic flowrate particles with significant inertia may not follow streamlines and enter the inlet. This can be see in Figure 1.2c. Therefore, samples
collected under these conditions underestimate actual
concentrations.
When the flowrate of the sampler is lower than the
isokinetic flowrate the measured concentration will be
greater than the actual concentration. This occurs because the streamlines diverge at the inlet and large particles which were not in the sampled gas volume travel
into the inlet (13). This is illustrated in Figure 1.2d.
Much of the preceeding discussion is based upon
sampling in flow systems. Usually, experiments testing the validity of such theory are completed in wind
tunnels. The industrial environment, however, may not
which the hygienist may assume that he is sampling in a
calm-air setting.
If there exists in the occupational environment low air turbulence and low air velocity then it is sometimes
possible to assume the sample is taken from "still air".
According to Davies, there are two errors associated with
sampling from still air: an error due to the terminal settling velocity of a particle and one due to the
particle's inertia (6). The terminal settling velocity of
a particle is given by:
v=Tg, (1)
where T is the relaxation time of a particle and is equal to:
T = (1/18) d^/u, (2) , where d is the
particle diameter and u is the kinematic viscosity. In
equation (1) g is the acceleration due to gravity (980
cm/ sec^).
If the sampling rate is low and the inlet is
oriented upward, particles may settle out of the air and
into the inlet. Thus, the measured concentration is an overestimate of the true concentration. In fact, the
sampling error is considered infinite when the flowrate approaches zero. Conversely, if the orientation of the
inlet is downward an underestimation of concentration
As a particle approaches the inlet of the sampler the influence of the sampler's flow field becomes more
marked. As a result, the particle's velocity , and hence
its inertia, is increased. As this occurs the stopping distance of the particle also increases. This quantity
describes the distance which a particle with a given
velocity in still air will travel under its own inertia
before stopping. If the stopping distance is large relative to the dimensions of the inlet, the particle
may travel across or away from the inlet and escape
capture (13).
Davies, in 1968, established sampling criteria which sought to minimize the errors caused by settling and
inertia. To minimize settling error it is recommended
that the air velocity at the inlet be at least 2 5 times
greater than the terminal settling velocity of the
particle or:
U> 25V (3)
where U is the air velocity at the inlet, and V is the
terminal settling velocity of the particle. This equation may also be expressed as a function of the sampling flow:
D< 2/5 (Q/nTg)°-^ (4)
where D is the diameter of the sampler inlet and Q is the
sample flowrate. If we assume standard temperature and
n
D< 4.1(Q°-Vd) (5)
where D is in centimeters , Q is flow in cc/sec and d is
the aerodynamic diameter in microns. Standard pressure
is 1 atmosphere, or 760 Torr. Standard temperature is
273° Kelvin.
If the conditions of this equation are fulfilled
then the error due to settling is negligible (13).
Davies also derived an equation which ensures negligible
error due to the inertial forces discussed above:
D> 0.062 qO-33 dO.67^ ^^ grpp ^gj
D is in cm, Q in cc/sec and d in um. Combining the last
two equations we have an upper and lower limit for the
diameter of the inlet which minimizes the sampling error in still air (13):
0.062* Q0-33*d°-^'^ < D < 4.1* Q°-^* 1/d (7)
If during still air sampling the inlet of the sampler is
oriented horizontally to the sampling axis the error due
to settling is negligible (13). Therefore, the right
side of equation 7 is ignored. All samples in this study
were taken horizontally. According to equation 7 the
maximum diameters of particulate that may be sampled
without inertial error in still air using 37 mm open
Marple and Liu give a simpler and far less
restrictive relation for the establishment of still air
conditions:
W < 0.002 (D^U/d^)°--^-^ (8)
where W is tbe wind velocity in cm/s, D is the probe
diameter in cm, U is the entry velocity in cm/s, d is the
aerodynamic particle diameter in cm. A restriction on
equation 8 is that d must be less than 0.003*D°•^*U°'°^.
It is noted that equation 8 seems to have a major flaw. If wind speed is equal to zero then D, U and d may have any value. The theoretical limits of this equation were
not included in the reference cited. It is recommended
that equation 8 not be used when W=0. Because of its simpler form this criterion is used in this paper.
Compliance with the above equation permits the assumption of about 90% inlet efficiency for a specified particle
size range (3).
The effect of low velocity winds on sampling dust in the industrial environment has been investigated by Ogden and Wood (19). These workers sampled benzene soluble
material in coke-oven emissions using Casella personal
samplers. The samplers were mounted on rotating arms to
produce a relative windspeed of 2.6 m/s. They concluded that the mass of dust collected depended on the windspeed
13. windspeeds the sampler was found to have collected all
particles up to 15um. Although the sampler was not a
cassette this example underscores the need to establish
still air conditions in order to minimize sampling error. Raynor (21) also found that windspeed markedly effected
the efficiency of sampling for filter holders.
In sampling for the evaluation of airborne dusts with cassettes parameters which receive primary
consideration usually include flowrate, sampling time and
the sensitivity of the analytical method used. Rarely,
if ever, is the aspiration efficiency of the cassettes considered by Industrial Hygienists (8).
As is discussed above, sampling errors are generally of two sorts: inertial and gravitational. Fairchild (8)
maintains that sampling errors , to some extent, depend on inlets being "thick or thin walled". Samplers are defined as thick walled if D/1 > 1.1 ; t/1 > .05. They are thin walled if D/1 < 1.1 ; t/1 < .05. Where D is the
inlet outside diameter, 1 is the inlet inside diameter
14.
FILTER
POSfTION
^^
=3^SJ-—i
I D«38.lmm
?=3l.8mm
0/^ = 1.2 a«3.2
mm37-mm OPEN-FACE
SAMPLER
Figure 1.3: Dimensions of a typical 37mm sampling cassette. The cassette is considered a thick walled sampler. Adapted from
Fairchild et al.
15.
Strictly speaking, thick walled inlets cannot
achieve a collection efficiency of 100% One possible
explanation for this is that particles have a tendency to
rebound from the wall of the inlet (8). Levin et al (8)
describe equations which predict the efficiency of thin
walled samplers in significant wind. Fairchild et al
(8) used these equations to predict the efficiency of
37-mm cassettes in still air. They maintain that with
proper adjustment the equations may be applied to 37-mm
cassettes and used as reasonable estimate of inlet efficiency.
Levin et al(8) describe the efficiency of the
sampler as the aspiration coefficient, A: A= c/Cq (9)
where c is the measured concentration and c^ is the true
concentration. If we consider the aspiration coefficient
as a product of several components each contributing to
the loss of aerosol at the inlet the above equation is
rewritten as:A = Aj^*A^*Ay. Where A is the aspiration
coefficient, Aj^ is the component of A due to aerodynamic
and inertial characteristics, A^ is the component of loss
due to wall deposition and Ay is the component of loss
due to particle rebound. A^ and Ay can only be estimated
by experiment. Therefore, the authors limited themselves
An empirical equation was developed which is based
upon Stokes' number (STK) and the inverse of the
isokinetic sampling parameter (U/Uq):
Ai= 1+ [(U/Uo)-l] B(STK,U/Uo) ^qj
where U/Uq is the inverse of the isokinetic sampling
parameter (U is the velocity of gas in the inlet; U^ is
the velocity of the gas in the airstream). The Stokes' number is defined as:
STK= V*UQ/l*g ^^'^'
where V is the terminal settling velocity of the
particle, U^ is the airstream velocity, g is the
acceleration due to gravity and 1 is the inlet diameter.
B(STK,U/Uo)= l-{l/[l+(2+0.62U/Uo)STK]) (12)
Substituting B into the aspiration equation we have:
h^= l+{ (U/Uq)-1)[l-{l/[l+(2+.62U/Uo)STK]}] (?).
The above equation, when strictly applied, estimates inlet efficiency for thin walled inlets in significant winds. However, Fairchild et al (8) applied another
version of the equation to the case of still air sampling with thick walled cassette samplers ( 37-mm cassettes ).
They assumed that the STK could be replaced by another
parameter, Ky K^ is the Stokes' number calculated by
17. free airstream velocity (8). As a result, the aspiration
equation reduces to:
A^= l-{0.62K^/[0.05Ky+(l+0.62K^)]} (14)
Fairchild et al (8) used these equations to predict the efficiency of 37-mm cassettes sampling in still air.
The cassette flowrate was 1.8 LPM. They showed that
open face cassettes oversampled for increasing particle size. The authors maintain that the oversampling is
not in gross violation of Davies' theory which predicts
negligible error (8). It may be possible that
significant rebounding of particulate into the inlet was occurring. This would be especially relavant using a
thick walled sampler.
The authors also noted that as the open face
cassette was moved away from directly facing the airstream in the wind tunnel the efficiency drops markedly. This is in good agreement with Durham and Lundgren (7). Additionally, isokinetic sampling theory
predicts this result (13).
4% to 59% of total mass collected for open face
cassettes.
The aerosol used ranged from 4 to 21um in size. There
was an increase in wall deposition as size increased.
Buchan et al (3) also studied the efficiency of 3 7mm cassettes. Using a wind tunnel, samples with both open
and closed face cassettes were taken while being compared to an isokinetic sampling probe upstream. The challenge
aerosol was composed of polydisperse aluminum spheres
ranging in size from 2.4 to 24um. They concluded that
sampling efficienies of all cassettes decreased with increasing particle size. In the case of the open face cassette the authors submit that impaction of large particles on the walls of the inlet explains the
decreased efficiency. Although this explanation is
plausible the authors did not support their position by
examining the atcual mass deposited on the walls of the inlet.
Beaulieu et al (1) also investigated the efficiency
of the 37mm cassette. They found that particle size
markedly effected the efficiency of the closed face
sampler. Sampling in calm air, industrial conditions, the authors compared the results of sampling with open
face cassettes to those obtained with closed face
19.
undersampled. It is proposed that large particles
possess too much inertia as they approach the inlet. Therefore, they miss the inlet. Although this
explanation is consistent with theories of isokinetic
sampling the authors make no attempt to verify it by
measuring the diameters of the particle which deposit in the cassette.
The authors (1) suggest the use of a 37-mm open face cassette for total dust sampling due to the biased
OBJECTIVES OF THE STUDY
The major objective of the study is to perform a
field test of the 37mm open-face cassette in sampling
ranitidine hydrochloride. This study should:
1. Provide confidence that samples taken
at low flows, such as full shift personal samples, are
comparable to high flow samples used in measurements of
ceiling limits. If they are not comparable a sampling
bias exists within this range of flowrates. The study
does not measure accuracy. However, if paired samples
run at very different flowrates are comparable it does
suggest that both are sampling well.
2. The study should provide Glaxo with
some environmental monitoring of ranitidine levels in
21
The analysis of environmental samples for the
detection of ranitidine has been described previously by
Glaxo method AMO119-03. This method outlines the use of
high performance liquid chromatography (HPLC) as the
method of choice.
The use of chromatographic methods in industrial
hygiene is widespread. The ability to resolve complex
mixtures into their respective components is invaluable.
However, it is believed that no separation is necessary
in the case of monitoring for ranitidine. Therefore, a
separate method of analysis is presented. It is based
upon ultraviolet absorption of radiation by the
ranitidine molecule. The furan ring system on the
ranitidine molecule presents an excellent chromophore.
In order to be consistant with Glaxo's standard
operating procedures the validation of this method
follows the company's outline for the verfication of
methods. This includes review of:1. Specificity of the method 2. Linearity of the method
3. Precision of the method 4. Limit of detection
5. Analytical recovery from filter
media
SPECIFICITY
If separation is not part of the method described
one must be certain that all interferences are well
characterized.It is well known that within the Zantac
suite three components are present, possibly as dusts.
These are magnesium Stearate, microcrystalline cellulose
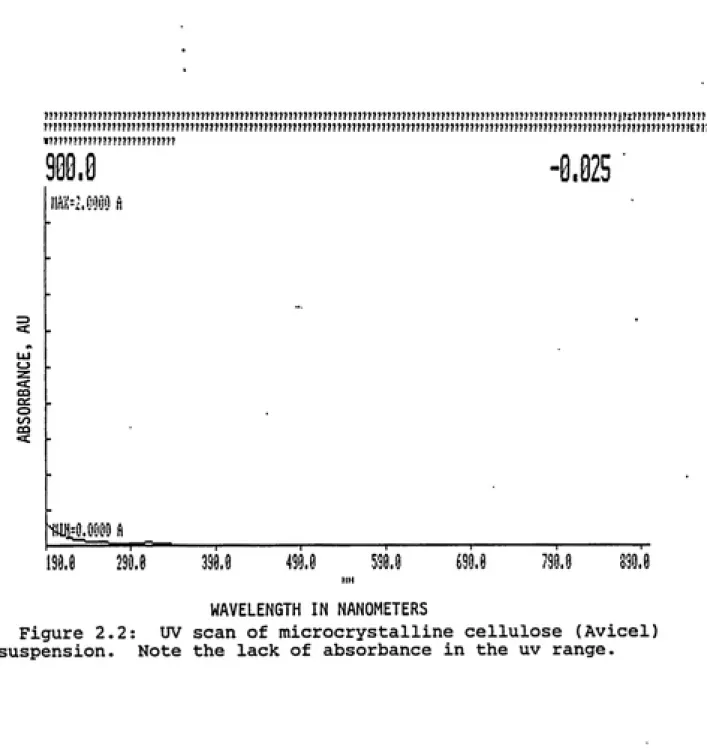
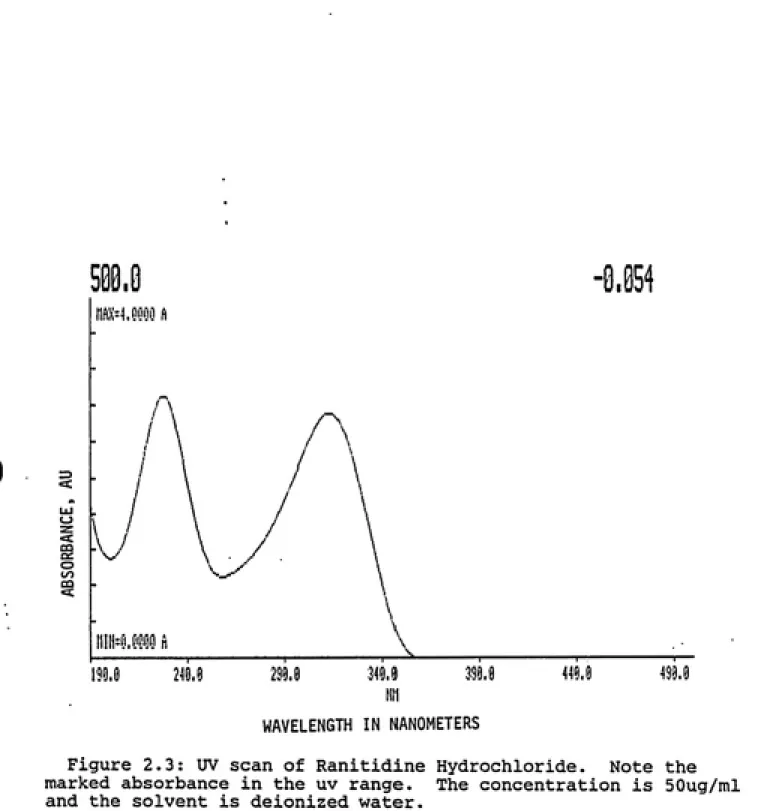
and ranitidine.Each compound was scanned in the ultraviolet region
for significant absorption. The spectra are presented in
Figures 2.1, 2.2 and 2.3. No absorption was found in the
uv range for either magnesium stearate or
microcrystalline cellulose. The concentration of the
solutions used were 50ug/ml. This level was chosen in
order to duplicate suspected levels in the suite,
although no quantitative justification is possible.
It is noted that the solubilty of these compounds
(magnesium stearate and cellulose) in water is very poor.
Therefore, it is important to filter the samples prior to
analysis. It is possible that undissolved materials in
the sample will scatter light and bias the analysis. This effect is commonly called turbidity. However,
turbidity was not anticipated as no absorbance was found
even without filtering the solutions.
In Figure 2.3 it is seen that ranitidine shows
marked aborbance in the uv region. This is due to the
ideal furan chromophore located on the molecule. In
Ur^ 2
23.
,e
<:
o
CO
A/;=^e^Oy ^
IlIH^O.OuiJO H
\m uu
-0.
3^0.0 339.5 4411. 499.5
WAVELENGTH IN NANOMETERS
Figure 2.1: UV scan of magnesium stearate suspension,
the lack of absorbaance in the uv range.
?????????????????????????????????????????????????????????????????????????????????????????????????????????????????????i?z???????'*????????? ?'???????????????????????????????????????????????????????????????????????????????????????????????'????????????????ͣ'???????????????*'?£????
W???'??????????????????????
98e.8
-B.
UJ
«a: CO
IX. o 00
<:
m^ri\m n
190.( 29if ms. im mA
WAVELENGTH IN NANOMETERS
Figure 2.2: UV scan of microcrystalline cellulose (Avicel)
Z3
CO Qi O
CO
H^y.OOOO H
r «, ^
25.
.0 -6.
isiil mi ile sSie 399.8 449.9 499.9
fill
WAVELENGTH IN NANOMETERS
alternative distilled water is used in the uv method.
Therefore, solvent effects must be investigated.
Generally speaking, if the pH of a solvent is
lowered the wavelength of maximum aborption for a given
chromophore may decrease (23) . An example of this is the common indicator phenol red. In basic solution the
absorption maximum is about 558nm. In acidic solution
(lower pH) the maximum is reduced to 4 3 3nm. These shifts are primarily caused by shifts in the position of
chemical equilibria in the absorbing species (23).
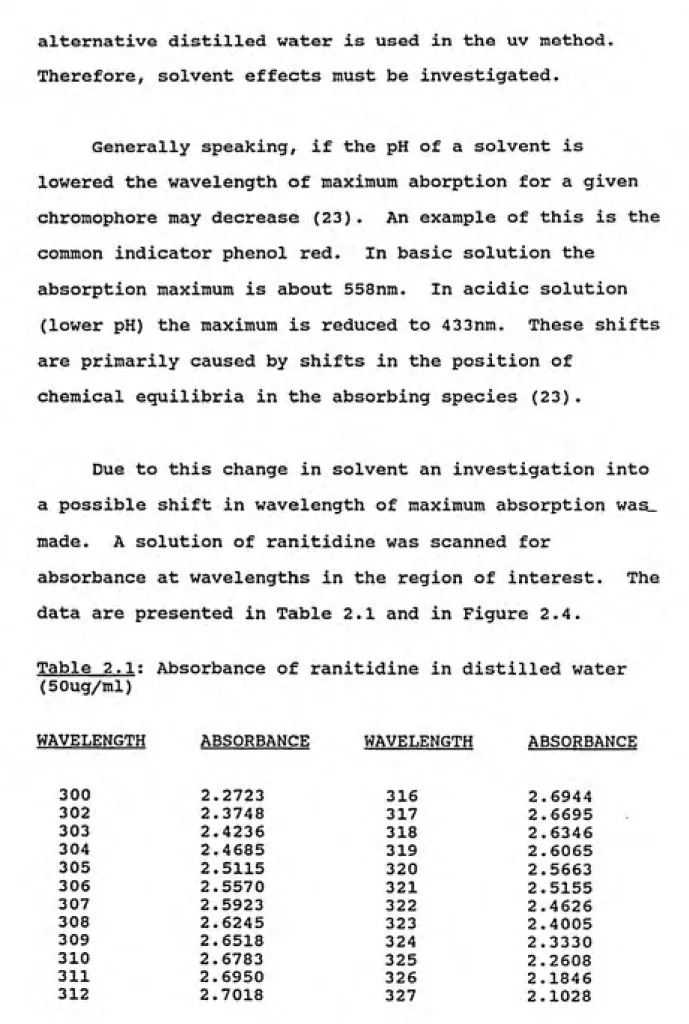
Due to this change in solvent an investigation into
a possible shift in wavelength of maximum absorption was... made. A solution of ranitidine was scanned for
absorbance at wavelengths in the region of interest. The
data are presented in Table 2.1 and in Figure 2.4.
Table 2.1: Absorbance of ranitidine in distilled water
(50ug/ml)
WAVELENGTH ABSORBANCE WAVELENGTH ABSORBANCE
300 2.2723 316 2.6944
302 2.3748 317 2.6695
303 2.4236 318 2.6346
304 2.4685 319 2.6065
305 2.5115 320 2.5663
306 2.5570 321 2.5155
307 2.5923 322 2.4626
308 2.6245 323 2.4005
309 2.6518 324 2.3330
310 2.6783 325 2.2608
311 2.6950 326 2.1846
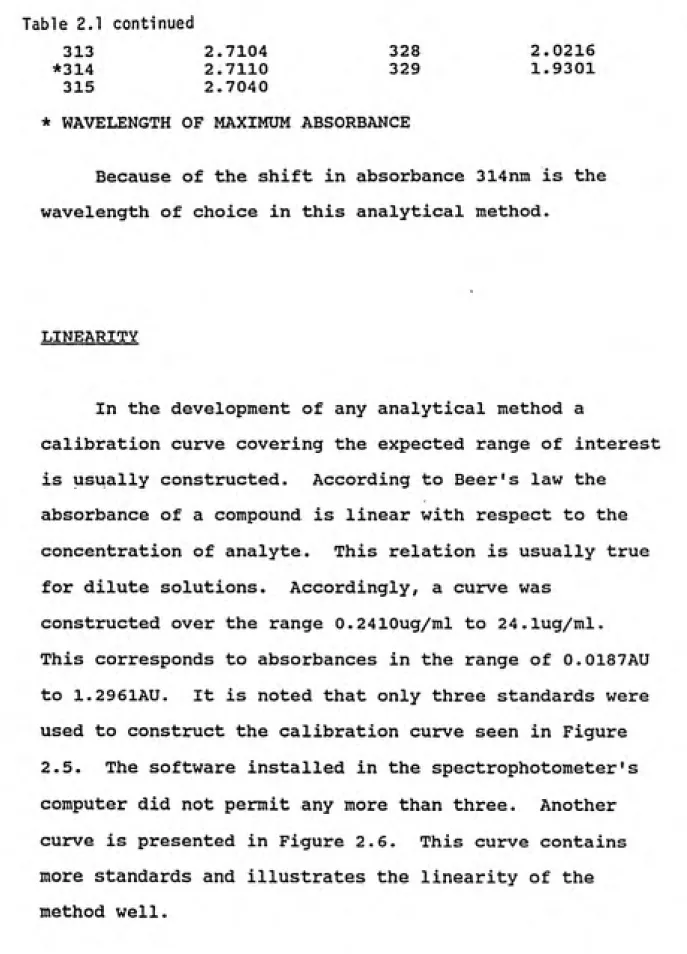
Table 2.1 continued 27.
313 2.7104
*314 2.7110
315 2.7040
328 2.0216 329 1.9301 * WAVELENGTH OF MAXIMUM ABSORBANCE
Because of the shift in absorbance 314nin is the
wavelength of choice in this analytical method.
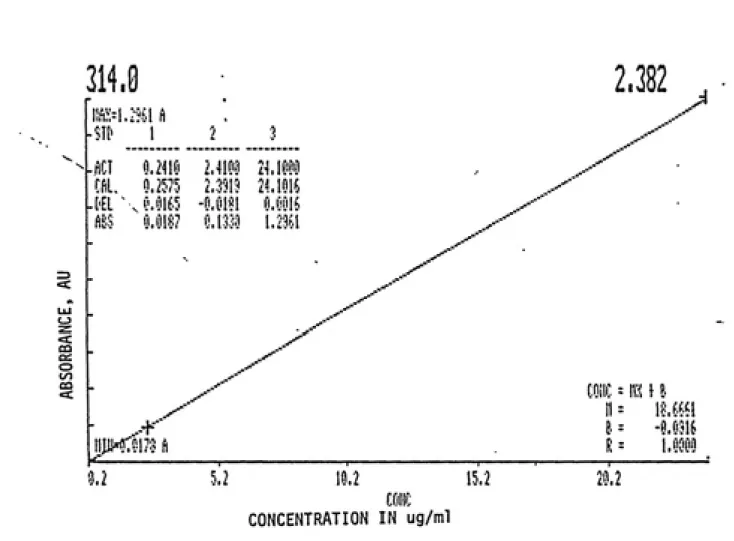
LINEARITY
In the development of any analytical method a
calibration curve covering the expected range of interest is usually constructed. According to Beer's law the
absorbance of a compound is linear with respect to the
concentration of analyte. This relation is usually true for dilute solutions. Accordingly, a curve was
constructed over the range 0.2410ug/ml to 24.lug/ml.
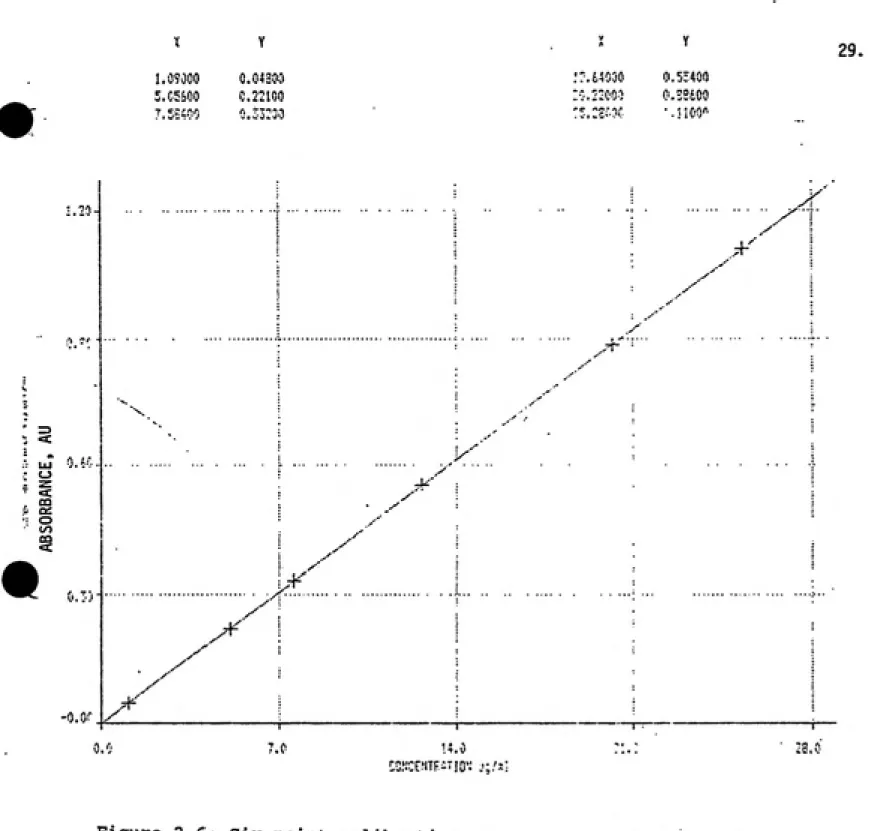
This corresponds to absorbances in the range of 0.0187AU to 1.2961AU. It is noted that only three standards were used to construct the calibration curve seen in Figure 2.5. The software installed in the spectrophotometer's computer did not permit any more than three. Another curve is presented in Figure 2.6. This curve contains more standards and illustrates the linearity of the
m
^^q1%L
IM
CO o 00 CO2.382
• .v'"^1 i ͣ}
...-"""
0.2110 im 2^1000
./
CftL, 0.2??5 2,3319 2^1016 ..^'' -[•EL . 0.0165 -0.01«1 fi.l'HJh
___,-ͣ'
ftsS 0.018? 0,13i0 1.23^1 .,-*
---"" ͣ -. - --.^--' ,^' ..-' .^ -.^' .--ͣͣ
11 = JH.b^^i
-.--K"
6= -0,031&
\\]M,01?5fi
R = 1,0000
0.2 C 1
•J.i 10.2 15.2
20.2
CONCENTRATION IN ug/ml
Figure 2.5: Three point calibration curve generated on Glaxo's
Perkin-Elmer double-beam spectrophotometer which illustrates
expected linear relationship between absorbance and
29.
•
Z3
CO Cd O t/1 CO
^'
"piK-r-Mjr^T jnv
Figure 2.6: Six point calibration curve generated with raw
absorbance data further illustrates linear relationship between
absorbance and concentration.
The justification for using 0.2419 and 24.lug/ml as
a standard range follows from the instrument
specifications (Appendix I ). The stated photometric
accuracy is about +/- 0.005AU with l.OOAU as a maximum
scale value. Therefore, a repeatable value, in ug/ml^
was sought that gave an absorbance reading three times as
large as the reported accuracy. An absorbance of 0.0187AU
was obtained for a solution of 0.2419 ug/ml. 24.lug/ml
was chosen as the upper range limit because it
corresponded to an absorbance reading of about 1.00
(1.296). This ensured that the information on
photometric accuracy would apply to work completed with
the calibration curve. Using a reading three times the
photometric accuracy ensures that the limit of detection
is not violated.
LIMIT OF DETECTION
The limit of detection can be defined as the
concentration of analyte which gives a detector response
two times as great as the noise (23) . The measured noise
at 314 nm was 0.0008AU. Twice this value is 0.0016AU,
corresponding to a solution concentration of 0.024ug/ml.
This is taken as the limit of detection. Given that
filters are desorbed in 10ml of water after being
collected in cassettes the limit of detection is
approximately 0.2ug per filter (HPLC limit of detection
31
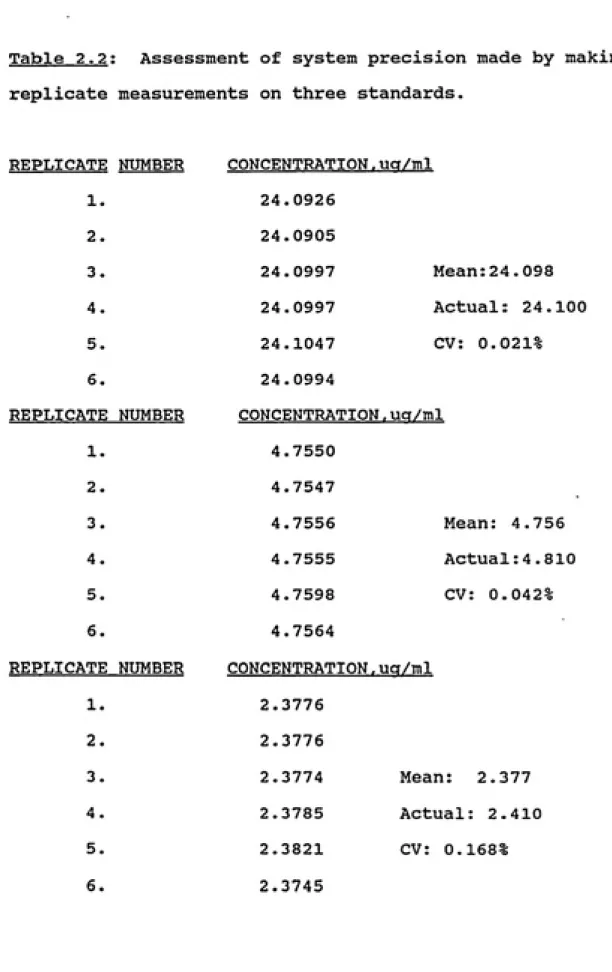
SYSTEM PRECISION
A series of six replicate measurements were taken
for each of three standard concentrations. The data and
Table 2.2; Assessment of system precision made by making
replicate measurements on three standards.
REPLICATE NUMBER 1. 2. 3. 4. 5. 6. REPLICATE NUMBER 1. 2. 3. 4. 5. 6. REPLICATE NUMBER 1. 2. 3. 4. 5. 6. CONCENTRATION.uq/ml 24.0926 24.0905 24.0997 24.0997 24.1047 24.0994 CONCENTRATION.ua/ml 4.7550 4.7547 4.7556 4.7555 4.7598 4.7564 CONCENTRATION.uq/ml 2.3776 Mean:24.098 Actual: 24.100 CV: 0.021% Mean: 4.756 Actual:4.810 CV: 0,042% 2.3776 2.3774 2.3785 2.3821 2.3745
33. In order to be acceptable, the coefficient of
variation for each set of readings must not exceed 3.0%. These data are well within this Glaxo method guideline.
ANALYTICAL RECOVERY
In order to evaluate the recovery of active (ranitidine) from filter media a study was conducted in accordance
with the guidelines suggested by NIOSH (18). These
guidelines suggest that three levels of analyte be spiked
onto media. The levels should cover the entire range of analyte that is likely to be found in sampling.
Specifically, six filters are to be spiked at each of the levels. The recovery of ranitidine must be greater than
90%. The pooled coefficient of variation cannot exceed
0.07.
The three levels chosen were: 5, 50, and 500ug per
filter. If we assume an 8 hour sample is taken at 2.0
liters per minute 0.96 cubic meter of air is sampled. This corresponds to levels in the suite of 5.2, 52, and
520 ug per cubic meter. This should cover the expected range of air levels of ranitidine in the suite. This
assumption is based on data previously collected in the
suite.
A stock solution of ranitidine was prepared and
placed in a 125ml flask. Using a volumetric pipette 10ml
of distilled water is added to the beaker. A cap is
placed on the beaker's top. The beaker is shaken
vigorously for one minute. The filter is then left to
desorb for fifteen minutes. After fifteen minutes the
solution is once again shaken for one minute. Then 2-3ml
is transferred to a quartz cell that provides a 1cm
pathlength. Another l-cm quartz cell is filled with
deionized water. This cell is placed in the reference
cell holder. The concentration of the solution is read
from the calibration curve stored in the computer, or
from a graph created by the analyst. Because the
Ranitidine is first desorbed in 10ml of solvent the
resulting concentration is multiplied by 10 in order to
obtain the micrograms of active on the filter.
In the analysis of environmental samples two
procedural changes are noted. Because magnesium stearate
and microcrystalline cellulose are present, and are
insoluble, filter samples should be filtered prior to
analysis. This is done by using a 0.45um Acrodisc filter
attached to a disposable syringe. It is imperative that
the filter and syringe not be reused. Additionally, the
wall of the cassette holder must be rinsed in order to
35.
used. Generally, this rinse can be done over a 50ml
beaker to avoid losses.
The cassette rinse is treated as a separate sample. This is necessary as removing Ranitidine from the
cassette is probably a good deal less quantitative than
desorbing a filter. The error in extracting ranitidine
from the wall may be significant. If included with the
filter extract it may bias the entire sample. Treating
them separately allows one to be confident that at least
the filter extraction result is accurate.
Table 2.3 illustates the recovery obtained in the
spiking of glass fiber filters.
Table 2.3 : Analytical recovery obtained by spiking known
masses of active onto filters.
_ AMOUNT SPIKED AMOUNT RECOVERED 5.2 5.1
5.2 5.1 5.2 5.2 5.2 5.0 5.2 5.3 5.2 5.1
AMOUNT SPIKED AMOUNT RECOVERED
49.8ug 50.6
49.8 51.4
49.8 50.0
49.8 49.7
49.8 50.8
49.8 50.4
Mean recovery: 101.3% CV: 0.0109%
AMOUNT SPIKED AMOUNT RECOVERED
498ug 502
498 484
498 499
498 479
498 475
498 479
Mean recovery: 97.6% CV: 0.0209%
The pooled coefficient of variation for all three
levels is 0.0175%. Bartlett's test of homogeneity was
applied to test the hypothesis that no difference between
37.
Currently environmental samples are analyzed using HPLC
(method AMOl1-03:Appendix III). Because of this, analytical
recovery is reported for this method as well as for the UV
method. Glass fiber filters are spiked in a similar manner
as that described above. The results are illustrated in
Table 2.4.
TABLE 2.4 : Analytical recovery from glass fiber filters
using HPLC.
AMOUNT SPIKED AMOUNT RECOVERED
1.01 l.Olug
1.01 1.14
1.01 1.02
1.01 1.05
1.01 0.99
1.01 0.99
Mean recovery: 102.3% CV: 0.052%
AMOUNT SPIKED AMOUNT RECOVERED
60.27ug 62.86
60.27 64.20
60.27 63 . 67
60.27 63.67
60.27 64.06
60.27 sample void Mean recovery: 104.6% CV: 0.0072%
AMOUNT SPIKED AMOUNT RECOVERED
SOO.OOug 504.32
500.00 506.75 500.00 498.18 500.00 492.89 500.00 519.92 500.00 520.21
Table 2.4 cont'd
AMOUNT SPIKED 1000.OOug 1000.00 1000.00 1000.00 1000.00 1000.00
AMOUNT RECOVERED 1005.40
1018.10 1009.59 1019.99 1017.14 1008.66
Mean recovery: 101.3% CV: 0.054%
The hplc recovery results are very good (> 90%)
However, Bartlett's test of homogeneity shows a significant
difference in the coefficients of variation. In the test
only three levels of spiking were considered. Two tests were
run first with the 500ug level then with the lOOOug level.
This may be due to the low range over which the method was
calibrated by Glaxo. Recalibration was not done because as
Currently, the internal occupational exposure limit
for ranitidine hydrochloride is 50ug/M-^. The 15 minute
ceiling limit is also 50ug/M"^. Flows for personal
sampling for total dust are typically about 2 LPM.
Given the expected low levels of ranitidine in the suite
air and the analytical detection limit of lug/filter
(HPLC), a 15 minute sample taken at 2 LPM may not collect
enough active on the filter to be detected. This necessitates taking ceiling measurements at high
flowrates. The Alpha-one pumps used by Glaxo can to
sample for 15 minutes at 4 LPM. However, it is necessary
to ensure that samples taken at low flows are comparable,
or are not biased. If a large difference is observed
then the sampling technique as a whole must be
questioned.
In order for a sampling method to be unbiased it
should sample accurately both the true particle size
distribution and concentration of the aerosol of interest
(4). As was discussed earlier in this paper many
sampling methods are validated in wind tunnels. This
allows the isokinetic sampling of an aerosol. Because in
the industrial environment free stream airflow patterns
cannot be readily characterized certainty with respect to
isokinetic sampling is not possible.
However, in some cases the wind speeds present are
40.
interfering with the sampling of a particular aerosol.
In this case one assumes that still air is being sampled.
The wind speed which allows one to make this assumption
is based upon particle size, probe diameter and sampling
flowrate. Marple and Liu give the simple relation:
W< 0.002(D2u/d'^)°-^^ (8)
Where W is the maximum allowable windspeed that may be
present along with probe diameter, D (cm), inlet
velocity, U (cm/s) and aerodynamic particle size, (cm),
for still air conditions to be assumed. If this
condition is met the sampler should sample particles
within the given size range with at least 90% efficiency
(3).
The use of the 37mm cassette for sampling total dust
in industrial conditions is well established (1). It is
not the intention of this paper to revalidate this
method. However, what is important is how one uses this
method.
Air velocity measurements in the Fette room and
dispensing areas (including the dispensing booth) were
made with a TSI hot wire anemometer (VelociCalc;model
8350). The anemometer was calibrated at the factory.
The air speed was about 15-20 feet per minute (7.6-10.2
cm/s) in both regions of the suite. If one considers an
flowrate) and a particle size range of up to 50 um a
maximum air speed of 7.67 cm/s may be present in order to
assume still air conditions (from above equation).
Particles smaller than 50um would allow higher airspeeds
to be present. For example, a lOum particle present may
be sampled using the still air assumption with a
windspeed up to 71 cm/sec (140 FPM)
Sampling at 4 LPM the maximum allowable airspeed is
10.50 cm/s (for a 50um particle) 4 LPM is considered
because it is highest flowrate that Glaxo's sampling
pumps (alpha 1) can continuously draw over an extended
sampling period. Marple and Liu (1) predict that because
still air conditions are met both flowrates should
sample the aerosol with excellent efficiency.
Earlier in this paper an equation is described that
is used by Fairchild to estimate the inlet efficiency of
the 37-mm cassette sampling in still air. Given that
still air conditions have been established in the Fette
and dispensing areas estimates of the sampling efficieny
of the cassette sampling at 2 and 4 LPM are calcuated.
Table 3.1 presents the estimates.
Table 3.1 : Calculated estimates of the inlet efficiency
of an open face 37-mm cassette sampling at 2 and 4 LPM in
still air.Flowrate: 2 LPM Flowrate: 4 LPM
42,
Table 3.1 cont'd
0.5 99.9% 0.5 99.9% 1.0 99.9% 1.0 99.9%
5.0 99.9% 5.0 99.9%
10.0 99.9% 10.0 99.9% 30.0 99.7% 30.0 99.6%
Where Aj^ is the aspiration efficiency of the inlet
calculated using empirical eguations of Levin et al (8).
The eguation describes only inertial forces.
Gravitational settling is not considered. The estimates
indicate that over the flowrate range of 2 to 4 LPM
sampling efficiency should be very good up to 3 0um.
Moreover, the efficiency of both
2 and 4 LPM samplers is about the same. Thus, there
should be no bias in the sampling method within this
range of flowrates.
Stan Roach (20) suggests an easy method of testing
this hypothesis that the method is not biased over a
given flowrate range. It involves drawing paired samples
in the workplace. One sample is run at twice the
flowrate of the other. If no bias exists in the method
then, on average, there should exist no significant
difference in the concentrations calculated.
Additionally, the particle sizes sampled should, on
average, be identical.
Paired samples (area samples) were collected in
the Fette room by using Alpha-one personal sampling pumps
Buck Calibrator. This device is reported as being a
primary standard. It operates using a soap bubble tube.
The bubble is sensed by an infrared beam detector. This
allows for very fast readings to be taken. During the
calibration five readings are taken for each pump at a
chosen flowrate. In order for a flowrate to be
acceptable individual readings must not vary more than
+/- 5% of each other. The pumps were calibrated before
and immediately after use. If the before and after
calibration varied by more than 5% the data were not
accepted. Samples were taken for 4 to 5 hours. The
flowrates used were 2 and 4LPM. They were chosen because
they represent the most likely range of flowrates to be
used in the future by Glaxo. .
37-mm plastic cassettes (Gelman Sciences) were taped
together and each was attached to its own pump. One
sample is taken at 2 LPM and the other at 4 LPM. It is
assumed that pairing the samples in this manner does not
influence the sample results (12). Taping the samples
together ensures that both samplers are sampling similar
air. In order to minimize the effects of settling
cassettes were oriented horizontally with respect to the
sampling axis (13). In the Fette room samples were taken
on a table approximately 10 feet from the Fette machine.
The table is about 3.5 feet in height. All samples are
44.
In the dispensing area one half of the sample pairs
are taken from inside a laminar flow booth which
surrounds the dispensing process (air velocity
measurement shows windspeeds of 20 feet per minute). The
sampling pumps were taped to the wall of the booth in an
effort to avoid interfering with the dispensing of
ranitidine. The other half are taken from outside the
booth on a table about 10 feet from the dispensing
operation. Eleven pairs of cassette samples were taken
for the Fette room and ten pairs were taken in the
dispensing area. Two samples from the dispensing area
were discarded because of pump failure. All samples were
analyzed using the uv-spec method previously described.
Both the cassette wall and the filter were assayed for
the presence of ranitidine.
If indeed no significant difference exists between
sampling at 2 LPM and at 4 LPM then one might expect that
the sizes of particulate being collected on the filter
are also identical. The air samples taken for particle
size anlysis were taken in the Fette room. This was done
in order to limit the cost of the study. Samples were
collected on 37mm nucleopore filters at flowrates of 2
and 4 LPM. Samples were not taped together because the
objective was not to attempt to perform another pairing
experiment. Rather, the experiment was designed to
collected by the cassette at 2 and 4 LPM in the Fette
area.
Five samples at each flowrate were collected in the Fette
area. Two SEM stubs were prepared from each filter.
STATISTICAL ANALYSIS
Environmental sampling data are frequently observed
to follow the lognormal distribution (16). As a result,
statistical analysis which uses the normal distribution
is applied to the logarithmically transformed data rather
than the raw data itself. In this study it is assumed
that the concentration data generated in the bias
experiment follow the lognormal distribution. This
assumption is tested by employing the Kolmogorov-Smirnov
test. This test evaluates given sampling data for its
fit to a specified distribution. In this case the logs
of the data were tested for fit to the normal distribution.
A two-way fixed factor analysis of variance (ANOVA)
was
completed to investigate possible interactions between
flow and location of samples. If an interaction is found
a bias exists in the pairing method itself. Therefore paired t-tests must be done for each area sampled. The
46.
After the distribution was tested and the ANOVA
completed a paired t-test was run (95% confidence level). The null hypothesis was that no significant difference
exists between the logs of concentrations observed at 2
LPM and at 4 LPM in each pair of samples. Paired t-tests were also run on concentrations considering filter mass alone. This was done in order to elucidate differences of active collecting on the filters rather than considering the overall mass found (wall included). The confidence
47.
Within the Zantac suite it is suspected that three air contaminants are present: ranitidine, magnesium stearate (MgSt) and microcrystalline cellulose (MCC). The two latter components are used as tablet lubricant and binder, respectively. Because each is dispensed in a similar fashion, as a powder, the contaminants are
probably dusts.
In order to objectively evaluate the cassette sampling efficiency a particle size characterization of both bulk
active and airborne materials is in order.
A method of sizing airborne particles of active must be able to distinguish between the active, MgSt and MCC. A method which is used commonly as a reference in sizing
is electron microscopy. The method employed in this study is Scanning Electron Microscopy (SEM). SEM was used because of its ability to perform elemental analysis and for its superior resolution. It is noted that the use of SEM can be costly. However, given that a detailed particle size analysis has not been completed for
ranitidine the possibility exists that some particles present in the suite air may be below the limit of
resolution on a light microscope. Moreover, even if
ranitidine could be readily distinguished morphologically
Therefore, basing analysis on morphololgy could lead to
significant error.
The method used to size Ranitidine particles is
based on x-ray microanalysis. As electrons are focused
onto the sample electrons on the sample surface are
raised to an excited , or elevated energy state. When
the electron leaves its lower energy orbit for a higher
state a vacancy is created. Because atoms are more
stable in the ground state an electron in higher energy
orbital drops down to fill this new vacancy, thus
returning the atom to the ground state. The difference
in energy between the higher orbital position and the new
lower position is released in the form of x-rays (15).
Because each element has a unique electronic
structure the x-ray energy produced upon bombardment with
electrons is characteristic to that element. In this
manner it is possible to examine particles of suspected
ranitidine and identify them by identfying their characteristic x-rays.
Samples of bulk ranitidine were prepared by lightly
dipping a small camel's hair brush into some ranitidine
49.
glove-bag filled with nitrogen. This was done to prevent
contamination with ambient dust.
Then, using a Denton vacuum evaporation unit, a
coating of carbon was applied to the sample. The sample
was then analyzed with the x-ray microanalyzer. Recall
that ranitidine contains sulfur and chlorine. These two
atoms emit characteristic x-rays between 1.28 and 3.84
kiloelectron volts (KeV). An x-ray scan of a ranitidine
particle is represented in Figure 4.1. The x-axis
represents the energy of x-rays detected. The y-axis represents the number of counts per second detected. It
is noted that the y-axis lacks units. Most frequently
elemental analysis is completed for qualitative purposes
only. Therefore, ordinate units are not as important as
knowing which characteristic energy is being observed.
In Figure 4.1 it can be seen that both sulfur and
chlorine can be readily detected. Carbon is used here as
the coating in order to avoid the possible interferences
that metal coatings may produce. The x-ray output of
carbon is too low to elicit a response from the detector.
However, carbon is a poor conductor of electrons.
Therefore, as the electron beam strikes the surface,
electrons tend to build- up, heating the sample.
Destruction of the sample may occur quickly. It is,
•c
a u A N! T' i;;: X — I;; a y co i-^ a i--- i-i :i: c; j;;
\-< A M :i: T" :i:,i:i :i: m W:: \ \ r; t... v/. i.j i... k
!"• i'< ͣͣ" ' 5;; ;i. c> 0 <;juj r:;^ ::^ ';> ͣ;>«;; :i: m t-v^ :::r ^ <> <p- ^> i--i :=: :->. o K 1?^: <>^ :i s M. ci A CJ =" ::;> 0 K K i^' :i. r.i
50.
•[
o C_5
ENERGY, IN KILOELECTRON VOLTS
:i. . i^> 5;j K lii: v^ X Hi: ii; 3 m a \< i\v. <j :ͣͣͣͣ
Figure 4.1: X-ray spectrum of Ranitidine Hydrochloride
#
•
ci ij A N T' V:i: X - !"<; .^ Y Cv r< A I"-1 -I ;i: c: m
uj :r; wi: n; i;;: \"< :\. -^.y. ͣͣͣͣ ;i. :i. -- in y x:i a y
I-:-1-^ ͣͣͣͣ-ͣͣ - J5J :i. 3 ;^ j;j w <> :i: n v KJ :== 'v; 1.:;;: i-i === -:?. <;ͣ k 1;=: ^ :i. ; ;!. c;:; a cj === ::>. 0 k i;;: k^ :i. cm
i-;:(<^M .1: T- ;r. 1:1.1: mi--: i-ic:i_ e<lj 1...i-<
A lij
o C_3
i:5 X
CI.-(^IJ
^7 'U
ENERGY, IN KILOELECTRON VOLTS
0 . o o i< 1;;: vj X \y.: i\i :::> o . n (=) k ih: k^ >
Figure 4,2: X-ray spectrum of ranitidine hydrochloride with gold coating.
Chlorine is resolved, and hence, may be used as the marker in sizing. Note
conducting, volatile metal. Examples of such metals are
gold and palladium. By identifying Ranitidine in this
manner one can distinguish active particle from others
such as magnesium stearate and Microcrystalline
Cellulose.
To size the particles a Au/Pd alloy was then vacuum
evaporated onto the sample of bulk active. It was
observed that gold and palladium overlap in their spectra
with sulfur and chlorine. Because of this interference
using the gold-palladium alloy coating was not possible.
The problem was solved by coating the sample with
only gold. As seen in Figure 4.2 gold masks the sulfur
peak. However, the chlorine peak is clearly resolved.
Thus, we may identify ranitidine particles among other
contaminants (which do not contain chlorine) using a gold
coating.
Although the above method is useful, it is time
consuming. This problem is abated by interfacing an
audio jack with the x-ray detector. Consequently, when a
scan "hits" a ranitidine particle very many clicks, or
counts, can be heard. This is accomplished by placing a
window on the chlorine peak energy. The computer
automatically tries to match the scanned particle's
53.
chlorine then the operator will hear the counts. Alternatively, the analyst can view the spectrum and ascertain the presence of ranitidine. This method of
analysis is still a bit tedious. However, it does permit
the analyst to have reasonable certainty that most of the particles on the image are rRanitidine containing.
Particles of bulk ranitidine were sized using the above method of preparation. After being coated with
gold the samples were placed into the SEM's specimen chamber. This chamber is always kept under vacuum. The vacuum is necessary to prevent electron interaction with
air molecules. The magnitude of the vacuum is about 10"^
Torr. An image was created on the screen by scanning the
specimen. A detailed treatment of scanning electron
microscopy is beyond the scope of this paper. However,
some important parameters are discussed below.
THE WORKING DISTANCE
The working distance used was in the range of
15-25mm. The working distance is the distance from the
final lens to the surface of the specimen. This
parameter is proportional to the depth of focus.
proportional to the depth of focus, short working distances give the best resolution (15).
MAGNIFICATION
The magnifications used were about 100, 2 00, 400,
1180 and 3500X. These magnifications allowed the analyst to cover a rather wide range of sizes, from particles >
2 0um to those smaller than the pores of the filter. It
is admitted, however, that the actual choice of
magnification is arbitrary. The resolution in SEM is generally equal to the electron beam diameter. For many insruments this is about five nanometers. This
55.
ACCELERATING VOLTAGE
The accelerating voltage used is about 2 0 KeV. This
plays a crucial role in image production. Most SEMs can produce accelerating voltages of up to 30KeV. High
accelerating voltages result in good resolution and deep penetration of the specimen. The accelerating voltage applied in this study is fairly high. This is done in order to penetrate the surface of the specimen deeply.
Deep pentration enhances x-ray production. This aids in
elemental analysis of Ranitidine particles. It is noted, however, that high accelerating voltages can induce
excess charge build-up on the specimen. This can damage
the sample quite readily (15). A photomicrograph of
Ranitidine is presented in Figure 4.4. This particle was
captured on a 25mm nucleopore filter (.2 um pore size) held in place by a 25mm plastic cassette. The flowrate was 4 liters per minute. Sampling time was about 3-4
hours.
After images of bulk Ranitidine were created they were stored in the SEM's computer in the form of a digital image. In this manner the image may be
interfaced with a sizing instrument.
operates by sizing particles (Feret's X-diameter) seen in
the digital image stored on hard-disk. The operator
produces a digital image on a television monitor. By
using a magnetic screen interfaced with the Video-Plan TV
screen the operator outlines the perimeter of particles
to be sized with a magnetic pen/tracer. In order to size
the particles one must enter an appropriate magnification
factor into the Video-Plan. This is obtained from themagnification used to produce the digital image on the
SEM.
The number of particles sized was 187. An attempt
was made to size as many particles as was reasonable.
The data were then reduced into intervals and plotted on
a log-probability graph. A straight line is then drawn
to connect the data points. If the data are lognormally
distributed most of the points will fall on the line.
VALIDATION OF THE SEM METHOD
As is discussed above the samples are subjected to a
very high vacuum in the sample chamber of the SEM. This
vacuum is about 10"^ Torr. An effort was made to ensure
that these extream conditions did not alter the integrity
of the examined material. This was done by sizing the
bulk material using light microscopy. A dry mounted
slide of bulk Ranitidine was prepared in the same manner
58. haemocytometer. The Zeiss microscope was set at 2 00X.
The haemocytometer enabled the analyst to avoid sizing
particles more than one time. A total of 178 particles were sized. The results of the two methods of sizing are
then compared. If no difference exists then it may be assumed that the distribution of sizes is not being changed by the vacuum of the SEM, or for that matter by
the vacuum of the evaporation unit.
AIR SAMPLES FOR PARTICLE SIZE ANALYSIS
Air samples taken for particle size analysis were taken on 37mm nucleopore filters (pore size 0.2 um).
After collection a small piece of filter was cut from the
middle region of the filter and mounted on the SEM stub
with double-sticky tape. The samples were then coated with gold and examined using the above method. Because the method of identifying particles of Ranitidine in the presence of other dusts is so tedious and quite costly only 117 particles were measured at 2 LPM and 151 were measured at 4 LPM. The results of the sizing are
The concentrations obtained from pairing in the Fette room are presented in Table 5.1. Results are
expressed m micrograms per cubic meter (ug/M ). Table
5.2 presents the data collected in the dispensing area. Some samples are from inside the laminar flow booth. Tables 5.3 and 5.4 present the data broken down into
mass of ranitidine found on filters and on the inside
wall of the cassette. Additionally, the tables highlight the contribution made by the wall mass found to the total
mass collected by the cassette and filter. Table 5.5
presents the air concentrations calculated by considering
only the masses of ranitidine found on the filters.
TEST OF LOGNORMAL ASSUMPTION
The concentration data from both dispensing and Fette areas was log-transformed in a Systat file. The
data were then standardized. The values were then
compared to the standard normal distribution using the
Kolmogorov-Smirnov (KS) one sample test. The results are
presented below.
Variable Number P-value
(high flow) 4 1pm 19 0.440
(low flow) 2 1pm 19 0.690
60.
Table 5.1: Results from pairing in the Fette area during second shift (FS). Samples are taken on a table
about 10 feet from the Fette machine.
Pair Location Flowrate
Concentration, ug/M^^
1 FS 2
4
1pm 1pm
14.840 20.670
2 FS 2
4
1pm 1pm
17.170
15.580
3 FS 2
4
1pm 1pm
16.750 23.534
4 FS 2
4 1pm 1pm
44.272 60.979
5 FS 2
4
1pm 1pm
64.200 84.313
6 FS 2
4
1pm 1pm
102.750 95.224
7 FS 2
4
1pm 1pm
182.720 127.010
8 FS 2
4 1pm 1pm
30.287 16.281
9 FS 2
4
1pm 1pm
20.343 29.755
10 FS 2
4
1pm 1pm
28.495 63.971
11 FS 2
4 1pm 1pm
Table 5.2: Results from pairing in the dispensing area
during first shift. DB= samples taken from inside laminar
flow booth in dispensing area;DT= samples taken from
table about 5-7 feet outside the laminar flow booth.
Pair Location Flowrate Concentration,ug/M
12 DB 2
4
1pm 1pm
33.50 6.72
13 DB 2
4 1pm 1pm
25.99 16.55
14 DB 2
4
1pm 1pm
35.47 22.57
15 DT 2
4
1pm 1pm
61.77 50.73
16 DT 2
4
1pm 1pm
37.73
29.29
17 DT 2
4 1pm 1pm
67.62 71.72
18 DT 2
4
1pm 1pm
85.60 48.79
19 DT 2
4
1pm 1pm
62.
Table 5.3: Masses of Ranitidine found on filters and on
inside cassette wall. All were collected in the Fette area on a table about 10 feet from the Fette machine.
Pair Flowrate Filter Cassette % of total from
Table 5.4: Masses of Ranitidine found on filters and on inside cassette wall. All were collected in the
dispensing area. Pairs 12-14 are from inside the laminar
flow booth. Pairs 15-19 were taken on a table about 5-7
feet outside the booth.
Pair Flowrate Filter Cassette % of total from
64.
Table 5.5: Concentrations obtained when considering only
mass of active found on the filters.
Pair Location Flowrate Concentration
1 FS 2
4 1pm 1pm
13.16ug/M2
19.85
2 FS 2
4
1pm 1pm
6.03
8.81
3 FS 2
4
1pm 1pm
6.89 12.11
4 FS 2
4 1pm 1pm
25.85 49.55
5 FS 2
4
1pm 1pm
33.62
76.16
6 FS 2
4
1pm 1pm
74.89
81.43
7 FS 2
4 1pm 1pm
97.55 74.69
8 FS 2
4 1pm 1pm
8.29 10.18
9 FS 2
4 1pm 1pm
5.61 12.46
10 FS 2
4
1pm 1pm
9.45 22.62
11 FS 2 1pm
4 1pm
Table 5.5 continued
Pair Location Flowrate Concentration,ug/M"
12 DB 2
4
1pm 1pm
21.86 2.23
13 DB 2
4
1pm 1pm
17.32
10.34
14 DB 2
4
1pm 1pm
26.62
5.36
15 DT 2
4 1pm 1pm
23.43 21.46
16 DT 2
4
1pm 1pm
14.86 30.48
17 DT 2
4 1pm 1pm
36.35 40.63
18 DT 2
4
1pm 1pm
32.61 26.42
19 DT 2 1pm 42.04
66.
indicates a significant difference between the samples
and the null hypothesis that the data follow the
lognormal distribution. Probability plots of the
transformed data are contained in Appendix III.
ANALYSIS OF VARIANCE
The analysis of variance showed no interaction between flows and location. However, a nearly
significant difference was found when considering
concentrations calculated with only the mass of
ranitidine on the filter. The P-value in this case was
0.06. A value less than 0.05 is considered significant.
Therefore, the mass of ranitidine deposited on the wall
of the cassette should be considered in the calculation
of concentration.
PAIRED T-TESTS ON CONCENTRATION DATA (WALL AND FILTER)
The pairs of samples taken in the Fette and
dispensing areas were evaluated using a paired t-test on
the log-transformed data.
Hq! There is no difference, at the 95% confidence
level, between the concentrations observed in pairs at 2
and 4 1pm.
H^: A significant difference does exist. Therefore,
results obtained at either flowrate should be suspected as being biased.
A P-value of less than 0.05 causes the null
hypothesis to be rejected. Thus, no significant
difference is noted. A two tailed test is used because one might expect random differences between pairs to be
positive and
negative-The data obtained from extracting ranitidine off the wall of the cassette is shown in Tables 5.3 and 5.4.
When considering the results obtained in the Fette room
it seems that much more Ranitidine is depositing on the cassette in the case of low flow than high flow. The average ratio of the percentage contribution to total
mass at 2 1pm to the contribution at 4 1pm within each
pair is 1.9. This indicates that about twice as much
ranitidine is depositing (on a percentage basis) on the
wall of the cassette during low flow in the Fette room
when one considers individual pairs.
When considering wall deposition in samples taken in the dispensing area the situation is different. The
ratio of the average percentage contribution is 0.97.
Thus, in the dispensing area, wall deposition is
occurring at an egual level comparing pairs at 2 and 4
LPM when one considers total ranitidine recovered from