•i;
ABSTRACT
JEFFREY A. HUGHES. The Use of Willingness to Pay Information in Sanitation Planning: A Case Study in Kumasi, Ghana.
(Under the Direction of Dr. Donald T. Lauria)
Two models that predicted sanitation coverage in Kumasi were developed using household willingness to pay (WTP)
information. Most (90%) households in Kumasi live in
apartment buildings. It was unclear how to use household WTP information to predict building decisions. The Household Decision Model (HDM) used the WTP frequency distribution to
estimate the number of individual households that would decide to use Kumasi Ventilated Improved Pit Latrines
(KVIPs). The Building Decision Model (BDM) aggregated
household WTP information to predict the number of apartment building owners that would choose to construct KVIPs. Both models estimated the subsidy cost and capital cost of
providing Kumasi households with KVIPs. A sensitivity analysis was performed on the BDM showed it to be highly sensitive to key assumptions concerning the aggregation of household WTP information. This sensitivity suggested that improving the accuracy and usefulness of models such as the HDM and BDM requires a more complete understanding of group decision behavior in Kumasi than is presently available.
'^ͣ
•^pp^-111
TABLE OF CONTENTS
ACKNOWLEDGEMENTS
LIST OF FIGURES LIST OF TABLES
V vi vii
CHAPTER 1: INTRODUCTION 1
1.1 Sanitation in Less Developed Countries i
1.2 The Use of "Demand" Information for Sanitation Planning 3 1.3 Use of Household WTP Information for Planning
Subsidy Programs in Kumasi, Ghana 5
1.4 The Scope of the Paper 6
10 10 12 14
CHAPTER 2: BACKGROUND INFORMATION ON KUMASI ?
2.1 Basic Conditions in Kumasi 2.1.1 Housing
2.1.2 Household Water Supply
2.1.3 Existing Sanitation
2.2 The Demand for Improved Sanitation ^^
2.2.1 Kumasi WTP Questionnaire ^^
2.2.2 Willingness to Pay for KVIPs in Kumasi 22
Mean WTP
Distribution of WTP Bids
CHAPTER 3: TWO MODELS THAT USE HOUSEHOLD WTP INFORMATION TO ESTIMATE KVIP COVERAGE 29
3.1 Household Decision Model(HDM) 3q
3.1.1 Estimating the Number of Households that Would
Adopt KVIPs 31
3.1.2 Approximating the Cost of KVIP Constructionss 3.1.3 Calculating Required Siibsidies 37 3.1.4 Applications of the Household Decision Model39
3.2 The Building Decision Model(BDM) 42
3.2.1 Estimating the Cost of Constructing a Buildijig
KVIP system
3.2.2 Calculating KVIP Subsidies Offered to
Buildings 47 3.2.3 Calculating Net Monthly KVIP Cost After
Subsidization 48 3.2.4 Calculating Collective WTP of an Entire
Apartment Building 49 3.2.5 Estimating Number of Buildings that Choose to Construct KVIPs 50 3.2.6 Aggregating Cost and Coverage Estimates for Entire City 51 3.2.7 Applications of Building Decision Model 52
Example: Subsidy of $30 per Compartment
IV
CHAPTER 4: EXAMINATION AND DISCUSSION OF THE BUILDING
DECISION MODEL AND THE HOUSEHOLD DECISION MODEL 58 4.1 Predicted Coverage Using the Household Decision 59
Model and the Building Decision Model
4.1.1 Results of Applying the Two Models 59 4.1.2 Use of the Two Models in the Planning Process 6i
4.2 Two Subsidy Distribution Plans for Use in Building
Decision Model 62 4.2.1 Per Compartment Subsidy 63 4.2.2 subsidizing a Percentage of KVIP Capital Cost 64 4.2.3 Subsidy Cost of Providing KVIPs under Two
Subsidy Plans 67
4.3 Predictions of Collective WTP in Building Decision
Model 67
4.3.1 WTPH equal to Mean WTP Bid for all Households 70 4.3.2 WTPH equal to WTP Bid 75th Percentile 7i 4.3.3 WTPH equal to the mean of WTP Bids for
Landlords 72 4.3.4 coverage Predictions Following Different ':, Assiimptions Regarding the Calculation of the
Collective WTP of a Building 73
4.4 Summary
---u 75 CHAPTER 5: RECOMMENDATIONS AND CONCLUSTIONS 80 APPENDIX A DESCRIPTION OP ON-SITE SANITATION SYSTEMS 85
APPENDIX B WTP BIDDING GAME QUESTIONS 88
APPENDIX C CALCULATION OF KVIP CAPITAL COSTS 90
ACKNOWLDGEMENTS
I would like to thank Dr. Donald T. Lauria and Dr. Dale
Whittington for their guidance and friendship during my time
at Chapel Hill. I would especially like to thank Dr. Lauria for all of the constructive feedback he patiently gave me. I
am also grateful to Dr. Michael Aitken for his assistance
VI
LIST OF FIGURES
Figure 2 .1
Fiaure 2 .2
Figure 2 .3
Figure 2 4
Figure 2 .5 Figure 2 .6 Figure 2 .7 Figure 2 8
Figure 2 .9
Figure 3 .1
Figure 3 2
Figure 3 3 Figure 3 4 Figure 3 5
Figure 3 6
Figure 3.7 Figure Figure Figure Figure 4.1 4.2 4.3 4.4
Distribution of Households in a Building
Percentage of Households Using Different Water Sources
Percentage of Households Using Different Sanitation
Systems
Average Income Spent on Sanitation by Users of
Different Systems
Monthly Flow of Money and Waste in Kumasi
Mean Monthly WTP Bids for Water and Sanitation
Services
Mean Monthly WTP KVIP Bids of Renters and Landlords Distribution of Monthly KVIP WTP Bids
KVIP WTP Bid Cumulative Frequency Distribution
Household Decision Model
Percent and Number of Households that Would Choose KVIP Service at Different Fees
Capital Costs and Subsidy Cost of Providing KVIP
Service (Household Decision Model,i=30%, n=3 years)
Capital Costs and Subsidy Cost of Providing KVIP
Service (Household Decision Model,i=10%, n=20 years) Building Decision Model (Buildings with Existing
Bucket Latrines)
Expected KVIP Coverage Under Different Per Compartment
Subsidy Rate (Building Decision Model, i=3 0%, n=3
years)
Capital Costs and Subsidy Costs of Providing KVIP
Service (Building Decision Model, Per Compartment
Subsidy Plan, i=30%, n=3 years)
Application of Household Decision Model and Building
Decision Model (i=30%, n=3 years)
Percentage of Households Served if Subsidies are
Distributed as a Percentage of KVIP Capital Cost
The Subsidy Costs for Two Subsidization Plans
(Building Decision Model, i=30%, n=3 years)
Alternative Assumptions of the Fixed Monthly Amount
that All Households in a Building can be Expected to
Pay for KVIP Service (Building Decision Model)
Vll LIST OF TABLES
Table 1.1 Water and Sanitation Services in the Developing World 2 Table 2.1 Different Types of Respondents and WTP Questions 21 Table 2.2 Average Household WTP Based on Existing Sanitation 24 Table 3.1 The Number of Kumasi Buildings Requiring Different
Types of KVIP Latrines 46 Table 3.2 Building Decision Model Example 53 Table 4.1 Summary of Coverage Predictions Using the Household
Decision Model and the Building Decision Model 76 Table CI Calculation of KVIP Capital Costs (Buildings with Bucket
Latrines)
CHAPTER ONE:
INTRODUCTION
1.1 The Need for Improved Sanitation in Developing Countries
In 1990, an estimated 1.7 billion people throughout the world did not have a hygienic method of disposing of their
human waste within or near their homes (Table 1.1). In urban areas, 0.4 million people had no access to adeguate
sanitation systems, while in rural areas, 1.3 billion were depending on sub-standard sanitation.
In response to this problem, the United Nations General Assembly proclaimed the 1980's as the International Drinking Water Supply and Sanitation Decade. Ambitious goals were established and a global effort was launched to improve water supply and sanitation coverage throughout the world. Unfortunately, although gains were made in terms of the percentage of the population served with improved
sanitation, during this decade the absolute number of unserved people rose due to population growth.
Many obstacles to planning sanitation projects exist, and many past planning mistakes have led to expensive
failures. Future progress in addressing the current deficits
in sanitation coverage will depend to a large degree on the
ability of sanitation planners and designers to propose and
Table 1.1
Water and Sanitation Services in Developing World (millions)
1980 1990 Change
Tptgl Populg^lpn 3246 3990 + 754 + 23%
Water Served 1411 44% 2758 69% +1347 + 95%
Unsetved 1825 56% 1232 31% - 593 - 32%
Sanrtation: Served 1502 46% ??50 56% + 748 + 50% Unsetved 1734 54% 1740 44% + 6 0%
Urban Population 963 1332 + 399 + 41%
Walen Served 720 77% 1008 82% + 368 + 51% Unserved 213 23% 244 18% + 31 + 15%
Sanitation: Served 641 69% 955 72% + 314 + 49% Unserved 292 31% 377 28% + 85 + 29%
Rural Population 2303 2659 + 356 +15%
Water Served 690 30% 1670 63% + 980 +142%
ͣ
aspSjw^sw!'•
1.2 The Use of Demand Information in Sanitation Planning
Conventional sanitation planning for both on and
off-site systems in developing countries has traditionally
involved planners designing projects based on their
judgement and supposition. For example, a typical planning
approach for an off-site sanitation system such as piped
sewerage might involve calculating the per capita or per
household costs for a range of different network options.
The planner decides if the calculated costs are "affordable"
to the population based on experience, judgement, and "rules
of thumb." Inherent in the choice is the supposition that
because it is judged to be "affordable" it will be embraced
by the population.
Efforts are rarely made to formally assess demand for
sanitation systems before deciding to promote and construct
them. The Central Accra Sewerage Project, the only large
sewerage system in Ghana, was designed with 500 junctions
for private house connections. It was assumed that private
households would be willing to provide their own internal
plumbing and pay the required connection cost. The project
was completed in 1973. By 1989, less than 100 households had
decided to connect to the system. The lower than expected
connection rate has led to a low level of cost recovery
(less than 12 percent) as well as operation problems (Akosa
et al. 1990). As a result of these types of planning
devoted to projects that attract few users and provide few
benefits.
The lessons learned from past mistakes have led to widespread recognition among water and sanitation
specialists that planning practices need to be more demand-driven (New Delhi WSS Conference 1990; WASH 1990; World Bank 1990). A demand-driven approach requires choosing,
designing, and implementing projects in accordance with what
beneficiaries want and are willing to pay for rather than
what planners think beneficiaries need and would find affordable.
One of the keys to demand driven planning is the inclusion of information concerning beneficiaries'
willingness to pay (WTP) into all phases of the planning process. WTP information can in principle be used to help select appropriate technologies and appropriate levels of service. Once planners have an idea which technologies are viable candidates, WTP information can be incorporated into the establishment of specific implementation policies.
As is the case with any information, WTP data can be misused in the planning process, thus resulting in policy
decisions that are no better or even worse than if WTP data
had not been used. Assessing the willingness to pay of households for improved sanitation is difficult and has rarely been done in the past. Even if some type of WTP information is available, it may be unclear how to
methodologies. The development of methodologies that rely on WTP information is an important issue that requires further
investigation.
1.3 Use of Household WTP Information for Planning Subsidy Procrrams in Kumasi. Ghana
A WTP sanitation study recently completed in Ghana presents an opportunity to explore some of the difficulties associated with using WTP information in the planning
process. Kumasi, the second largest city in Ghana, has many existing sanitation problems. Almost 40 percent of the
population rely on an old unhygienic system of public latrines. Another 2 5 percent of the population use semi-private bucket latrines whose contents are often emptied directly into the urban environment.
The United Nations Development Programme (UNDP) is funding the development of a strategic sanitation plan with the World Bank as the executing agency in an effort to
improve the city's sanitation situation. One of the guiding
principles behind the plan is that it be driven by user
demand (UNDP 1991). As part of the project, an extensive household survey was conducted to assess the WTP of
individual households for different sanitation improvement
alternatives (Whittington, Lauria, Wright, Choe, Hughes, and
Swarna 1991).
One of the essential issues facing planners in Kumasi is the use of subsidies. The existence of externalities
Kumasi justifies considering some type of subsidy program. The method of distributing subsidies to provide Kumasi households with improved sanitation will depend on the
particular technology that is being considered. For example, the method of subsidizing the construction of a city wide piped sewerage system will be different than the method of subsidizing the construction of private pit latrines.
Ideally, in order to use subsidy funds as efficiently as possible, WTP information should be used to determine which households and buildings require subsidies, and the minimum required amount that they require to provide them with
improved sanitation technology.
The Kumasi Ventilated Improved Pit latrine (KVIP) is an on-site sanitation technology that presently has limited use in Kumasi but is being promoted as a potential solution to some of the city's sanitation problems. The KVIP is a type of pit latrine equipped with a ventilation pipe to reduce odor and the number of flies, and with a system of
alternating solids collection pits designed to make emptying the pits easier and safer (see Appendix A for description).
The provision of KVIP service on a massive scale in Kumasi
would require constructing latrine systems in buildings throughout the city.
1.4 Scope of Technical Paper
Most of Kumasi's inhabitants are renters in
little control over the management of their building and would gain access to KVIPs only if their landlords decided
to construct them. Unfortunately, although a household WTP
study has been completed in Kumasi, it provides no direct
information regarding the collective WTP of all households
living in individual buildings.
This report addresses the problem of how to use
information from a household WTP study to examine KVIP subsidy programs in a situation where the decision to construct KVIP latrines is most likely not made by
individual households. The report examines the situation in Kumasi and develops and applies alternative methods of using
data from the household WTP study to estimate the amount of
subsidies required to provide KVIP service to households in Kumasi. Through the development and application of these predictive methods, the paper shows some of the typical
difficulties and limitations of using information from a WTP study of the type conducted in Kumasi to guide the formation
of sanitation policy.
Chapter Two describes the present situation in Kumasi. It presents information regarding the existing housing, water and sanitation conditions in the city. The chapter concludes with a description of the existing demand for
improved sanitation services based on the recently conducted
WTP study.
Chapter Three describes the development and application
8
providing different numbers of households with KVIPs. The chapter details the steps and procedures behind the
development and application of the models. Each of the models is applied under a set of basic assumptions.
Chapter Four examines the models developed in Chapter Three more closely. The results of applying the two models are compared and discussed. New estimates of KVIP coverage and required subsidies are obtained by reapplying the models using different assumptions regarding the distribution of
subsidies and the estimation of the collective WTP of all the households living in a multi-family building. The
significance of the models' sensitivity to key assumptions is discussed as a basis for evaluating their usefulness as a
planning tool.
Finally, Chapter Five makes conclusions and
CHAPTER TWO:
BACKGROUND INFORMATION ON KUMASI
One limiting factor in sanitation planning in developing countries is often the lack of adequate
information on existing sanitation practices. Knowledge of
the sanitation systems people have relied on in the past can provide valuable insight as to how they might react to
alternative systems in the future. Detailed information on housing and other services can also be helpful in the
planning process. Accordingly, as part of a project to
prepare a strategic sanitation plan for Kumasi, a
comprehensive two-phase information gathering survey was performed in the fall of 1989 (Whittington et al. 1991).
The first phase was designed to obtain information regarding the operation of the 4 00 existing public latrines
and the city's 6 desludging trucks. As part of the field
work, observers were placed at public latrines and on
desludging trucks throughout the city. Interviews were conducted with public latrine managers, operators and
cleaners.
10
services. A two-stage stratified sampling procedure was used to select a random sample of 163 3 households. Useable
interviews were obtained from 1224 respondents.
The survey instrument had four sections. Section one included questions on demographic characteristics of the
household. Section two included questions about the existing
water and sanitation systems and practices. Section three solicited information on the households' willingness to pay
for improved water and sanitation services. Finally, section
four contained questions regarding the socioeconomic
characteristics of the household.
2.1 Basic Conditions in Kumasi
2.1.1 Housing
The population of Kumasi is estimated at 600,000
inhabitants and is increasing at a rapid rate. The average size of a household in Kumasi is 4.6 persons. The majority
(95 percent) of Kumasi's population live in crowded
multi-family apartment buildings. Although the average number of rooms inhabited by each household is 1.5, 90 percent of the households live in a single room.
Most households (70 percent) live in single story
buildings. The average number of households in an apartment
building is 11. About 55 percent of the buildings have more
11
Figure 2.1 Distribution of Households in a Building
30
20-o
O)
in
S
o
S 'S
s
s
B 10
u
a.
/ / /
ChUHUiHUUu'^JuUUUiMMaiiaC|^bUMMMMUUAK|.iA*UMUUllMU
^<
1-5 6-10 11-15 16-20 21-25 26-30 >30
12
Most (89 percent) of the households in Kumasi rent their rooms. Over 55 percent of the households live in buildings with their landlord. Strict rent controls in
Kumasi result in rental rates that are much lower than the
market value (Malpezzi 1990). Because of the inability to charge higher rents, landlords have little incentive to make building improvements. The average monthly household rent in 1989 was $1.50, 2.2 percent of the average household income.
(Households spend approximately the same amount for monthly
rent as they do for electricity or six loaves of bread.)
2.1.2 Household Water Supply
Kumasi has a reliable municipal water supply that meets
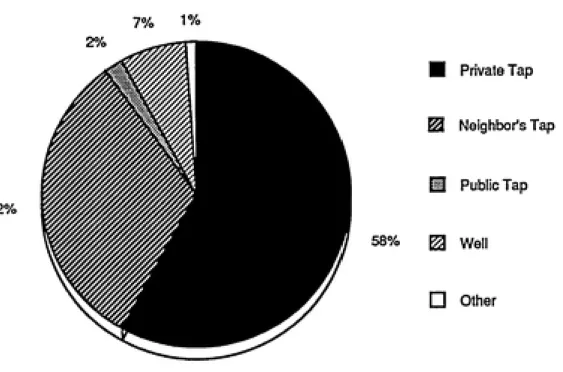
most of the city's needs. Water is available to most households more than eight hours a day. A majority of households (58 percent) have access to a metered private connection in their apartment building. Use of and payment for water is normally shared among all the households in apartment buildings that have their own tap (Figure 2.2). Nearly one-third of Kumasi's households purchase water from taps in neighboring buildings. Remaining households are supplied by public taps and wells.
Households with access to private connections pay an average of $1.13 a month for their share of the water bill. Households that purchase water by the bucket from taps in
13
Figure 2.2 Percentage of Households Using Different Water Sources
7% 1%
32%
Private Tap
Neighbor's Tap
Public Tap
14
2.1.3 Existing Sanitation
Several buildings at the university and the hospital
are connected to a piped sewerage system. An additional five
percent of the population does not have access to any
sanitation facilities and relies on open public areas. The
remaining 94 percent of the population is served by a
variety of public and private on-site systems.
Figure 2.3 shows the current usage of different
sanitation systems in Kumasi. Four hundred public latrines
serve approximately 4 0 percent of the households.
Approximately 25 percent of the households have access to
water closets (WCs) connected to septic tanks. Another 25
percent live in buildings with bucket latrine systems (see
Appendix A for a brief description of different on-site
sanitation technologies). The remaining households use
traditional pit latrines or "the bush."
The city has 10 heavily used public latrines in the
downtown market area. The remainder of the public latrines
are in neighborhood areas. Most of the public latrines (60
percent) are aqua privies. About 25 percent of the public
latrines are bucket latrines. A small number of the public
facilities are equipped with KVIP latrines. Most of the
public latrines are 3 0 years old and in poor condition.
At one time, the public latrines were owned and
operated by the city. The conditions at the latrines became
"KS^j^"''^^^-:^^' '~mw.
Figure 2.3 Percentage of Households Using Different Sanitation Systems
15
25%
38%
ͣ
Public Latrines
0 Bucket Latrines
m Water Closets
^ Pit Latrines
n Bush and Other
16
taken over by local political party organizations called
"Committees for the Defense of the Revolution" (CDRs). The
latrines are typically open from 4:30 A.M to 10:00 P.M.
About half of the public latrines charge adults $0,015 per
visit. Children and the elderly are admitted without
payment.
The bucket latrines within apartment buildings are
cleaned and emptied, on average, twice a week by private
cleaners. The cost of emptying is shared by the users. Most
of the WCs empty into concrete septic tanks which are not
connected to drainage fields. Only 60 percent of the septic
tanks are emptied on a regular basis, approximately once
every 10 months. The $7 cost of desludging a tank is shared
by the building's residents.
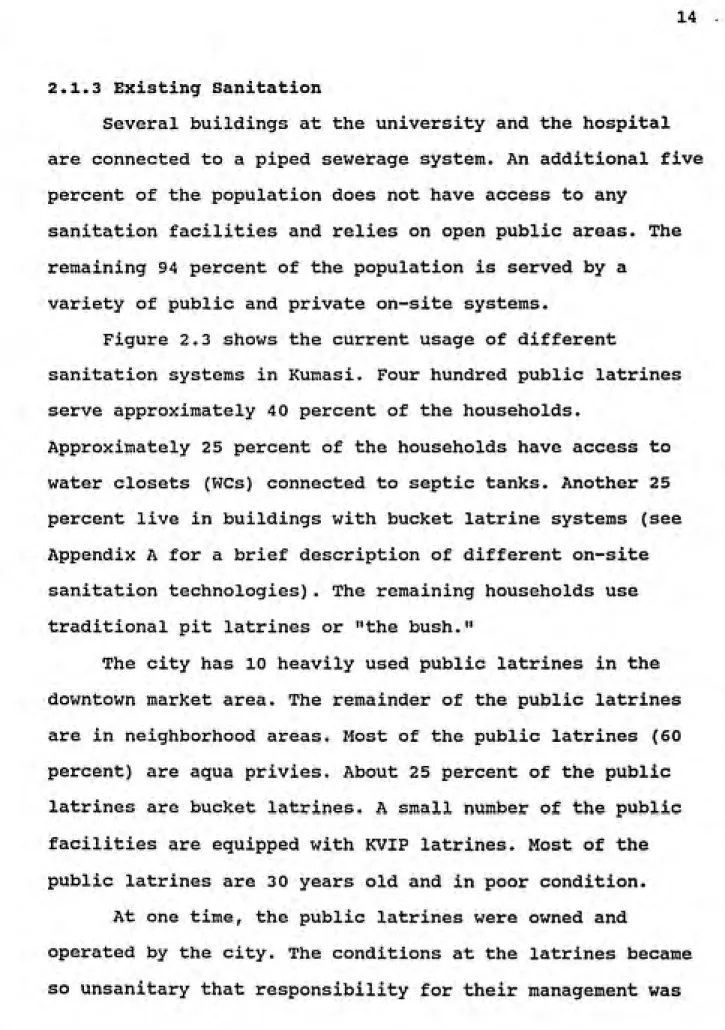
Households using public latrines are spending about
$1.14 per month on sanitation, households using bucket
latrines pay approximately $0.49, and households using WCs
pay only $0.06 per month. Figure 2.4 shows these sums as
percentages of household income. Households using public
latrines spend 2.8 percent of their income on sanitation;
households with bucket latrines, 1.3 percent; and WC users,
0.2 percent. These sanitation expenses only consider
operation and maintenance costs and do not include the
initial capital cost of system construction.
Figure 2.5 shows the monthly flow of human waste and
money in Kumasi. Much of the waste from the existing
- -•S^^^f^!*?!^^^^-^ ͣͣͣ*ͣ".
17
Figure 2.4 Average Income Spent on Sanitation
by Users of Different Systems
3.00%
e
o
w
B
be
B
«
CU
2.00%
1.00%
0.00%
J^
,.in».vwj.,.W.in»o^ioiio.VA«rao
Bucket Latrines Water Closets Public Latrines
HOUSEHOLDS USING PUBLIC LATRINES 230,000 PEOPLE HOUSEHOLDS WITH BUCKET LATRINES 150,000 PEOPLE HOUSEHOLDS WITH WC'S 150,000 PEOPLE HOUSEHOLDS USING BUSH 30,000 PEOPLE $57,000 3,400 m3 $2,000 $ 28,000 $5,000
COMMnTEES FOR THE DEFENSE
ͣ
" OF THE REVOLUTION
ͣ
-LATRINE MANAGERS $ 19,000
ͣ
^ OPERATION AND MAINTENANCE
PUBLIC LATRINES 400 $5,000 300 M-^ $14,000 1,900 m3 PRIVATE CLEANERS/ CONSERVANCY WORKERS 400 18,000 m3 (2,200 m3) HOUSEHOLDS WITH TRADITIONAL PIT LATRINES 40,000 PEOPLE PITS 1,000 600 m3 500 M^ DESLUDGING TRUCKS 6
1,900 m3 2,500 M
1,700 M3
SEPTIC TANKS $2,000
STREAM
1,700M3 17,700 m3
URBAN ENVIRONMENT
NEIGHBORHOOD DUMPS OPEN STREET DRAINS
STREAMS
TOTAL LOADING = 21,600 M^
Figure 2.5
Monthly Flows of Money and Waste in Kumasi
'^-.^^'^^^i^'^^- '.:-!^m^^W'"~;
19
does leave is transported by one of the desludging trucks to
a landfill 10 kilometers outside of town. Most of the
contents from the trucks run straight into a small stream
adjacent to the landfill.
2.2 The Demand for Improved Sanitation
The demand for improved sanitation services such as
KVIPs in Kumasi was assessed through the use of the
contingent valuation (CV) method. This method has been used
in the past by environmental and resource economists
attempting to measure the benefits of environmental
improvements (Freeman 1979, Mitchell 1989). A methodology
for applying the contingent valuation method has been
developed for use in planning water projects (Whittington et
al. 1987). Only recently have CV studies been conducted to
assess the demand for improved sanitation (Velasco 1990,
Whittington et al. 1991).
2.2.1 K\imasi WTP Questionnaire
The Kumasi WTP questionnaire was designed to obtain
information on the monthly willingness to pay for several
different water and sanitation technologies and service
levels. An effort was made to assess the willingness to pay
of an entire apartment building by collectively interviewing
all the household heads in a single building. The process
proved extremely difficult and produced inconclusive
results. Consequently, it was decided to obtain WTP
=ͣ.ͣ5^^^' S?^g?gg^9g5W^3^^:XS,5
-20
questions asked of heads of households or their spouses. All
of the willingness to pay information from this survey is
therefore a measure of the WTP of individual households for
improved sanitation.
The survey included willingness to pay questions for
five different technologies or levels of service: KVIP, WC
with sewer, sewer connection, private water connection, and
private water connection along with a WC with sewer
connection. The questionnaire was designed to estimate
demand for sanitation. Because certain technologies require
water, some respondents were questioned about their WTP for
water connections. Depending on the existing service level,
households were asked their willingness to pay for one to
three of the service packages (Table 2.1).
The willingness to pay questions were asked in the form
of a bidding game — a method of asking questions that
resembles the process that occurs during an auction.
Households were asked if they would pay a certain amount,
and depending on their answer they were asked whether they
would pay a lower or higher amount. The bidding questions
were concluded with an open ended question that asked for
the maximum amount households would pay for the different
services. The details of how the respondents would be
required to actually pay for the services was presented at
the beginning of the bidding game (see Appendix B for a copy
21
Table 2.1
Different Types of Respondents and WTP Questions
1. Households with water and without a WC (406 respondents)
WTP for KVIP
WTP for WC connected to a sewer
2. Households with water and with a WC (295 respondents)
WTP for a connection to a sewer
3. Households without water and without a WC (523 respondents)
WTPforKVIP
WTP for water connection
P-»-5^pT^?-22
2.2.2 Willingness to Pay for KVIPs in Kvimasi
The results of the WTP survey can be presented two
different ways — as a distribution of WTP bids or as mean
WTP amounts calculated by averaging the bids from entire
survey sample or from sub-samples of households with similar
household characteristics.
Mean WTP
Figure 2.6 shows the mean monthly bids for various
services. Respondents bidding for KVIP service had a mean
monthly willingness to pay of $1.47. The mean WTP for WC
service was $1.43.
Mean willingness to pay figures can also be presented
to show the influence of factors such as housing type or
tenancy status on the WTP of a household for improved
sanitation. Table 2.2 shows the mean household WTP bids
based on existing sanitation and water service. Public
latrine users with water were willing, on average, to pay
$1.57 for KVIP and $1.67 for WC service. Public latrine
users without water have a mean WTP of $1.51 for KVIPs and
$1.90 for WC and water.
Figure 2.7 shows the effect of tenancy status on the
willingness to pay of a household for KVIPs. The households
that are renters had an average monthly household WTP of
$1.37 for KVIPs. Households who own their buildings were on
average willing to pay $2.31 to provide their household with
23
Figure 2.6 Mean Monthly WTP Bids for Water and Sanitation Services
nmnmsfnn
KVIPs WCs with Sewer Sewer Water Water and WC
Table 2.2
Average Houshold WTP Based on Existing Sanitation
24
Existing
Sanitation
Willingness to Pay (US $/month) For
KVIP
WC &
Sewer
Sewer
Connection Water
WC & Water
Households with Water
Bucket Latrine Public Latrine
Pit Latrine WC
Other
1.17 1.25 1.57 1.67
1.26 1.33 1.25 1.27
1.32
Households without Water
Bucket Latrine
Public Latrine Pit Latrine Other
1.07
1.51
1.72 1.35
1.71 2.60 1.12 1.90 1.61 2.72 1.33 2.08
25
Figure 2.7 Mean Monthly WTP KVIP Bids of Renters and Landlords
Renter Households Landlord Households
26
Distribution of WTP Bids
The mean willingness to pay values presented in the
last section are, by definition, the average amounts that
the questioned households were willing to pay. Some
households were willing to pay substantially less than the
mean for sanitation service, and some households were
willing to pay much more than the mean. The distribution of
the WTP bids is very important and presents a clearer view
of demand than do simple means.
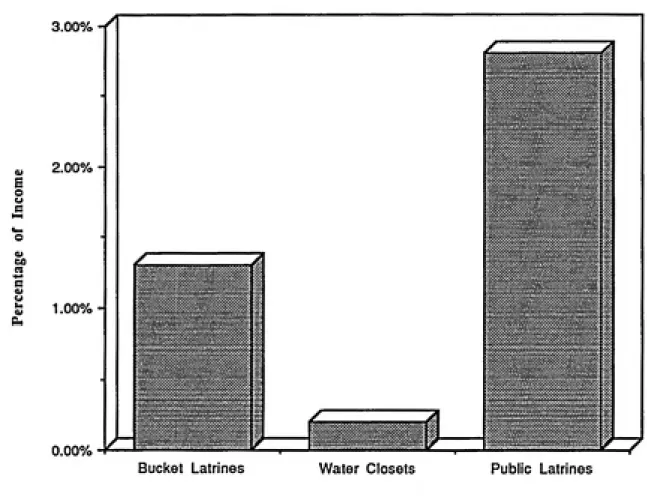
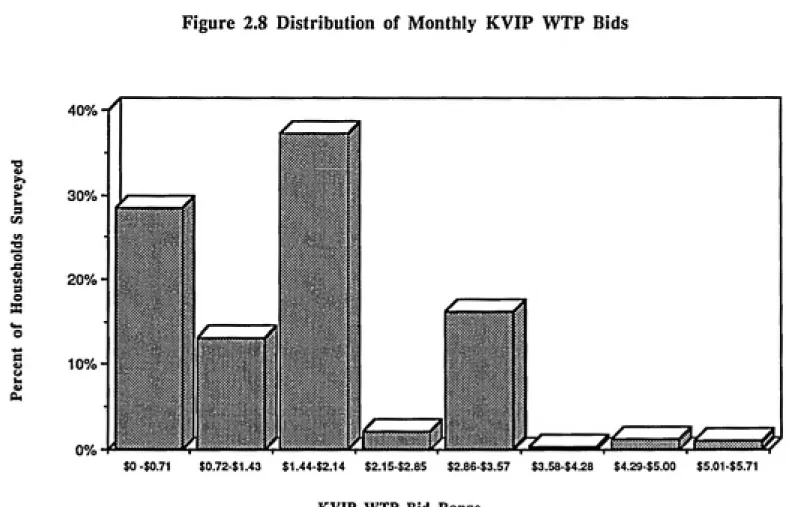
Figure 2.8 shows the distribution of monthly household
bids for KVIP service. Figure 2.9 shows the cumulative
distribution. About 3 0 percent of the households questioned
said they would be willing to pay at least $2.00 for monthly
KVIP service. Fifty five percent were willing to pay an
Figure 2.8 Distribution of Monthly KVIP WTP Bids
>.
V
i*-h
S CO
2
tn
S o S
a
u b
40%
30%-
20%-10%
$0-$0.71 $0.72-$1.43 $1.44-$2.14 $2.15-$2.85 $2,86-$3.57 $3.58-$4.28 $4.29-$5.00 $5.01-$5.71
KVIP WTP Bid Range
Figure 2.9 KVIP WTP Bid Cumulative Frequency Distribution
2
o
V
VI
S o
B
V u k 4)
100%
80%
-
60%-40%
20%
-Monthly WTP For KVIPs
CHAPTER THREE:
TWO MODELS THAT USE HOUSEHOLD WTP
INFORMATION TO ESTIMATE THE SUBSIDIES REQUIRED
TO PROVIDE KVIP SERVICE TO KUMASI HOUSEHOLDS
The question of this chapter is how to incorporate the
results of the WTP study into sanitation planning. The
process of using WTP information to improve the design and
implementation of improved sanitation systems in Kumasi must
begin by identifying specific questions which can be
addressed using information from the WTP study. The answers
to these questions can then help planners and engineers
establish appropriate policies and design new systems. One
such question presently facing planners in Kumasi concerns
the use of subsidies to increase the number of KVIP latrines
that are constructed in the city.
In order to improve Kumasi's existing sanitation
situation, planners are recommending phasing out existing
bucket latrines in private houses and apartment buildings
and replacing most of them with KVIPs; those not targeted
for KVIPs will be replaced with some form of piped sewerage
systems (UNDP 1991). Many of the buildings currently relying
on public latrines will also be targeted for private KVIP
service. Will it require, for example, $3 million or, say,
$10 million in subsidies to provide KVIPs to these
households in Kumasi? If only, say, $2 million in subsidies
30
most people with KVIPs? These are the types of questions of
concern in this chapter.
The WTP information can be used in different ways to
estimate different subsidies. This chapter presents two
models for predicting the subsidy cost of providing KVIP
coverage in Kumasi. The models differ in the manner in which
they use information from the WTP study and the method in
their assumptions about how the decisions are made to adopt
KVIPs. The Household Decision Model (HDM) uses the
distribution of household WTP bids to predict how many
households will decide to adopt KVIP systems. Alternatively,
the Building Decision Model (BDM) follows a different
approach using mean WTP values from the WTP survey to
predict the number of buildings that will construct KVIPs.
3.1 Household Decision Model
In various projects, information from household WTP
studies has been used to estimate the number of households
that would choose improved water and sanitation services at
different prices or fees. Whittington et al. (1989) used
this approach to estimate the number of households in
Onitsha, Nigeria that would connect to a proposed piped
water system at different water prices. Similar efforts have
been made to predict the percentage of households that would
adopt KVIP service at different flat monthly fees (Macoun
.- ~--"Hf«ͣ-K^^T^^^"
One of the fundamental assumptions behind previous
methods of using household WTP information in coverage
prediction models is that individual households have the
power to decide whether or not to adopt a particular water
or sanitation service. A model following this assumption can
be developed to predict the costs and revenues of providing
KVIP coverage in Kumasi. This model is referred to in this
report as the Household Decision Model. The steps and
procedure of applying this model are shown in figure 3.1 and
described in the following sections.
If the results from the application of this model are
to be used for policy decisions, it is important to consider
the conditions and assumptions under which the approach
accurately represents the situation in Kumasi. It is assumed
that the municipal government/sanitation authority would
finance the construction of KVIP latrines in buildings
throughout the city. It is assumed that the city would
borrow money to pay the initial cost. The city would repay
the loan with revenues collected by charging households
fixed monthly usage fees similar to those collected for
water or electricity. Depending on their willingness to pay,
individual households would choose whether or not to
subscribe to the service at the fee set by the municipality.
3.1.1 Estimating the Number of Households that Would Adopt
KVIPs
Of the 600,000 people in Kumasi, 150,000 have access to
ͣ
^^^^^^^^
Figure 3.1 Household Decision Model
32Select new fee
No
Select monthly fee, P,
that households will have to pay for KVIP service
Estimate the number of households, Qp, that will choose
KVIPs at fee P from distribution of WTP responses
Estimate total capital cost, CT, of providing KVIP
coverage for Qp households based on
average KVIP cost per household, CH
CT = CH * Qp
Convert CT to equivalent monthly cost, CTM,
based on the captial recovery factor, CRF
CTM = CRF * CT
Estimate month y revenue, RM,
from Qp households at fee P
RM = Qp * P
Calculate required monthly subsidy, STM
STM = RM - CTM
Convert required monthly subsidy to
equivalent lump sum subsidy, ST
ST = STM/CRF
Are coverage and lump sum
subsidy acceptable?
Yes
"''ͣ
'^^^^m^^^.?3^n--'W-33
to latrines. Consequently, this group was not questioned
about their WTP for KVIP latrines and is not represented in
the cumulative frequency distribution describing KVIP
demand. Given that 450,000 people are living in households
without water closets and the average number of people per
household is 4.6, approximately 98,000 households are
candidates for KVIP service.
The number of households, Qp, that would choose to be
served by KVIPs at a monthly fee of P dollars can be
calculated by multiplying 98,000 by the percent of
households willing to pay the fee from Figure 2.9. If the
monthly fee were set at $1.50, approximately 60 percent
(59,000) of the households would adopt KVIPs (Figure 3.2).
Only 3 0 percent of the candidate households (i.e. 29,000
households) would choose to be served if the fee were raised
to $2.00. About 95 percent coverage (93,000 households)
could be achieved with a fee of $0.30.
3.1.2 Approximating the Cost of KVIP Construction
Capital Cost
The provision of KVIP service to Kumasi's predominantly
tenant population will require constructing latrines in
apartment buildings. These latrines would be shared by
different numbers of households depending on the size of the
Figure 3.2 Percent and Number of Households*
that Would Choose KVIP Service at Different Fees
o
«
9 O X
« w u 4)
eu
100%
80%
60%
-
40%-
20%-$3 $4 Monthly KVIP Service Fee
100,000
80,000 ;a
o JS
-- 60,000 K
40,000 I
s Z .. 20,000
$6
35
latrine will be designed for. It is impossible to discern
from Figure 3.2, what size KVIPs will be required to provide
KVIP service to the "served households." For example,
serving the 3 0,000 households willing to pay at least $2.00
could require 15,000 latrines designed for two households or
6,000 latrines designed for five households. Under these
conditions it is impossible to calculate the exact cost of
providing KVIP coverage solely from the information from
Figure 3.2.
An approximate estimate of the total capital cost of
constructing KVIPS for a given number of households can be
calculated using an assumed average household cost. Several
alternative methods can be used to estimate the average cost
of providing each household with KVIP service.
The simplest method of calculating average household
cost is to divide the average cost of constructing a latrine
by the number of households that it will serve. This method
will have limited accuracy because the cost of a latrine
will vary depending on the number of households it is
designed for. The advantage of this method is that it
requires very little information other than a few KVIP cost
estimates.
A more precise estimate can be obtained by calculating
the cost of constructing all the different sized latrines
that would be necessary to serve all of the candidate
households and dividing that number by the total number of
36
that it requires detailed information on the cost of
constructing different sized latrines as well the number of
different sized latrines that will be needed throughout the
city.
Calculations based on the number of different sized
KVIP systems that would need to be built throughout the city
to serve all the buildings presently relying on public
latrines or private bucket latrines lead to a total city
wide cost of $5.1 million. Dividing this figure by 98,000
households leads to an approximate average cost per
household of $52. The cost functions and calculations used
to determine this estimate are presented in section 3.2.1 in
connection with the BDM.
The approximate total capital cost of providing KVIP
coverage to Qp households is
$52 * Qp (3.1)
Monthly Cost After Financing
It is common practice for municipal governments to
borrow money to finance the construction of water and
sanitation projects. The financing terms vary depending on
the funding source. The terms presently available from
commercial banks in Kumasi are 30 percent over three years.
It may be possible for the government to borrow money from
international lending sources such as the World Bank at more
:c--,
ͣ
,
ͣ
ͣ
:
ͣ
•
ͣͣ
': :^ 37
The monthly loan payments that Kumasi would be required
to make to repay the construction loan of $52 * Qp is
$52 * Qp * CRF (3.2)
Where CRF is the monthly capital recovery factor based on
the financing terms.
3.1.3 Calculating Required Subsidies
Monthly Subsidy
The city will use the revenue from the collection of
the monthly KVIP service fees to pay the debt service for
KVIP construction. It is unclear who will be responsible for
paying the operation and maintenance costs of KVIPs. The
description of the terms of payment in the bidding game
section of the WTP questionnaire did not explicitly mention
who would be responsible for operation and maintenance of
the KVIPs. Some households may have assumed that the WTP bid
they provided in the survey included the cost of maintaining
the KVIPs, while others may have assumed they were only
bidding for access to KVIPs and would still be responsible
for any upkeep costs.
KVIPs must be desludged once every two years either by
KVIP users or private cleaners resulting in minimum
operation and maintenance costs. Because the operation and
maintenance costs are low compared to the cost of repaying
the construction loan, and uncertainty exists as to whether
the bids include O&M costs, it is assumed that the city will
38
service fees only to repay the KVIP construction loans and
not for operation and maintenance costs. If the city offers
KVIP service at a fee P, the monthly revenue it will collect
is
$P * Qp (3.3)
For some levels of the fee, the revenue will not be
sufficient to cover the monthly cost of repaying the loan,
and subsidies will therefore be required. Subtracting the
monthly revenue (Eq. 3.3) from the monthly cost of repaying
the loan (Eq. 3.2) leads to a monthly required subsidy of
$Qp * (52 * CRF - P) (3.4)
Required Initial Lump Subsidy
The funds for subsidizing the construction of KVIPs
could come from the general revenue fund of the city or they
could be provided by an external donor. If an external
organization was the source of subsidies, it may be more
practical for that organization to contribute an initial
lump sum subsidy at the beginning of the project rather than
a stream of monthly or annual subsidies.
The required monthly subsidy can be converted to an
initial lump sum subsidy using the monthly capital recovery
factor. The required initial lump subsidy for a KVIP system
provided to Qp households at a monthly fee of P dollars is
39
3.1.4 Applications of the Household Decision Model
Using the predictions from Figure 3.2 and Equations 3.1
and 3.5, it is possible to estimate the capital cost and
subsidy cost of providing KVIP service to different
percentages of the households at alternative fees.
Figure 3.3 shows the costs of KVIPs if the government
pays for their construction with money borrowed from
commercial banks at a rate of 3 0 percent over three years.
For example, at a fee ($2.00/month) 30 percent of the
population would choose KVIPs requiring an initial lump sum
subsidy of approximately $250,000 in order to cover the $1.6
million total capital cost of construction. Alternatively,
the provision of KVIPs to 50 percent of the households (at a
fee of $1.55/month) would have a capital cost of $2.5
million, $1.0 million of which would need to be subsidized.
If Kumasi's government funded KVIP construction with
money borrowed from an organization such as the World Bank
at the more favorable rates of 10 percent over 20 years, the
required monthly loan payments would be much lower. Under
these financing terms, very little subsidization would be
required because at most fees, the monthly collected revenue
would more than cover the lower monthly loan payments
(Figure 3.4). Without any subsidies, coverage could be
Figure 3.3 Captital Costs and Subsidy Costs of Providing KVIP Service
(Houshold Decision Model, i=30%, n=3 years)
it
u
>
B
>
O
a.
O u
6
5
4
3
0% 20% 40% 60%
Percentage of Households Served
80% 1 00%
Total Capital Cost
Total Required Subsidy
Figure 3.4 Capital Costs and Subsidy Costs of Providing KVIP Service
(Household Decision Model, i=10%, n=20 years)
S
v^
(J
C/3 > u a > o
u
o
U
20% 40% 60% 80% Percentage of Housheolds Served
100%
Total Capital Cost
42
3.2 The Building Decision Model (BDM)
Little evidence exists to validate the assumption that
individual households will control the decision whether or
not to adopt KVIP service in Kumasi. The majority of Kumasi
households are renters living in multi-family apartment
buildings. In most cases, building owners, not the city or
individual households, will probably decide whether or not to construct latrines in their buildings.
A more realistic scenario describing the potential provision of KVIP service in Kumasi than the one in the previous sections is to assume that building owners will borrow money to construct KVIP systems in their buildings. Some form of lump sum subsidy may be available to lower the
amount that the landlords need to borrow. The landlords,
presumably rational, will choose to construct KVIP latrines
if the collective amount that the households living in the
building are willing to pay on a monthly basis for KVIPs is
greater than the monthly amount of money necessary to repay the building's KVIP construction loan.
The required monthly loan payments will vary from
building to building based on the financing terms, initial
construction costs, and level of subsidization. The number
of households that will be served by the KVIP systems will
depend on the number of buildings that have a WTP greater
^5-^^prr
A methodology for estimating the capital cost and
subsidization cost of providing KVIP coverage to different
types of buildings is shown in Figure 3.5. This method is
referred herein as the Building Decision Model.
3.2.1 Estimating the Cost of Constructing a Building KVIP
SystemKVIP latrines consist of squatting or sitting
compartments placed over a dual pit substructure. Generally
one person can use a compartment at a time. Based on queuing
considerations, a single compartment can serve up to 30
people or 6 households, seven to twelve households require a
two-compartment system, and buildings with thirteen to
eighteen households require three compartments. The size of
the pit substructure under each compartment is based on the
number of users.
New KVIP Systems
The World Bank has developed cost functions for KVIP
latrines based on the unit prices of the material and labor
required to construct different sized KVIPs (World Bank
1990). The cost in dollars, CB(H), of a KVIP system with N
compartments serving a building with H households can be
estimated from the following equation:
Figure 3.5 Buiiding Decision Modei (Buiidings witli Existing Bucicet Latrines)
44r
Select subsidy distribution prograrnl
Perform following steps for all buildings with bucket latrines having H households ]
Select new
I subsidy program
Change size
of building, H
No
Calculate construction grant, SB(H), that will be offered to building
based on subsidy distribution program I
! Estimate cost, CB(H), of converting existing bucket latrine ;
to KVIP for a building with H households j
= 131 *nO-5*H 0-24 I
Calculate net cost to building
CB(H) - SB(H)
Calculate the monthly required loan payment, PB(H)
PB(H) = (CB(H) - SB(H)) * CRF
Estimate the collective willingness to pay, WTPB(H), of all
households in building using existing household WTP information
Predict number of buildings that will construct KVIPs, QB(H)
if PB{H) < = WTPB(H),
QB(H) = total number of buildings with existing bucket latrines
if PB(H) >WTPB(H), QB(H) = 0 |
Predict total number of households living in buildings
with H households that will construct KVIPs
_^________Q(H) = QB(H) * H
Calculate total required subsidy for all H household iBuidlings
S(H) = QB(H) * SB(H)
I
-<^ Have all sized buildings with existing bucket latrines been examined^
Yes
' Calculate total number of households presently using bucket latrines
in Kumasi that will be served by KVIPs QT= E Q(H) for all H's
Calculate total lump subsidy that will be required to
provide KVIPs to QT households ST=ES(H)forallH's
^ Are coverage and lump subsidy estimates acceptable? y
No
\.
Yes
ͣ
45 Upgrading Existing Bucket Latrines
Buildings with existing bucket latrines have latrine
superstructures that can be converted for use in KVIP
latrines. The cost of constructing KVIPs by upgrading bucket
latrines is therefore less than the cost of constructing new
KVIP latrines. Cost information from Kumasi shows that the
cost of upgrading an existing bucket latrine is
approximately 60 percent of the cost of constructing a new
latrine such that
CBU(H) = 131 * N°'^ * H°-2'^ (3.7)
Using this equation to calculate the cost of upgrading a
bucket latrine system presently serving a 10-household
apartment building results in a predicted building cost of
$322. (
The Number of Buildings Requiring Different Types of KVIPs
Information was obtained from the sanitation study to
estimate the number of different sized buildings in Kumasi
that would require new KVIP systems and upgraded bucket
latrine KVIP systems; the findings are shown in Table 3.1.
Using the housing distribution in Table 3.1 and Equations
3.6 and 3.7, the total cost of constructing KVIPs in all
buildings is calculated at $5.1 million (See Appendix C for
46
Table 3.1 The Number of Kumasi Buildings*
Requiring Different Types of KVIP Latrines
Building Size Number of Buildings Number of Buildings
(Number of HH thiat Require New KVIPs that Require Upgrades living in Building) (No existing latrines) (Existing bucket latrines)
1 807 1194
2 346 418
3 307 597
4 403 1344
5 184 836
6 230 597
7 99 580
8 274 627
9 166 438
10 369 597
11 220 445
12 230 179
13 106 248
14 107 273
15 69 231
16 79 105
17 68 56
18 90 66
19 30 94
20 46 66
21 5 51
22 58 54
23 10 5
24 29 5
25 14 0
26 0 28
27 9 0
30 4 0
31 0 4
32 14 7
34 0 4
35 0 3
37 0 16
44 3 3
45 0 5
ͣ
'"f^m;^-47
3.2.2 Calculating KVIP Subsidies Offered to Buildings The method of calculating the total subsidy costs of KVIP coverage using the BDM depends on an assumption
regarding how subsidies will be distributed. In the case of the Household Decision Model, it was assumed that subsidies would be provided to a central authority in order to offset the capital cost of constructing a city wide system of
KVIPs. The Building Decision Model assumes that subsidies will be distributed to the owners of individual buildings.
One method for distributing subsidies to building
owners is a program of lump sum construction grants based on
the number of KVIP compartments built. This method would be
fairly equitable and could be verified by visual inspection of the facilities during or after construction. Landlords of buildings requiring large multi-compartment KVIP systems would qualify for significantly higher subsidies than owners of relatively small buildings. Under this scheme, a building owner would receive SB(H) dollars after constructing a
N-compartment KVIP system for H households such that: SB(H) = SK * N (3.8)
where SK is a fixed subsidy per compartment ($ per
compartment), and N is the required number of compartments to serve H households (1<H<6,N=1; if 7<H<12, N=2,etc.). The
fixed per compartment subsidy rate would be established by
planners. If the subsidy level were set at, say, $60 per
48
latrine for a 10 household building would qualify for a $120
grant.
Some of the problems associated with a per compartment
subsidy program are addressed in the next chapter wherein
the Building Decision Model is used to evaluate other subsidy plans.
3.2.3 Calculating Net Monthly KVIP Cost After Subsidization
Due to the limited availability of capital in Kumasi,
it is likely that building owners will borrow to pay for the
construction of KVIP latrines in their buildings. The terms
of the loan will depend on the funding source. It can be assumed that the sanitation authority could borrow money
from an organization such as the World Bank at rates more
favorable than those available at commercial banks. It can
further be assumed that the sanitation authority would lend
money directly to building owners or have a local bank
administer a KVIP lending program. In either case, the
government or participating banks would probably lend the
money at higher rates than they acquired it in order to
cover their operating costs and/or profit needs.
Consequently, it is unlikely that individual building owners
would qualify for rates much more favorable than the 30
percent over 3 years presently offered by Kumasi's
commercial banks.
The monthly payment in dollars that a building owner
IgSP*'i^i?^.
49
would depend on the initial construction cost, subsidy amount and financing terms as follows:
PB(H) = (CB(H) - SB(H)) * CRF (3.10)
where PB(H) is the monthly loan payment for a building with
H households; CB(H) - SB(H) is the KVIP cost after
subsidization that a building owner would need to borrow, and CRF is the capital recovery factor based on the
financing terms.
3.2.4 Calculating Collective WTP of an Entire Apartment
Building
A building with H households will probably construct a KVIP system if the collective monthly WTP of all households within the building is greater than the monthly cost of
paying back the KVIP construction loan. Unfortunately,
information on the WTP of individual buildings is unavailable. However, household WTP information from
Kumasi's WTP study can be used to estimate the collective WTP of buildings by making certain assumptions regarding the behavior of households within a building.
One of the simplest methods of estimating the WTP of a building is to assume that each household within the
building would be willing to pay an amount equal to an "average household WTP" calculated by averaging what all households in Kumasi said they would be willing to pay for KVIPs:
50
where WTPB(H) is an estimate of what, collectively, the H households in an apartment building would be willing to
pay for monthly KVIP service, and WTPHjne^n ($1-47) is the
average amount all the households questioned in the WTP survey were willing to pay for monthly KVIP service. For example, a building with 10 households can be assumed to be willing to pay $14.70 a month for access to KVIP service. Unfortunately, no evidence exists to suggest that this
method of calculating the collective WTP of households in an apartment building is valid. Accordingly, alternative
assumptions leading to alternative methods of calculating building WTP are presented in the next chapter.
3.2.5 Estimating Number of Buildings that Choose to Construct KVIPs
The number of different sized buildings that will be able to construct KVIPs can be predicted by comparing the monthly collective amount that all the households in an
apartment building would be willing to pay for KVIP service
with the required monthly building loan payment. If the WTP
of a building with H households is less than the required
building loan payment, then it can be assumed that no owners
of buildings with H households would decide to borrow money
to construct KVIPs. If the WTP of a building is greater than
the monthly required loan payment, all of the building of
that type and size will build KVIPs. In mathematical terms,
if PB(H) > WTPB(H), then QB(H) = 0 (3.12)
51
PB(H) < = WTPB(H), then QB(H) = B(H) (3.13)
where WTPB(H) is the WTP of a building with H households;
PB(H) is the amount the building would have to pay each
month to retire the initial loan; QB(H) is the number of H
household buildings that would choose to construct KVIPs,
and B(H) is the number of buildings with H households in
Kumasi that are candidates for KVIP service (Table 3.1).
3.2.6 Aggregating Cost and Coverage Estimate for Entire City
Household KVIP Coverage
Calculating the total number of households that would
gain access to KVIPs under different subsidy plans requires
applying equations 3.6 to 3.13 to each group of similarly
sized buildings that are candidates for new KVIPs and
upgraded bucket latrine KVIPs. The total number of
households that would gain access to KVIPs is the sum of all
of the households living in buildings that decide to
construct KVIPs as follows:
QT = H [QB(H) * H] (3.14)
where QT is the total number of households that would be
served by KVIPs, and QB(H) is the number of buildings with H
households that decide to construct KVIPs.
City Wide Subsidy Cost
The calculation of the total lump sum subsidy cost of
52
subsidy plan will depend on the number of buildings
throughout Kumasi choosing to construct KVIPs such that: ST = H [QB(H) * SB(H)3 (3.15)
where ST is the total lump sum subsidy in dollars
distributed to all buildings deciding to construct KVIPs; QB(H) is the number of buildings with H households that decide to construct KVIPs, and SB(H) is the subsidy($) offered to an individual building with H households.
3.2.7 Applications of Building Decision Model
Example: Subsidy of $30 per Compartment
Table 3.2 shows the results of using the Building
Decision Model to predict KVIP costs and coverage if a $30
per compartment subsidy is offered to landlords for constructing KVIP systems. The results are based on the assumption that money to build KVIPs will be available at
terms of 3 0 percent over 3 years.
Groups of buildings with the same number of households requiring a specific type of KVIPs are analyzed
individually. The results of all of the analyses are
aggregated to estimate total city cost and coverage figures.
For example, 3 07 buildings in Kumasi have three households
Anaffti*: Bufldino Decision MocM Subsidy Plan: $30 pw KVIP Compvtment
Flnane^g Terms (U30%. n<-3 years)
53
BdMlngs with Existing Bucket Utraws {KVIP wW be an Upgnde)
Clly Lump Sum Building Numbef or »ofKum BOjCap. Building HsouirMMoo. Building Buildings HH-sCkxered Cap Cost aiySuO.
Size Compartmenis BuJUinos Coal Subsidy Bids. P«y- wrp w KVIPS (QB-H) (QB*C8) (OB-SB)
H N B OB SB PB WTPB oe Q C S
1 1 807 $131 $30 $4 63 $1.47 0 0 . 0 0
Z 546 stss SO tS.72 $2.93 0 0 0 0
as 1 307
4 1 403 sin $30 $7 00 %SM 0 0 0 0
5 1 184 tin $30 $747 $7.33 0 0 0 0
6 1 230 $201 $30 $7 86 $6.79 230 1383 $46,396 $6,914
7 2 » $2K $60 $1030 $10.26 0 0 SO $0
8 2 274 $305 $60 $11.25 $11.73 274 2189 $83,485 $16,420
9 2 16« $314 $60 $11.65 $13.19 166 1406 S52.230 $9,966
10 2 3e9 $322 $60 $12.02 $14.66 360 3687 $118,674 $22,123
11 2 220 $32« $60 $12J)6 $16.12 220 2420 $72,438 $13,199
12 2 230 $336 $60 $12.66 $17.59 230 2765 $77,489 $13,827
13 3 106 S420 $90 $15.13 $19.05 106 1383 $44,651 $9,573
14 3 107 $427 $90 $15.48 $20.52 107 1496 $45,723 $9«30
IS 3 60 $434 $90 $15.81 $21.99 69 1037 $30,037 S6J22
16 3 79 $441 $90 $16.12 $23.45 79 1267 $34,055 $7,130
17 3 68 $448 $90 $16.41 $24.92 68 1152 $30347 S6.100 IS 3 90 $454 $90 $16.70 $26 J> 90 1613 $40,679 $8,068
1» 4 30 $531 $120 $18.86 $27.85 30 576 $18,100 $3,639
20 4 46 S538 $120 $19.16 $29.31 48 922 $24,776 $5J31
21 4 5 $544 $120 $19.45 $30.78 5 115 $2,964 $658
22 4 58 $550 $120 $10.73 $3225 56 1267 $31,686 $6,914
23 4 10 $556 $120 $20.00 $33.71 10 230 $5,570 $1202
24 4 29 $562 $120 $20.26 $35.18 29 691 $16,177 $3,457
25 5 14 $634 $150 $22.21 $36.64 14 346 $8,767 $2,074
27 5 9 $648 $150 $22.75 $39.57 9 230 $5,513 $1J!80
30 5 4 $662 $150 $23.51 $43.97 4 115 $2,544 $576
32 6 14 $737 $100 $25.56 $46.90 14 481 $10,615 $2,593
44 0 3 $919 $240 $31.14 $64.49 3 115 $2,406 $620
Building Size Number of Compartmeria #ofKum BulUlngs
8uildinosWtmoutExlstkioLatrtn«« (N«w KVIPs Rwiulrad) BIdgCap. Cost CB Building SutuMy Required Mon. Bldg. Pay. PB Building Buildings
wrp w KVIPS WTPB oa HKa Covered (OB-H) City Cap Cost (oe-CBi Lump Sum atysuo. (QB'SBI S 418 597 1344 836 597 580 627 438 597 445 179 248 273 $218 $257 $283 $304 $320 $335 $491 $507 $522 $535 $548 $559 $698 $711 $722 $734 $745 $755 $883 $894 $904 $915 $924 $934 $1,064 $1,218 $1,226 $1,243 $1,252 $1,371 $1,528 $1,536 $30 $30 $30 $30 $30 $30 $60 $60 $60 $60 $90 $90 $90 $120 $120 $120 $120 $120 $120 $150 $180 $180 $180 $180 $210 $240 $240 $8.62 $10.42 $11« $12.56 $13.33 $13.99 $19.79 $20.52 $21.19 $21.81 $22.37 $22.90 $27.90 $26.48 $29.02 $29.54 $30.03 $30.51 $35.01 $35.51 $35.99 $36.46 $36-91 $37.35 $41.96 $47i5 $47.97 $48A) $49.20 $53.26 $59.08 $59.46 $1.47 $2.93 $4.40 $5.86 $7.33 $8 79 $10.26 $11.73 $13.19 $14.66 $16.12 $17.59 $19.05 $20.52 $21.99 $23.45 $24.92 $26.38 $27.85 $29.31 $30.78 $3225 $33.71 $35.18 $38.11 $45.44 $46.90 $49.83 $5130 $5423 $84.49 $65.96
0 0 0
119 $4,360 $632
119 $4,273 $814
597 $22,124 $3390
119 $4,147 $652
239 $8,153 $1,274
Totals:
Oty Wide Totals Total Households Covered:
Total Capital Cost Total SubsMy Cose
QHT-26,963 i-1.194 - 20.157 CT . $804^43 * $43,066 - $847,309