Payer Perspectives on Balancing
Access & Affordability of Specialty Medications
in the Evolving US Healthcare System
Key Insights from Dialogue with Payers
By
Ben Muller
Honors Thesis
UNC Eshelman School of Pharmacy
University of North Carolina at Chapel Hill
March 1, 2019
Approved:
Muller - page 2 ABSTRACT
Introduction: The rising cost of prescription drugs in the United States has become a concern for patients, prescribers, payers and policy makers. Prescription medications comprise an estimated 10-14% of overall personal health care services in the United States, and drug spending is projected to grow at a faster rate than overall healthcare expenditures in the coming years, comprising an increasingly larger percentage of our nation’s health care expenditure. With the introduction of specialty medications (e.g. direct-acting antivirals for Hepatitis C and oral chemotherapy agents), traditional-cost containment strategies are no longer sufficient, necessitating the use of novel managed care strategies to improve patient outcomes and decrease costs.
Methods: A comprehensive literature review was conducted utilizing electronic databases to describe traditional cost-containment strategies and uncover innovative strategies currently being implemented in the Hepatitis C and oral chemotherapy space. Key payer stakeholders (public and private payers, self-funded payers, health systems, integrated delivery networks, and pharmacy benefits managers) were engaged in in-depth, semi-structured interviews to validate the findings of the literature review. Additionally, payers were invited to discuss current and future innovative managed care cost-containment strategies that are being implemented or developed in real-world pharmacy practice.
Results: Four categories of managed care clinical programs were identified that have a clear impact on clinical and financial outcomes associated with the management of Hepatitis C and oral chemotherapy products. These strategies include: (1) task-shifting, (2) medication optimization with refill outreach, (3) oral chemotherapy programs, and (4) oncology financial assistance programs. Each type of strategy was examined to describe program impact, application and effectiveness as a managed care solution. These strategies were then validated by key payer stakeholders, uncovering additional cost-saving mechanisms related to: (1) traditional managed care strategies, (2) CMS policies and programs, (3) value-based contracting, (4) pharmacy benefit design, and (5) future cost savings measures under development. These mechanisms were examined to identify health policy recommendations.
Muller - page 3 INTRODUCTION
The rising cost of prescription drugs in the United States has become a concern for patients, prescribers, payers and policy makers. The Department of Health and Human Services (DHHS) Office of the Assistant Secretary for Planning and Evaluation (ASPE) estimates that prescription medications, both retail (drug spending at outlets that directly serve patients) and nonretail (spending by medical providers for drugs they provide directly to patients) comprised 16.7% of the estimated $2.729 trillion spent on overall personal health care services in the United States in 2015.1 In the 1990s, prescription drugs typically accounted for 7% of healthcare spending,
indicating the rapid growth in proportion of pharmacy spend in recent years. This rapid growth underscores the importance of prescription drugs as a potential contributor to long-term growth in overall healthcare costs. The National Health Expenditure Accounts (NHEA) projects that total personal health care services will rise by an average of 5.2% annually until 2018.1 Since the ASPE indicates that prescription drug spending will grow at a
faster pace of 7.3% annually, prescription drugs are projected to comprise an increasingly greater percentage of all health care spending in the coming years.1
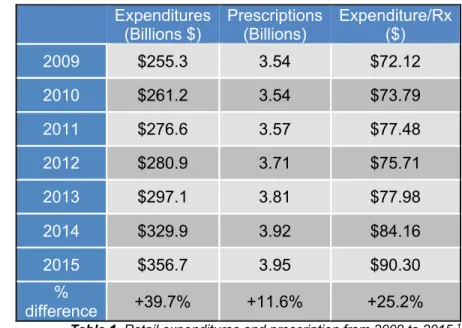
The IQVIA Institute for Human Data Science, a reliable source of information on prescription drug expenditure, conducted a National Prescription Audit (NPA) between the years of 2009 and 2015.2 The IMS NPA data on
prescription expenditures represents nationally projected estimates based on a sample of 46,400 chain store, independent store and food store pharmacies. The audit shows that both estimated expenditures and number of prescriptions increased substantially during the audit period (Table 1). The total number of prescriptions rose from 3.54 billion to 3.95 billion, an 11.6% increase; whereas, the total retail prescription drug expenditure rose from $255.3 billion to $356.7 billion, a 39.7% increase.2 These figures
indicate that drug expenditure rose 3.5-fold
faster than number of prescriptions. Viewed from another perspective, the cost per prescription rose 25% from $72.12 in 2009 to $90.30 in 2015, suggesting that drug price inflation is largely a result of increasing drug prices rather than growth in the volume of prescriptions.2
For this very reason, rising drug prices are currently under scrutiny as the focus of a variety of research and conversations. According to the HHS ASPE, an analysis of factors underlying the rise in prescription drug spending from 2010 to 2014 identified that 30% is due to either changes in the composition of drugs prescribed toward higher price (brand or specialty) products or price increases for drugs that together drove average price increases in excess of general inflation.1,3 The ASPE also explains that expenditures on specialty drugs generally
appear to be rising more rapidly than expenditures on other drugs, also contributing to the increase in prescription pharmaceutical spend. 1
As the drug pricing landscape has evolved, payers and other various stakeholders have made efforts to develop managed care strategies to control drug spend. Typically, these cost-containment strategies have been categorized in one of three broad themes: utilization strategies, pricing strategies and regulatory strategies.11 In 2005, the Kaiser Family Foundation completed a comprehensive literature review to address drug
spending growth and evaluate strategies that public and private payers were implementing to control growth in drug spending (Supplemental Material, Table 6). The report is very thorough and provides detailed descriptions of over 30 specific cost control strategies, ranging from market-based approaches intended to affect which and how many drugs patients use (e.g. prior authorization, step edits) to restrictions on pharmacy networks and government mandated price regulation.
Expenditures (Billions $)
Prescriptions (Billions)
Expenditure/Rx ($)
2009 $255.3 3.54 $72.12
2010 $261.2 3.54 $73.79
2011 $276.6 3.57 $77.48
2012 $280.9 3.71 $75.71
2013 $297.1 3.81 $77.98
2014 $329.9 3.92 $84.16
2015 $356.7 3.95 $90.30
%
difference +39.7% +11.6% +25.2%
Muller - page 4
In recent years, with the introduction of expensive specialty drugs, biologics and biosimilars, payers have been forced to develop newer and more innovative methods of controlling drug costs. The potential impact that these expensive new drugs could have on our healthcare system is devastating. However, some costly drugs may offer reasonable value. At first glance, sofosbuvir (Sovaldi), a 12-week treatment for the Hepatitis C Virus (HCV), is simply another medication contributing to the issue, with a total price tag of $84,000 ($1000 per tablet).12
Despite the astronomical price of sofosbuvir, this treatment was found to be a cost-effective treatment for HCV when taking into consideration the patient’s lifetime horizon and a societal perspective. Furthermore, a study was conducted that showed Medicaid programs were able to spend an estimated $1.1 billion (after discounts) on sofosbuvir with no additions to their budgets.12 This finding highlights the need to understand factors that
contribute to recent medication price inflation while evaluating expenditures on these prescription drugs to ensure that they are equivalent with their value, affordable to the health care system, and equitable for all parties involved.
As the United States health care system transitions towards value-based care (VBC), providers will receive reimbursements based on patient outcomes, known as value-based payments. In this VBC model, it is in the provider’s best interest to minimize costs while ensuring proper health outcomes—two goals that clinical pharmacists can assist providers in achieving. The role of the clinical pharmacist as an integral member of the health care team has been proven to improve overall health outcomes and lower costs through optimization of medication use. The impact that pharmacists can have in a clinic setting is due in large part to the occurrence of improper and unnecessary medication use. In 2015, prescription drug spending totaled $325 billion of the total $3.2 trillion United State (US) healthcare expenditure. A similar proportion of the total healthcare expenditure, $300 billion, was spent on health care costs resulting from the improper and unnecessary use of medications. These figures suggest that for every dollar spent on a prescribed medication, another dollar is spent addressing a medication related problem. Pharmacists’ interventions can address this unnecessary expenditure while ultimately improving patient outcomes and managing total cost of care.
Muller - page 5 METHODS
A literature review was conducted to develop a baseline understanding of the US drug pricing landscape while also identifying historically utilized cost-containment strategies & uncovering newer, more innovative managed care strategies being implemented – from the clinic setting to national health policy. This literature search was limited to Hepatitis C & oncology as these disease states are managed with expensive specialty medications that require careful population health and utilization management strategies to contain costs. The literature review was conducted utilizing three major electronic databases using a variation of the following search terms: (“high cost drugs” OR “pharmaceutical expenditure” OR “financial toxicity”) AND (“managed care” OR “cost-containment strategies”) AND (“Hepatitis C” OR “oral oncology”). The initial search results returned 615 related articles, which were filtered to a total 135 articles. These articles were abstracted to identify four common cost-containment strategies implemented in the clinic. Each type of strategy was examined to describe impact, application and effectiveness as a managed care solution.
There are many innovative practice models incorporating unique managed care strategies to contain the cost of drugs that are not yet described in literature, and an efficient way to uncover these is to engage in discussions with key stakeholders. The second phase of this project was a qualitative study in which payers were engaged in semi-structured interviews in order to contextualize findings from the literature review and identify feasible implementation strategies while uncovering further innovative strategies not identified in literature. A total of 8 formulary decision-makers (public and private payers, self-funded plans, health systems, integrated delivery networks & pharmacy benefits managers) consented for a phone interview. No compensation was provided for participation. Each payer participated in an in-depth, semi-structured, 60-minute interview conducted by a senior research associate and a student pharmacist during July and August 2018. Interviews were recorded and transcribed, and subjects were de-identified before analysis. Responses were coded into themes and organized into a data abstraction matrix for comparison across themes and payer types.
RESULTS
PHASE I: COMPREHENSIVE LITERATURE REVIEW
The comprehensive literature review uncovered a variety of strategies with variable effectiveness in containing costs associated with the treatment of Hepatitis C and cancer. Data abstracted from the review identified four categories of managed care strategies that can have a clear impact on clinical and financial outcomes associated with these specific patient populations: (1) task-shifting, (2) medication optimization or refill outreach, (3) oral chemotherapy programs, and (4) oncology financial assistance programs.
Task Shifting with 2nd Generation Direct-Acting Antivirals for the Management of Hepatitis C
According to the CDC, an estimated 3.2 million people are living in the United States with chronic Hepatitis C Virus (HCV).16 An estimated 80% of these people remain untreated, which can be attributed to under-diagnosis
of HCV as well as barriers to treatment access. These barriers include both the high cost of therapy and limited availability of workforce available to deliver care.17 Standard of care direct-acting antivirals (DAAs) are expensive
drugs, deterring patients from receiving life-saving medications, which can ultimately lead to more costly comorbidities (e.g. cirrhosis, hepatocellular carcinoma, liver transplantation).18 Additionally, the specialists that
manage this condition (hepatologists, gastroenterologists, infectious disease specialists) typically practice at urban referral medical centers that are geographically separated from HCV patients in medically underserved areas, whom remain outside the continuum of HCV care.19
To combat these barriers to treatment, clinics have been developed that utilize task-shifting to empower more abundant and accessible local non-physician healthcare providers to deliver HCV care to patients earlier in their disease course. In one such model, implemented by Stanford University Medical Center licensed vocational nurses and support staff manage the treatment of HCV patients taking 2nd generation direct-acting antivirals
Muller - page 6
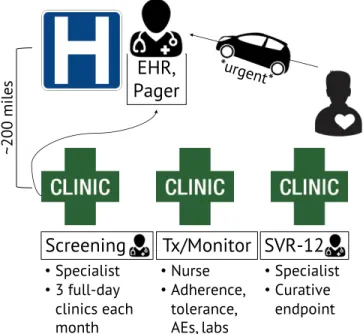
• Specialist physicians (hepatologists) traveled to three hepatology outreach clinics (in medically underserved areas of California that were located roughly 200 hours from their academic medical center) for three full clinic days each month to screen patients and enroll them in the study.
• Patients initiated on 2nd generation DAAs
received routine follow-up telephone calls from licensed vocational nurses and support staff to confirm regimen adherence and tolerance throughout duration of treatment. • Labs were communicated to the specialists
via a shared electronic medical record (EMR). Critical lab results or concerning symptoms were shared immediately with specialists via pager.
• Specialists were available for urgent or scheduled follow-up appointments throughout treatment course.
• Specialists assessed patient outcomes 12 weeks after completion of therapy to
determine curative endpoint of viral clearance(known as sustained viral response at 12 weeks, SVR-12).
In this devolved task-shifting model, 88% of HCV patients achieved the curative endpoint of undetectable HCV RNA 12-weeks after completion of therapy (SVR-12).19 This clinic structure was projected to decrease incidence
of decompensated cirrhosis by 71%, hepatocellular carcinoma by 63%, liver transplantation by 71%, and liver-related death by 68%, consistent across all sub-populations of patients (naïve non-cirrhotic, treatment-naïve cirrhotic, treatment experienced non-cirrhotic, treatment experienced cirrhotic). Clinic capacity was assumed to be double that of a clinic supporting 1st generation DAAs, and reductions were realized in
on-treatment monitoring costs of 56% and total lifetime costs of 20%.18
Overall, the treatment effectiveness results of this task-shifting model are comparable to pivotal clinical trials for these 2nd generation DAA-based regimens, and to “real-world” experiences at tertiary care centers in the US. As
evidenced above, the task-shifted treatment model achieved these results in a cost-effective manner that realized savings for all HCV patient subgroups.
Figure 1. HCV clinic structure incorporating task-shifting from HCV specialist at an urban academic medical center to LVN at multiple rural clinics in medically underserved areas.18
EHR,
Pager
*urgent*Screening
Tx/Monitor SVR-12
•Specialist
•3 full-day clinics each month
•Specialist
•Curative endpoint
•Nurse
•Adherence, tolerance, AEs, labs
~200
m
ile
Muller - page 7
Two-tiered Outreach Program for the Management of Hepatitis C
Second generation DAAs offer improved cure rate and greater tolerability compared to previous HCV regimens. However, their exorbitant costs are detrimental to patients, health care systems & health plans. A recent analysis estimates that these novel DAAs will cost payers $136 billion over the next 5 years, $61 billion of which will be paid by the government.21 In addition to cost concerns, nonadherence is a known issue for patients on these
complex and toxic medications that offer a high pill burden and a variety of drug-drug interactions (DDIs).
The University of Massachusetts Medical School’s Clinical Pharmacy Services developed a solution that addressed both of these known issues by providing cost-effective care and adherence support provided by pharmacists.22 Their
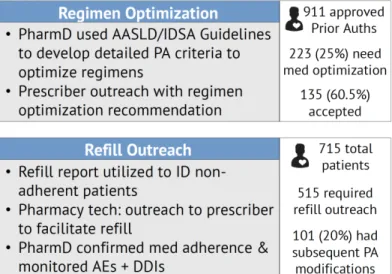
comprehensive HCV medication management program utilized a two-tiered approach to identify patients that could benefit from (1) regimen optimization and (2) refill reminders followed by provider and patient outreach (Figure 2).
In the first tier, pharmacists used HCV guidelines published by the American Association for the Study of Liver Diseases and Infectious Disease Society of America (AASLD/IDSA) to develop detailed prior authorization (PA) criteria that were then utilized to identify patients during the PA review process with regimens that could be optimized for efficacy, safety and cost. All regimen optimization recommendations were based on consensus guideline criteria for genotype, liver fibrosis staging, and prior treatment history, and were required to provide similar or improved cure rates at a lower cost than originally prescribed regimens. Consideration of DDIs and clinical rationale was also incorporated into the PA review process. Of the 911 PAs that were approved, pharmacists identified 25% (223) as meeting the criteria for medication optimization, which included changing medications, treatment duration or both. Pharmacists provided recommendations to the prescribing physicians, whom accepted 65% (135) of pharmacist-recommended interventions. The most common regimen change was shortened duration of therapy (55 of 135 regimen changes).22
In the second tier, pharmacy claims history was used to identify patients who were nearly or past due for a refill. Pharmacy technicians would then contact the prescriber to facilitate the refill process. A total of 515 members were included in the refill outreach program and were informed of an upcoming or past due refill of their HCV medication. Of these, 101 patients had subsequent PA modifications (e.g. PA closed due to treatment deferral/adverse events/hospitalization or PA extended due to prescriber extending treatment or start date) and 414 members subsequently completed refills for their HCV medications.22
As a result of this two-tiered pharmacist-led outreach program, total cost avoidance of $3.8 million was realized, the majority of which resulted from shortening Harvoni treatment duration from 12 to 8 weeks (with no decrease in SVR-12). After subtracting program costs during the study period, the program demonstrated an ROI of $10.28 for every $1 spent.22
Muller - page 8
Oral Chemotherapy Program Incorporating Collaborative Practice Agreement Protocol with Medication Therapy Management Services
The use of oral chemotherapy increased from 5% of chemotherapeutic agents administered in 2003 to 25% administered by 2010.23 Although this formulation has improved convenience and quality of life compared to
chemotherapy infusions, non-adherence to oral medications is a challenge that compromises treatment outcomes. Muluneh et al. from the University of North Carolina (UNC) Lineberger Cancer Center developed a 30-question survey to analyze patients’ use of oral chemotherapies and identify opportunities to improve adherence.24 This study found that there are three main barriers that prevent patients from optimal oral
chemotherapy at-home adherence: misunderstanding about the timing of drug with food, difficulty understanding labeling directions, and stopping drug without informing physicians. These findings indicate that a multidisciplinary approach is needed to optimize adherence & improve outcomes.
Subsequent to this survey study, UNC’s Lineberger Cancer Center implemented an oral chemotherapy program with comprehensive pharmacy services and assessed the program’s impact on oral chemotherapy adherence in program participants.25 In this innovative pharmacy practice model, an ambulatory care oncology clinical
pharmacist practitioner (CPP) works collaboratively with the healthcare team (including prescribing physician and specialty pharmacy) through a collaborative practice agreement (CPA) protocol to offer mediation therapy management (MTM) services throughout the treatment period (Figure 3). These services included medication access assistance, initial and continued education and counseling, side effect monitoring and management, refill outreach, etc. The clinical pharmacist developed protocol with the attending physician to allow for increased pharmacist follow-up at each clinic visit, enabling MTM services to have a greater impact on patient outcomes. Adherence was estimated using the medication possession ratio (MPR), which was calculated by the sum of days supply divided by the total number of days in the period.
The goal MPR was greater than 90% as these patients had chronic myeloid leukemia (CML) and in this patient population an MPR of less than or equal to 90% was associated with vastly reduced outcomes. The mean MPR was found to be 0.92, which was above the established adherence threshold.25 Additionally,
current survey results were compared with an historical survey control. This comparison identified an improvement in self-reported adherence as less patients admitted to reducing their oral chemotherapy dose without first consulting their doctor and more patients reported that dose reductions were indeed at the direction of the physician.
This is an oncology clinic structure that lacks financial evidence in the literature. However, the clinical outcomes illustrate the impact that pharmacy services have when integrated into daily clinic structure with routine, scheduled touch points between clinical pharmacists and patients. Future research should focus on quantifying financial impact in order to expand MTM billing
and independent prescribing protocols. pharmacist (PharmD) and clinical support staff Figure 3. Overview of services offered by
Muller - page 9
Oncology Financial Assistance Programs
Financial toxicity is among the many outcomes that result from the use of chemotherapeutic agents in the US. Unfortunately, the costs of these drugs have experienced an exponential increase over the past half a century, and with the introduction of oral formulations, traditional payment structures are no longer effective.28,29 The high
prices of orally available cancer drugs coupled with increasing out-of-pocket costs for patients through higher deductibles and co-insurance have made it difficult for patients to afford these life-saving medications.
In an effort to improve access to care, pharmaceutical companies have developed financial assistance programs, either directly or through affiliated non-profit pharmaceutical foundations. These programs offer copay coupons, copay assistance, pricing discounts and direct grants to patients. Manufacturers also offer in-kind gifts of drug supplies free of charge to patients with proven financial need through initiatives called Pharmaceutical Assistance Programs (PAP).
In order to quantify and characterize the number and monetary value of drugs received through PAPs, Mitchell et al. studied cancer patients treated at an academic, state-supported, public hospital network.30 This
study found that of the 215 patients utilizing
PAP services at the study hospital, even privately insured patients participated in these PAP programs, as 14% of patients receiving free drugs were insured, 46% had public coverage, and 40% were uninsured. It was also identified that 40% of the retail value of drugs obtained via PAP at this health system was attributable to imatinib and dasatinib, both of which are orally administered chemotherapy, and 75% came from oral chemotherapeutics as a class (Table 2). This study provides evidence that as oral chemotherapy prices continue to rise while also making up a larger proportion of pharmacy expenditure, less patients, including those with insurance, are able to afford them. These patients are forced to find ways to gain access to care—PAP being one such avenue.
PAPs are known for being relatively opaque regarding eligibility and benefits. Zullig et al. conducted a study to identify the degree of financial assistance provided by PAPs.31 This retrospective study used
data from an academic cancer center’s specialty pharmacy to determine prescription chemotherapeutic costs and PAP coverage. Study authors identified that 12% of all oncology prescription claims were eligible for PAP from 2013 to 2015. Of these 8,212 prescriptions that received PAP assistance, the median amount of financial
assistance provided by PAPs was 15% of the median prescription cash price. Explained another way (Table 3), 98% of drugs covered under PAPs received less than 25% coverage through the PAP program. A small minority of prescriptions received financial assistance from PAPs, and the proportion of financial assistance receives was small relative to the price billed to insurance. This study illustrates the modest role that PAPs play in reducing anticancer prescription-related costs.
Many cancer institutions have dedicated personnel that guide patients through aspects of care, including financial concerns. These “oncology navigators” assist patients with PAP applications and coordinate monthly prescription fulfillment for PAP patients. Spencer et al. conducted a study to assess these navigators’ perception of their patients’ financial burden and their role in addressing financial needs.32 A total of 78 navigators responded
to the survey, reporting that 75% of their patients experienced some degree of financial toxicity related to their cancer. Of the 78 responders, 12% reported that 100% of their patients experience cancer-related financial toxicity and 45% indicated that most of their patients are able to get some type of financial assistance. Navigators reported obstacles to obtaining financial assistance including insufficient resources or patient ineligibility for existing resources, lack of patient and provider knowledge and awareness about existing financial assistance programs, and application complexity requiring unnecessary or duplicative effort. These obstacles highlight the need for system improvements that increase patient and provider communication about financial needs in order to properly identify patients experiencing financial toxicity. These improvements should be combined with increased numbers of oncology navigators and other trained staff to connect patients with financial distress to existing resources.
Uninsured Public Private
40% 46% 14%
Total PO Imatinib Dasatinib
$7,373,741 $1,556,575 $1,449,633
Total PO + non-PO $9,798,632
Table 2. Results of the Mitchell et al. study.30
PAP Coverage
(% Rx $) n %
0% 7261 89%
0-25% 806 9%
25%-50% 118 2%
Muller - page 10 RESULTS
PHASE II: QUALITATIVE PAYER INTERVIEWS
In-depth, semi-structured interviews were used to validate the importance of implementing population health strategies (discussed above) in the clinic as a bottom-up approach to reducing total cost of care. More interestingly, these interviews uncovered payers’ opinions regarding current issues and hot topics in the US healthcare system. Transcript coding and data abstraction resulted in payer responses related to the following five cost-saving mechanisms: (1) traditional managed care strategies, (2) CMS policies and programs, (3) value-based contracting, (4) pharmacy benefit design, and (5) future cost savings measures under development. The remainder of this manuscript discusses a description of each of these categories, incorporating payer opinions throughout.
Traditional Managed Care Strategies are Effective
Public, private & self-funded payers as well as pharmacy benefits managers utilize Drug Utilization Review (DUR) programs to check each member’s prescription at the point of sale to identify potential problems with the prescription before it is filled. If an issue is identified during the claim adjudication process, an edit (e.g. rejection message) is sent to the dispensing pharmacist to notify them of the issue before the patient receives the medication. There are two types of concurrent DUR edits: soft & hard. Soft edit rejections can be overridden by the pharmacy. Hard edit rejections cannot be overridden by the pharmacy and require a prior authorization from the plan. These hard edits stop the adjudication of the claim until the payer has signed off to actually pay for the medication.
“[Hard edits] absolutely work with specialty drugs. If you want me to pay $300,000 per year for your medication, I have the right to see that it is actually being utilized appropriately.
– Self-funded payer
Prior authorization, step therapy & quantity limits are examples of hard edits. These DUR tools, along with a variety of other tried-and-true managed care strategies (below) remain effective in today’s payer world. The majority of these started with public payers (CMS) and were later adopted by commercial and self-funded plans.
• Prior authorization (PA) – Before a plan will cover a particular specialty drug, the member’s prescriber must first show that the patient has a medically necessary need for that particular drug and have met the PA requirements for the drug.
• Step therapy – This is a type of PA in which the plan requires the patient to try a less expensive drug on the plan’s drug list (formulary) that has been proven an effective treatment for the condition prior to moving up a “step” to a more expensive drug. Usually step therapy edits are utilized to drive prescribing habits towards generic alternatives and away from high-cost branded/specialty drugs.
• Quantity limits – For safety and cost reasons, a plan may limit the monthly quantity of drug that can be dispensed. If a patient requires 60 tablets per month of a drug with a quantity limit of 30 tablets per month, their prescriber will need to communicate with the plan to get authorization for a higher quantity. This tool is utilized to reduce unnecessary or superfluous prescribing.
• Split fill programs – This tool is utilized for specialty medications that are known to be poorly tolerated. Payers design the PA with a quantity limit of enough days supply to ascertain whether the patient can tolerate the medication or not (e.g. 1 week). This decreases costs and minimizes wasted drug supply. • Preferred drug list (PDL) – A list of medications that the plan will cover the cost for without the prescriber
having to request a PA. Typically these lists are comprised on generic substitutes or branded products for which the plan negotiated a cost-effective price with the pharmaceutical company. The PDL limits the drugs that may be prescribed, especially with our CMS patients. Public payers report that the public perception of specialty drugs on the PDL is that manufacturers are giving state-funded plans a great price for an otherwise exorbitantly priced drug; however, this is usually not the case. This false perception often increases utilization of expensive drugs, ultimately negatively impacting our public health plans.
Muller - page 11
value for the plan in terms of safety, efficacy and cost. Payers include manufacturer rebates into this cost-effectiveness analysis; however, policy changes are currently on Capitol Hill that could disrupt this analysis. Most private payers have multiple formularies that vary in quantity of PAs & step edits, premiums & co-insurance, etc.
• Premium, deductible, copay, co-insurance, out-of-pocket maximum – These tools are utilized in pharmacy benefit design to help distribute healthcare costs across the entire health plan. In theory, this creates a risk pool that is averse to high-cost claims submitted by a small minority of patients utilizing specialty drugs and should help shield this minority from catastrophic expenses. However, in practice, as specialty drug prices skyrocket this minority is stuck with exponentially increasing co-insurance fees. • Tiering – A pharmacy benefit design that financially rewards patients for using generic and preferred
drugs by requiring the patient to pay progressively higher copayments for preferred non-preferred and brand name drugs. Specialty medications generally fall in Tier 4 or 5, higher tiers that also include drugs that are injected or infused, have unique storage or shipment requirements, are enrolled in REMS programs, or are not stocked at retail pharmacies.
• Distribution channel – Most specialty medications are distributed through a limited channel of specialty pharmacies (SPs) selected by the manufacturer for their high-quality medication adherence tracking, patient follow-up, patient education programs, financial assistance programs, etc. As we move towards a value-based healthcare system, higher quality care across the entire patient journey is crucial. Integrated delivery networks and large health systems are now getting a piece of the pie by contracting with manufacturers to distribute specialty medications through their own in-house SPs.
Payers of all plan types agree that these traditional managed care strategies are essential with the caveat that innovative solutions are desperately needed to better control specialty drug expenditure as prices skyrocket.
Centers for Medicare & Medicaid Services (CMS) Policies & Programs Stifle Pricing Negotiations
The federal government signed Medicare and Medicaid into law in 1965, and for 50 years these programs have been protecting the health and wellbeing of Americans. As healthcare evolves and therapeutic advancements are made in the form of specialty medications, payers deem some of the CMS policies and programs to be antiquated and unfit for the growing market.
The Medicaid Drug Rebate Program is an agreement between CMS and participating drug manufacturers to help offset the Federal and state costs of most outpatient drugs dispensed to Medicaid patients. In exchange for offering predetermined drug rebates on a quarterly basis, drug manufacturers are given access to Medicaid formularies and PDLs. When manufacturers sign this agreement, state Medicaid plans must cover most of the manufacturer’s drugs, stipulations withheld. Public payers say that this program minimizes the levers they can pull to manage the impact of drug expenditures. Medicaid plans are not given the option to negotiate pricing and are instead forced to cover drugs with a rebate determined by Federal statutory formulas. (For innovator drugs, the rebate is defined as 23.1% of the Average Manufacturer Price.) Public payers also state that this program is not compatible with the Affordable Care Act (ACA) Medicaid Expansion. As Medicaid membership expanded by approximately 15 to 20 million, manufacturers were required to offer these rebates to a larger proportion of covered lives. Public payers describe this as a loss that deters brand product manufacturers from lowering drug prices. As a result, in recent years Massachusetts embarked on a policy change to address the issues with the rebate program. The state Medicaid plan submitted an amendment to establish a closed formulary, giving them the look and feel of a commercial plan with the power to negotiate rebates. However, the federal government shut this movement down.
“Regarding Hepatits C drugs – due to CMS policies and programs, we really only had 2 options to mitigate financial impact to our budget: PDL and rebates that were are not legally allowed to negotiate.”
– Public Payer
Muller - page 12
costs and can stifle innovative payment models outside of Medicaid, ultimately leaving consumers worse off. Self-funded and commercial payers agree that the best price law deters experimentation with value-based contracting because if manufacturers offer them a money-back guarantee based on outcomes, the manufacturers would also have to agree to give away drug free of charge to every state Medicaid program. It is the payer’s opinion that drug manufacturers are unwilling to do this (for obvious reasons); therefore, discouraging innovative, outcomes-based payment models.
“The best price rule deters manufacturers from wanting to engage in value-based contracts with us.” – Private Payer
Payers Perceive Many Road Blocks with Value-Based Contracting
Value-based care (VBC) is a shift in our healthcare system towards a model that rewards physicians for coordinating care in such a way that is achieves specific clinical outcomes. In this model, providers’ compensation is based in part on keeping a population healthy, not just on the quantity of labs or procedures they order. The pharmaceutical industry would love to partake in this evolving model, especially with high-cost specialty medications; however, as previously described, outdated CMS programs and policies deter such actions.
This is a complex reimbursement model that would require careful management by physicians and close follow-up by payers and manufacturers to confirm the occurrence of pre-specified clinical endpoints as described in every VBC contract. Multiple payers used the example of high-cost PCSK-9 inhibitors for the treatment of primary hyperlipidemia, describing that in a VBC contract for evolocumab or alirocumab, the manufacturer would agree to rebate an additional 5% on top of the contractually agreed upon standard rebate if the patient does not reach target LDL goals as defined in the contract. However, the agreement is not that simple because the contract would include a clause stating that the patient must follow contractually agreed upon treatment protocol (e.g. maintain adherence to the intervention and must also be concomitantly prescribed a high-intensity statin that does not interact with the selected PCSK9 inhibitor). If the patient is found to be non-adherent or improperly following the treatment standards, the manufacturer would no longer pay the additional 5% rebate to the payer.
Payers agree that, in addition to regulatory issues, many hurdles exist along the path towards value-based contracting for specialty medications. Some examples are as follows:
• Resource intensive for all parties – The VBC reimbursement model demands a large amount of resources from both the payer and manufacturer to monitor patient adherence & track clinical endpoints. • Data management & health privacy issues – Payers agree that they would be skeptical to allow manufacturers to collect and analyze outcomes data, and vice versa. Neither party would be able to hand off data to each other due to laws that protect health information. Payers agree that a third-party data aggregator could be an appropriate middleman to formally evaluate clinical efficacy, but they are unsure as to who would pay the third-party vendor.
• Perceived lack of manufacturer risk based on clinical trials – Payers report that manufacturers are only willing to agree to VBC terms that utilize endpoints as they were defined in the manufacturer’s clinical trials. Payers say that clinical trial outcomes have a statistically significant chance of occurring, and they would rather agree to terms that increase manufacturer risk. Instead of agreeing to outcomes that secured FDA approval, payers would appreciate manufacturers assuming more risk by agreeing to payment terms that improve upon clinical trial data. A private payer suggested that agreeing to incorporate outcomes exactly as they appear in clinical trials is equivalent to health plans supporting additional ongoing clinical studies while the manufacturer follows patients to publish more real-world evidence supporting the use of their drug.
Muller - page 13
• Beneficiary retention fluctuates based on eligibility changes – Beneficiaries switch between health plans as their eligibility changes. If a commercial beneficiary loses his job and joins the state’s Medicaid plan, would Medicaid be stuck with paying the remainder of a specialty drug claim accrued under the commercial plan with an annuity payment reimbursement design? For example, if at the time of the beneficiary’s switch to Medicaid the commercial plan had paid 50% of a $1 million claim for Luxterna, which party would pay the remaining 50%? The commercial plan would not want to pay for a drug that benefits a patient that is no longer in their risk pool, and Medicaid would not want to pay for a claim that they were not involved in accruing.
“There’s a lack of trust – I don’t trust pharma to manage the data & pharma doesn’t trust me to do it.” – Private Payer
“We aren’t in the business of financing or layaway, so annuity payments don’t make sense to us.” – Public Payer
“[Manufacturers] are making a bet that they have a statistically significant chance of winning, as they proved in [their] clinical trials.”
– Private Payer
Implementation of Innovative Pharmacy Benefit Design Is Necessary as Drug Prices Soar
As previously mentioned, traditional pharmacy benefit design using tried and true managed care principles is still considered an effective tool. However, just like some Federal drug pricing regulations, these principles could benefit from an innovative and creative update in order to more appropriately manage specialty drug prices. Payers provided the following examples as methods they are using to re-work traditional pharmacy benefit design in a manner that is mutually beneficial for the consumer and the health plan.
Traditionally, when a commercial patient uses a copay card the manufacturer’s payment counts towards the patient’s deductible and annual out-of-pocket maximum (MOOP). After the annual limit is reached, the plan pays for 100% of prescription drug costs. However, plans are evolving to utilize two alternative approaches to adjust how they engage with manufacturer’s copay offset programs.
• Copay accumulator program – The commercial health plan does not let the manufacturer’s payments count towards the patient’s deductible and annual MOOP obligations. Instead, these payments cover the cost of each prescription until the maximum value of the copay offset program is reached. For example, a manufacturer offers a copay card that reduces the patient’s copay to $5 at point-of-sale (with a total value of $1200 on the card) for a drug that costs $200 per month. The copay card will cover 100% of the drug cost for six months, costing the patient $30 total. However, in this program the card’s $1200 does not contribute to the patient’s deductible and MOOP; therefore, after the copay card is fully depleted at month six the patient is stuck funding 100% of the bill ($200 per month) until they fulfill their deductible and MOOP, at which point the plan steps in to cover 100% of prescription drug costs. This type of program assists patients for the first few months, while the copay card maintains a balance. But after the total value is depleted, the patient is likely unable to afford the medication.
• Copay maximizer program (also known as variable copay program) – Similar to the accumulator program, the manufacturer’s payments do not count towards the patient’s deductible or annual OOP obligations. However, instead of utilizing the copay card’s total value within the first 6 months, the plan distributes the maximum value of the manufacturer’s copayment program evenly throughout the benefit year. In the case of the example above, the plan would let the copay card contribute $100 per month for the 12-month benefit period, leaving the patient with a $5 copay for the entire year in addition to 100% of the monthly remainder ($100) until the deductible and MOOP are met, at which point the plan steps in to cover 100% of the prescription drug costs, respectively.
Muller - page 14
interests are more closely met with the maximizer model.
Health plans also endorse other innovative pharmacy benefit design techniques, including:
• “Lifestyle drugs” coverage carve out – One self-funded payer has decided to exclude an ever-expanding list of “lifestyle drugs” from contributing to a patient’s MOOP. Simply put, the pharmacy benefit has coded drugs for conditions like erectile dysfunction and infertility so that members pay 100% co-insurance. The payer explained this decision, saying that the health plan’s premium should not be increased for a very finite number of people’s elective drug utilization.
o E.g. ED, infertility
• Drug-specific coverage carve out – The same self-funded payer also heavily relies on efficacy data to exclude coverage for certain drugs that it deems ineffective or not clinically impactful. Tamiflu is one such example that the payer provided. Ultimately, if prescribed properly, Tamiflu shortens flu symptoms by 12-24 hours at the end of the infection. Furthermore, it is only effective if prescribed in the first 48 hours after onset of symptoms. Many patients wait until day four or five to seek medical attention, at which point the physician has missed the window of opportunity. However, most prescribers in the emergency department will still prescribe Tamiflu regardless of symptom onset, simply to appease the patient in front of them by providing them with a prescription in exchange for the hours they spent waiting in the emergency department.
• Site-of-care billing determination for costeffectiveness – One PBM explained that they put a block in place to require a PA for specific medications to allow the claim adjudicator to determine the most cost effective site-of-care for billing purposes (e.g. medical vs pharmacy). The PBM is able to decide whether it is cheaper to bill the provider or the pharmacy benefit, therefore reducing the cost of the medication.
“We don’t want our members to be disadvantaged and stuck with a high deductible and OOP maximum while we benefit from the manufacturer’s copay card.”
– Self-funded Payer
“[Pharma] created the copay card program. I’m just taking advantage of it. They can’t stop me from creating a work around anymore than I can stop them from offering copay cards.
– Private Payer
Future Cost Savings Measures Under Development
Payers of all types expressed excitement for the future of healthcare and the potential impact on improving value while decreasing costs. The programs and advancements listed below were commonly mentioned:
• Genetic testing will play a larger role in drug utilization – As innovative therapies with high price tags come to market, it is crucial that our healthcare players ensure that they are utilizing these therapies appropriately. Biomarkers are increasingly being employed to predict the clinical impact of a medication on an individual patient based on their genetic makeup. Developments in this space are allowing the selection of specialty therapies to be tailored based on presence of genetic mutations. As biomarkers are developed and genetic testing becomes standard practice in specialty utilization, high upfront costs will be rewarded with improved downstream cost-effectiveness by avoiding specialty utilization in patients who are unlikely to respond appropriately. Payers report that as they currently engage with providers, they are aware that they are paying for genetic testing, they are simply unaware of the results due to poor electronic medical interface.
• Improved EMR interface to achieve better outcomes and quality measures – Payers agree: the more information, the better. However, obtaining the information is difficult. One private payer explained that they are currently scrubbing EPIC to gain pertinent information that can help process PAs and allow patients access to medications without having to fill out a form. They are confident that in 2019 payers will begin to receive more robust lab data and by 2020 genetic testing will be commonly communicated between provider to payer, all in an effort to improve outcomes and quality of care.
Muller - page 15
pharmacy substitutions may not be particularly relevant for biologics. Additionally, it is still not clear whether approval of a biosimilar as “interchangeable” for a single indication will automatically afford the biosimilar approval for all indications for the reference product, or if the biosimilar applicant will still have to provide sufficient evidence pertaining to each indication. Furthermore, biosimilar applicants will have to determine whether the investment in additional studies to achieve interchangeable status will provide a better return than investing in patient and physician education and marketing of noninterchangeable biologics. Regardless, if self-administered biosimilars with interchangeable status enter the market, outpatient pharmacies may gain the authority to substitute less costly products for high-priced innovator biologics, effectively reducing total cost of care.
• Leverage 340B pricing with patient incentives – Health systems and PBMs agree that disproportionate share hospitals with in-house outpatient pharmacies are situated to appreciate large cost savings. These hospitals are 340B eligible, meaning a large proportion of their patients are Medicaid and low-income Medicare patients, and they can purchase drugs at a reduced price. Regulatory requirements state that this cost savings must be reinvested back into the hospital to improve quality of care for this disproportionate share patient population. Some health systems have taken advantage of this cost savings in a legal manner by creating programs that enroll their publicly funded patients and encourage them to seek care from 340B eligible providers in an effort to capture close to 100% of their prescriptions at in-house 340B eligible pharmacies. As lawmakers discuss concerns regarding hospital compliance with the Federal 340B Drug Pricing Program, payers alike are unsure if this program will remain as effective in reducing drug costs as it currently is.
LIMITATIONS
In the broad context of the history of the pharmaceutical industry as a whole, exorbitantly high-priced drugs are a newly introduced and growing concern. Although there are several specific examples of successful managed care strategies implemented to manage the cost of these drugs, this field of study is fairly new. Many of these cost containment strategies are in their infancy and thus a proper assessment of financial and clinical outcomes is yet to be seen. The qualitative semi-structured interview portion of this study was developed to address this limitation, with the hopes of uncovering information that has not yet been published but that is still pertinent to suggesting future drug cost-containment policies. Biologics and biosimilars are large players in the high-cost drug landscape, and as more biosimilars are brought to market it will be interesting to see how they are regulated and what impact they may have on managed care decision-making.
The second phase of this research project was dependent upon data collected through in-depth interviews, and thus, a potential pitfall to consider is bias. The interviewer or interviewee might want to “prove” that an innovative cost-containment strategy is working, causing responses to be biased. Responses from stakeholders may also be biased due to their stake in the program of discussion. Every effort was made to minimize bias during each interview by creating an interview guide with pre-specified interview protocol and assembling a variety of interviewees to get broad perspective.
Clinical and cost-effectiveness research (e.g. ICER) has recently been the center of discussions aimed at improving the relevance and consistency of outcomes in comparative effectiveness research. In 2016, the Institute for Clinical and Economic Review (ICER) opened its value framework to public comment as part of a planned update to ICER’s methods.13 Changes have been proposed and ICER is currently working to respond
Muller - page 16 CONCLUSIONS
As the price of specialty drugs continue to increase, providers will gradually be forced to implement managed care clinical programs to effectively and efficiently contain drug costs in order to get the most out of value-based reimbursements. The policies suggested from this study’s findings are applicable to these physicians and associated managed care organizations, ultimately helping to accomplish the Triple Aim (improving the quality of care, lowering overall healthcare costs, improving the patient experience), specifically lowering the per member per month cost of care. From the patient’s perspective, drug costs are consuming a larger proportion of their monthly budgets and, for some, have reached a point that is not sustainable, forcing them to forego care. Therefore, new pharmacy practice models and system level managed care strategies must be implemented that incorporate innovative cost-containment mechanisms. This study identifies four innovative managed care clinical programs and additional cost-saving mechanisms that can be used to suggest future drug pricing policy initiatives to lower total cost of care while improving patient’s access, adherence and overall health outcomes.
Task shifting is a safe, effective, convenient & cost-effective, decentralized DAA-based treatment model for patients with HCV in medically underserved areas. Although no HCV task-shifting studies were found that incorporated pharmacists in the care of HCV patients through the duration of their treatment, authors of this study agree that the skills of this healthcare professional could be leveraged to improve outcomes and decrease costs. Furthermore, task-shifting is a model that has previously been shown to be effective in the management of patients with HIV/AIDS. North Carolina is a state that provides another example of utilizing task-shifting to allow pharmacists to practice at the fullest extent of their license. The North Carolina Board of Pharmacy created the Clinical Pharmacist Practitioner (CPP) designation which allows pharmacists to operate under a protocol agreement with a supervising physician to manage specific medical conditions and place orders for specific prescription medications and labs. This fully developed and state-supported task-shifting model gives less costly mid-level providers the autonomy to manage chronic conditions, freeing up physicians to function at the top of their licenses as well. Therefore, the implementation of similar practice models that incorporate task-shifting of traditionally specialist-controlled responsibilities to pharmacists in the management of other chronic diseases which also experience barriers to access would be an interesting field of study to develop future cost-containment managed care solutions.
As evidenced by the University of Massachusetts Medical School’s Clinical Pharmacy Services’ $3.8 million total cost avoidance, comprehensive medication management programs that include both regimen optimization and refill outreach can lead to drastic cost savings while also ensuring that members have access to the most clinically appropriate regimen. Utilizing evidence-based guidelines to create detailed PA criteria allows clinicians to easily and systematically identify high-risk patients towards whom targeted interventions can have the greatest impact—an impact felt by payers, providers and patients. Many high-cost specialty drugs can benefit from the development of disease-state specific comprehensive management programs that ensure optimal use of therapy in indicated patient populations. Managed care organizations and health plans should allocate resources to identifying specialty medication / disease state combinations that would realize the highest cost-savings from consensus guideline-directed systematized regimen optimization and refill outreach programming.
Oral chemotherapy programs incorporating CPAs with MTM services have been proven to improve adherence and overall patient outcomes. Integrated pharmacy services provided by an oncology pharmacist in collaboration with physicians and specialty pharmacies enhance the role of a pharmacist in patient education and across the total continuum of care. This is yet another managed care strategy that can be layered on top of an existing clinic structure, ultimately reducing total cost of care. Further research should be conducted in this space to provide prospective reporting and assessment of the clinical and financial impact that these services have on patient care.
Muller - page 17
follow-up by navigators or trained staff throughout the care process, can more effectively and efficiently identify these patients and connect them with existing resources.
Balancing access and affordability in the specialty arena is a complex and multi-factorial endeavor that necessitate novel cost-containment strategies, as evidenced by discussions with payers. Public policies can provide direct support to these novel strategies in ways that affect the drivers of health by reducing barriers, creating opportunities or providing incentives to payers and manufacturers. Policy suggestions based on payer insights include the following:
• If Medicare and Medicaid plans were allowed to negotiate drug prices with manufacturers and maintain closed formularies like their commercial & global counterparts, US drug prices would certainly decline. • The Medicaid best price rule creates significant disincentive for manufacturers to offer outcomes-based
pricing schemes and requires an act of Congress to exclude value-based contracting from this policy. If value-based contracting were excluded from this outdated policy, manufacturers and payers alike would have adequate incentive to dedicate resources to progressing this cause.
• As value-based contracting progresses, payer & manufacturer consensus regarding endpoints will be based on per drug negotiations and will require equal assumption of risk from both parties. Policy should drive experimentation in this space to encourage mutually beneficial negotiations between payers and manufacturers.
• Third-party data aggregation and fluctuation of beneficiary retention are large issues that discourage VBC & need to be addressed with policy changes.
• One potential solution to payer’s disapproval of VBC annuity payment reimbursement design would be to allow Medicaid plans to pay 100% of upfront costs and leave the manufacturer on the hook to reimburse the state’s portion (35%) while keeping the Federal portion (65%) if clinical endpoints are not met.
• Payers should be allowed to engage with manufacturers copay cards; however, the financial result must be in the best interest of the patient. Policy to address copay accumulator programs and encourage copay maximizer programs would aid in this journey.
• National analyses should be conducted to identify site-of-care billing determination for cost-effectiveness across the board with specialty medications. The disparity between the two costs for a single drug warrant further research.
• As technology advances, policy should reflect the increased need for protected health information and encourage payers and manufacturers to share this information in a secure manner to facilitate VBC and improved quality of care.
• Biomarkers are an essential component of driving appropriate specialty drug utilization. Policy should reflect this trend and encourage payers and prescribers to support genetic testing as a necessary expense before selecting a specialty medication.
• Generic competition is an effective method of containing costs. In the specialty arena, biosimilars have yet to see an equally effective impact on the cost of innovator biologics. Policy changes are occurring to address this issue and encourage pursuit of interchangeable status. However, the response is slow and greater incentives may be necessary to bring manufacturers on board.
Muller REFERENCES
1. Observations on Trends in Prescription Drug Spending. Department of Health and Human Services, Office of the Assistant Secretary for Planning and Evaluation.
https://aspe.hhs.gov/pdf-report/observations-trends-prescription-drug-spending. Published March 8, 2016. Accessed January 28, 2017. 2. Kesselheim A, Avorn J, Sarpatwari A. The High
Cost of Prescription Drugs in the United States: Origins and Prospects for Reform. JAMA. 2016;316(8):858-871. doi:
10.1001/jama.2016.11237
3. Organisation for Economic Co-operation and Development. Health at a Glance 2015: OECD Indicators. Paris, France: OECD Publishing; 2015.
4. Langreth R, Migliozzi B, Gokhale K. The US pays a lot more for top drugs than other countries. Bloomberg Business.
http://www.bloomberg.com/graphics/2015-drug-prices/. Published December 18, 2015.
Accessed January 28, 2017.
5. Kanavos P, Ferrario A, Vandoros S, Anderson GF. Higher US branded drug prices and spending compared to other countries may stem partly from quick uptake of new drugs. Health Aff (Millwood). 2013;32(4):753-761.12. Shrank WH, Hoang
6. Food and Drug Administration. Generic competition and drug prices.
http://www.fda.gov/AboutFDA/CentersOffices/O fficeofMedicalProductsandTobacco/CDER/ucm 129385.htm. Updated May 13, 2015. Accessed January 28, 2017.
7. Federal Trade Commission. Pay-for-delay: how drug company pay-offs cost consumers billions. https://www.ftc.gov/sites/default/files/documents /reports/pay-delay-how-drug-company-pay-offs-
cost-consumers-billions-federal-trade-
commission-staff-study/100112payfordelayrpt.pdf. Published January 2010. Accessed January 28, 2017. 8. Shrank WH, Liberman JN, Fischer MA, et al.
The consequences of requesting “dispense as written.” Am J Med. 2011;124(4):309-317. 9. Medicare Prescription Drug Benefit Manual:
Chapter 6 – Part D Drugs and Formulary Requirements. Centers for Medicare and Medicaid Services.
https://www.cms.gov/Medicare/Prescription-Drug-Coverage/PrescriptionDrugCovContra/ Downloads/Part-D-Benefits-Manual-Chapter-6.pdf. Published January 15, 2016. Accessed January 28, 2017.
10. Drug Utilization Review Program. Medicaid.gov. https://www.medicaid.gov/medicaid/prescription -drugs/drug-utilization-review/index.html. Published August 31, 2016. Accessed January 28, 2017.
11. Cost Containment Strategies For Prescription Drugs: Assessing The Evidence In The Literature. Kaiser Family Foundation. http://www.puppem.com/Documents/Cost- Containment-Strategies-for-precription-Drugs- Assessing-The-Evidence-in-the-Literature-Report.pdf. Published March 2005. Accessed January 28, 2017.
12. Menges Group. Analysis of Medicaid costs and usage of selected specialty medications— Sovaldi, Harvoni, and Kalydeco.
https://www.themengesgroup.com/presentation/ april_2015_medicaid_data_on_sovaldi__ harvoni_and_kalydeco.pdf. Published April 2015. Accessed January 28, 2017.
13. Overview of the ICER value framework and proposals for an update for 2017-2018. ICER Institute for Clinical and Economic Review.
http://icer-review.org/wp- content/uploads/2016/02/ICER-VAF-Update-Proposals-020117.pdf. Published February 1, 2017. Accessed February 14, 2017.
14. Tunis SR, Clarke M, Gorst SL. Improving the relevance and consistency of outcomes in comparative effectiveness research. J Comp Eff Res. 2016 Mar;5(2):193-205. doi: 10.2217/cer-2015-0007
15. Trump Calls Drug Pricing ‘Astronomical’ and Promises Change. Bloomberg Politics. Published January 31, 2017. Accessed February 8, 2017.
16. Hepatitis C by the Numbers: Facts, Stats and You. Center for Disease Control and Prevention website. Published July 28, 2014. Accessed January 2, 2018.
( https://www.healthline.com/health/hepatitis-c/facts-statistics-infographic#4)
17. Yehia BR, Schranz AJ, Umscheid CA, Lo Re V 3rd. The treatment cascade for chronic hepatitis C virus infection in the United States: a
systematic review and meta-analysis. PLoS One 2014;9:e101554. doi:
10.1371/journal.pone.0101554.
18. Trooskin S, et al. Access to Costly New Hepatitis C Drugs: Medicine, Money, and Advocacy.
Muller
10.1007/s10620-015-3911-6
20. Jayasekera CR, Beckerman R, SmithN, Perumpail RB, Wong RJ, YounossiZM, et al. Sofosbuvir-basedregimens with task shifting is cost-effective in expandinghepatitis C
treatment access in the United States. J Clin TranslHepatol 2017;5(1):16–22. doi:
10.14218/JCTH.2016.00052.
21. Chhatwal J, Kanwal F, Roberts MS, Dunn MA. Cost-effectiveness and budget impact of hepatitis C virus treatment with sofosbuvir and ledipasvir in the United States. Ann Intern Med. 2015;162(6):397-406. Available at:
https://www.ncbi.nlm.nih.gov/pmc/articles/PMC 4435698/. Accessed September 3, 2016. 22. Lavitas P, Tesell M, Hydery T, et al. Overview
of Comprehensive Hepatitis C Virus Medication Management in a State Medicaid Program. J Manag Care Spec Pharm. 2016;22(10):1161-66.
23. Bedell CH. A changing paradigm for cancer treatment: the advent of new oral chemotherapy agents. Clin J Oncol Nurs 2003; 7: 5–9.
24. Muluneh B, Deal A, Alexander M, et al. Patient perspectives on the barriers associated with medication adherence to oral chemotherapy. J Oncol Pharm Practice 2016; 0(0) 1-12.
25. Morgan K, Muluneh B, Deal A, Amerine L. Impact of integrated oral chemotherapy program on outpatient adherence. J Oncol Pharm Practice 2017; 0(0) 1-5.
26. Holle L, Harris C, Chan A, et al. Pharmacists’
roles in oncology pharmacy services: Results of a global survey. J Oncol Pharm Practice 2017; 23(3) 185-194.
27. Leu L, Espirito J, Spadoni V, et al. Scope of hematology/oncology pharmacy practice. 28. Bach P. Monthly and median costs of cancer
drugs at the time of FDA approval 1965–2015. MSKCC Center for Health Policy and
Outcomes, 2015. Available at:
www.mskcc.org/research-areas/programs-centers/health-policyoutcomes/cost-drugs. 29. Claxton G, et al. Health benefits in 2015: stable
trends in the employer market. Health Aff Proj Hope 2015; 34:1779–1788.
30. Mitchell A, Muluneh B, Patel R, et al. Pharmaceutical assistance. programs for cancer patients in the era of orally administered chemotherapeutics. J Oncol Pharm Practice 2017; 0(0) 1-9.
31. Zullig L, Wolf S, Vlastelica L, et al. The Role of Patient Financial Assistance Programs in Reducing Costs for Cancer Patients. J Manag Care Spec Pharm. 2017;23(4):407-11.
Muller – Report Addendum REPORT ADDENDUM
ACKNOWLEDGEMENTS
The author(s) would like to acknowledge Stacie Dusetzina and Benyam Muluneh for participating in discussions and providing scientific/clinical guidance.
FUNDING
The author(s) received no financial support for the research, authorship, and/or publication of this article.
CONFLICTS OF INTEREST
Muller – Report Addendum SUPPLEMENTAL MATERIAL
Table 6. The Kaiser Family Foundation published this exhaustive list of cost-containment strategies in 2005. The aim of this study is to evaluate these approaches and uncover new innovative strategies that better address the changing environment of drug prices.
Utilization Management Approaches Cost Charing Approaches
Prior authorization requirements Copayments as a general strategy
Step therapy or fail-first requirements Tiered copayments in general Therapeutic substitution or therapeutic intervention Three-tiered copayments
Closed formulary Four-tiered/more complex copayment structures
Preferred drug list or open formulary Coinsurance
Mandatory generic substitution Reference pricing
Management of specialty drugs Provider financial incentives
Payments to pharmacies as incentives Other coverage management approaches
General Utilization Review Strategies Education Strategies
Retrospective drug utilization review Physician profiling
Drug utilization review targeted to high-cost users Disease management
Education of consumers and physicians on the benefits of generic drugs
Education of consmers and physicians on the appropriate use of particular drugs
Counter detailing or academic detailing Development of unbiased information on the appropriate use of certain drugs
Utilization Strategies A variety of market based approaches intended to affect which and how many drugs patients use. These strategies range from direct limits (excluding specific drugs from formulary, limiting the quantity covered) to rules on utilization
(formularies, preferred drug lists, prior auth, step therapy), to methods to influence how much the patient pays (tiered copayments, reference pricing).
Pricing Approaches Available to All Payers Lower Transaction Costs
Use of purchasing pools Incentives for inc use of mail-order pharmacies
Higher rebates through market leverage Mandatory mail order for maintenance meds
Requirements to make prices and rebates transparent Lower dispensing fees to the pharmacy
Use of restricted pharmacy networks Use of discount cards
Defined contribution approaches
Pricing Strategies Market-based
approaches intended to reduce the price of drugs, including restricted pharmacy networks, use of mail-order pharmacy and manufacturer rebates.
Pricing Approaches Direct Regulatory Approaches
Expanded access to Medicaid rebates or changes to the rebate formula
Broader availability of generic drugs through changing patent protection laws
Direct price regulation Broader authority to move drugs to OTC status Expanded access to the federal supply schedule Increased regulations of direct-to-consumer
advertising
Reduced restrictions on importation of drugs from other countries
Regulatory Strategies Available Only to Government Ways of using gov't