By Steve Surges
Honors Thesis Classics Department
University of North Carolina at Chapel Hill 12 April 2013
Prof. Richard Talbert
Contents
List of Figures iii
Acknowledgements v
Introduction 1
Chapter I: Recent Cartographic Projects 8
A) Two-Dimensional Reference Maps 8 B) Two-Dimensional Reconstructions of the Ancient City 9 C) Three-Dimensional Reconstructions of the Ancient City 10
D) Conclusion 16
Chapter II: Making the Model 17
A) LiDAR Data 17
B) Ancient Elevation Data 20
C) Topographical Information 23
D) Design 25
E) The Completed Model 25
Chapter III: Archaic Floods and the First Roman
Flood Control 30
A) The Problem of Early Inundations 30 B) The Battle against the Tiber Begins 43
C) Conclusion 55
Appendix I: Map A Elevation Sources 57
Appendix II: Map B Elevation Sources 73
Appendix III: Source Information for the Cultural
Features of Map B 77
A) Archaeological and Geological Sources 80
B) Reference Works 83
C) Ancient Authors 83
D) Historical Scholarship 84
E) Related Mapping Projects 84
Figures
1. Photograph of Giuseppe Marcelliani’s terracotta model of ancient Rome 2 2. Poster reproduction of Italo Gismondi’s Plastico di Roma Antica 3 3. View looking west toward the Flavian Amphitheater (Rome Reborn) 3
4. The Velabrum in the Eighth Century B.C. (Filippi) 11
5. The DTM at 5 Meters of the City of Rome before Human Activity 12
6. Stratigraphic Section of the Aurelian Wall 15
7. The Geoid-Ellipsoid Relationship 19
8. Map of the post-processing required for the LiDAR data 21
9. A detail of the map of the anthropic and alluvial fill at Rome 22
10. Map A: The Capitoline/Palatine Area, 1000 to 750 B.C. 26
11. Map A: View from the Palatine west toward the Tiber 27
12. Map A: View from the Capitoline east towards the Forum basin 27
13. Map A: View from the Tiber up the Velabrum toward the Forum basin 27
14. Map B: Central Rome around 600 B.C. 28
15. Map B: View from the Tiber toward the Sant’Omobono sanctuary and the Capitoline 29 16. Map B: View in a bird’s eye perspective, looking down into the Forum from the east 29 17. Map B: View from above the Forum toward the Clivus Capitolinus 29
18. Map A: The Tiber at 5.48 masl 32
19. Map A: The Tiber at 7 masl (Elevated) 35
20. Map A: The Tiber at 10 masl (Ordinary Flood) 35
21. Map A: The Tiber at 13 masl (Extraordinary Flood) 36
23. Map A: The Tiber at 6.5 masl and future sites in the Velabrum and Forum Boarium 37 24. Map A: The Tiber at 9 masl and future sites in the Forum area 38 25. Map A: Water collected in the Forum basin at its greatest height 41
26. Map A: The Tiber at 8.5 masl (Elevated) 44
27. Map B: The Tiber at 8.5 masl (Elevated) 44
28. Map B: The Tiber at 7 masl (Elevated) 45
29. Map B: The Tiber at 10 masl (Ordinary Flood) 45
30. Map B: The Tiber at 13 masl (Extraordinary Flood) 46
31. Map B: The Tiber with its greatest recorded flood waters (Exceptional Flood) 46
32. Photograph of the 1901 flood at 13.2 masl 47
33. Map B: The Forum and Comitium fill 48
34. Boni’s photograph of stratum 26 at his “Equus Domitiani” excavations 51
35. A geological map of central Rome displaying the major outcrops 53
36. View into the Forum and toward the Capitoline from the east 54
37. View from the south slope of the Capitoline toward the Forum 54
38. View from the north slope of the Palatine toward the Forum 55
39. Map A: The four insets with the points found in Appendix I 57
40. Map A: Points Found in Appendix I (1-35) 58
41. Map A: Points Found in Appendix I (36-91) 59
42. Map A: Points Found in Appendix I (92-107) 60
43. Map A: Points Found in Appendix I (108-126) 61
Acknowledgements
Introduction
Ever since the early nineteenth century, scholars have attempted to reconstruct the topography of the ancient city of Rome with more evidence than just ancient textual accounts. Luigi Canina (ca. 1850) and others incorporated data from coins, ruins, written accounts, and the third century marble plan of the city, the forma urbis, in their detailed, two-dimensional maps of Imperial Rome.1 The history of the three-dimensional modeling of Rome begins with one of these plans, a paper map published between 1893 and 1901 by Rodolfo Lanciani and similarly titled the Forma Urbis Romae (1:1,000).2
Lanciani’s unprecedented and archaeologically precise map inspired one of the first
physical models of ancient Rome since Nero built a representation of cities around his lake at the
Domus Aurea and since other Romans included cityscapes in their reliefs.3 In 1906 Giuseppe Marcelliani, a trained sculptor, finished a decorative replica (fig. 1) of Rome with more than two hundred individual terracotta structures.4 His reconstruction represents a crucial innovation in the cartography of Rome because the urban landscape, made more and more clear by the discoveries of the time, appeared not as a bird’s eye view of structural footprints but as a miniature Roman environment. It featured the surfaces and heights of the principal monuments and edifices in the context of the critically important natural contours of the city hills.
Other models of the ancient city, such as Paul Bigot’s models of fourth-century Rome at Caen University and the Musées Royaux d’Art et d’Histoire in Brussels and Henner von
1
Albert J. Ammerman, “Dawn of the eternal city: Archaeologists illuminate the shadowy origins of Rome,” The Sciences 29, no. 4 (1989): 25.
2 Victor P. Tschudi, “Plaster empires: Italo Gismondi’s model of Rome,” Journal of the Society of Architectural Historians 71, no. 3, Special Issue on Architectural Representations 1 (September 2012): 388.
3
“[…] item stagnum maris instar, circumsaeptum aedificiis ad urbium speciem […]” C. Suetonius Tranquillus, Nero, 31.1; “(There was) also a pond in the form of a sea, enclosed with structures to appear as cities.”
4
Figure 1. Photograph of Giuseppe Marcelliani’s terracotta model of ancient Rome, 1905-1906 (Museo della Civiltà Romana). Tschudi, “Plaster empires: Italo Gismondi’s model of Rome,” 388.
Hesberg’s model of Augustan Rome in the Antikenmuseum, Berlin, followed this
precedent.5 None of these, however, would match the renown of Italo Gismondi’s Plastico di Roma Antica (fig. 2), currently displayed at the Museo della Civiltà Romana. Gismondi began building this 1:250 scale plaster replica of the fourth-century city in 1932 as the centerpiece of an exhibition celebrating the bimillenary of Augustus, and the model, accurate for the time, would not be completed until the 1960’s.6 The number of posters of the Plastico sold in Rome’s tourist shops alone attests to the continued popularity of the model even in the twenty-first century. The 2010 digital modeling project, Rome Reborn (fig. 3), even bases its three-dimensional digital elevation model (DEM) of the city on a laser scan of Gismondi’s plaster reconstruction.7 This DEM primarily serves to create hypothetical reconstructions of Rome’s Imperial architecture and
the urban environment. Rome Reborn is today’s digital successor to the earlier plaster or
5
See Paul Bigot, Roma antique au IVe siècle ap. J.-C. (Paris, 1942); and see Henner von Hesberg in Kaiser Augustus und Die Verlorene Republik: Eine Ausstellung im Martin-Gropius-Bau, Berlin, 7. Juni-14. August 1988, (Mainz: P. von Zabern, 1988), 114-115.
6 Tschudi, “Plaster empires: Italo Gismondi’s model of Rome,” 387-390. 7
Figure 2. Poster reproduction of Italo Gismondi’s Plastico di Roma Antica (Museo della Civiltà Romana). Tschudi, “Plaster empires: Italo Gismondi’s model of Rome,” 386.
terracotta models in that it presents the most complete reconstruction of the city in all spatial dimensions and in fact is derived from the Plastico.
Gismondi’s opus demonstrates the value of visualization in three dimensions, but it
certainly does not reflect the most recent archaeological and geological research or even sound judgment. Victor Tschudi’s recent study of the model reveals the complicated Fascist ideology that Mussolini mapped onto ancient Rome and the Plastico’s response to the architectural ideal of the Fascist regime.8 Specific period goals and aesthetics shaped the original organization of the whole project. Beyond this, Gismondi exaggerated the heights of the hills, increasing them by fifteen to twenty percent for visibility, and his chief plaster maker admits that he “infilled” or invented buildings and entire quarters.9 The complications of the Plastico demonstrate why digital renderings based on it lack accuracy and require cautious examination. As Tschudi notes, if digitized, “the plaster city will act as an oddly anachronistic stand-in for digital technology’s endless possibilities and capacity for refinement; […] the Rome model, as an image of the past, is dragged backward into the digital age.”10
In the context of these predecessors, I offer a new computer model created ex novo in order to map part of the physical topography of the city of Rome in three dimensions. Unlike any reconstruction before, this digital terrain model (DTM) represents the Forum valley and the Velabrum of the early city during the time of the first paving of the Forum (650-625 B.C.). It utilizes the accumulation of archaeological data resulting from the studies of the last thirty years which investigated the early Forum Romanum and have offered new interpretations of Rome’s foundation that were once impossible. The recent data revealing this crucial moment in the
8 Tschudi, “Plaster empires: Italo Gismondi’s model of Rome,” 391-394. 9
Ibid., 391; Diane Favro and Christopher Johanson, “Death in motion: Funeral processions in the Roman Forum,” Journal of the Society of Architectural Historians 69, no. 1 (March 2010): 35.
development of the Roman city-state have not been reliably mapped before, and maps of the geomorphology in other eras offer no substitute. Abundant and successive layers of anthropic material and fluvial sedimentation, unique to Rome, render these maps inadequate for this purpose. Fifteen meters of stratification separated the Forum floor of the eighth century B.C. from that of the seventeenth century A.D.11 Now, digital technology permits the interpolation of the most accurate map of the ancient hills and valleys settled three thousand years ago, because of their geographical advantages.12 It also illuminates the monumental projects undertaken by the organized city to transform a swampy valley prone to frequent flooding into its Forum.
My digital mapping project contains several parts. Two DTMs represent the Forum and Velabrum at different time periods: Map A depicts the area from the time of its earliest
inhabitants to Rome’s traditional foundation date (ca. 1000-750 B.C.), and Map B illustrates the significant changes following the first paving of the Forum and the other engineering
accomplishments of the Regal Period (ca. 600 B.C.). Each version, available as a raster DTM with its supporting elevation data set, is generously hosted on the website of the Ancient World Mapping Center, UNC-CH (http://awmc.unc.edu). Traditional maps, views from different perspectives, and various figures derived from the computer model are offered in print throughout this work where appropriate, with digital copies available online.13 This dynamic model aims to remain online as opposing arguments arise or new evidence is discovered, and it aims to make all data available and all processes transparent as any geographical information system (GIS) should.
11
Andrea Carandini, Rome: Day One (Princeton: Princeton University Press, 2011), 7. 12
The defensive advantages of the hills and the economic advantages of the Tiber are noted by many historians such as Tim J. Cornell, The Beginnings of Rome: Italy and Rome from the Bronze Age to the Punic Wars (c. 1000-264 BC) (New York: Routledge, 1995), 48.
13
Chapters one and two provide background for the visualization presented in the thesis. The first chapter summarizes the recent efforts to map the city of Rome, and it differentiates my own model from its predecessors. The projects mentioned all focus on recreating the ancient terrain; many of them are three-dimensional computer models. Chapter two explicates the methodology used for my project, and it illustrates the precise changes made to the modern landscape in order to produce a model of the pre-modern terrain. The primary views of the two DTMs appear within this chapter.
The third chapter begins to assess the applications of my new model of Archaic Rome. It shows that the environment of the area of the Forum Romanum before paving may have been quite different than had once been thought, and it allows the first mapping of ancient floods and their impact on city planning for this period. The model also provides the only accurate estimate of the amount of fill required to lay the first Forum pavement, which lies, in places, two meters above the natural land surface. The model also provides clues about the source of the fill material. This evidence facilitates the understanding of this massive project in terms of the individual human labor required to complete the work.
Three appendices provide a database of the information used to create the model. All archaeological spot heights and the corresponding geographical coordinates (used for Map A and B) appear in Appendix I and II, respectively. Appendix III includes the sources of all
architectural plans and likewise the sources of their placement and dating. Any necessary justification for the use of certain heights or plans is found within each entry.
chose to build it squarely in an area that nature had designated as a floodplain.”14
The Forum represents the Romans’ first major advance in their struggle against the environment, and
questions remain about this crucial development. This thesis investigates these questions and aims to provide tools to answer many other questions about the terrain modeling of ancient cities.
14
Chapter I
Recent Cartographic Projects
Several projects that map Rome, especially those which have produced three-dimensional models, deserve mention. These scholarly visualizations of the ancient city, reviewed here in chronological order, focus on a variety of time periods and have independent goals. Some of these projects have inspired methodologies employed in the construction of the present model, but my work includes almost no data from the maps listed below. The review of these projects is instructive in that not only does it provide a contextualization of the previous scholarly
approaches to the modeling of the center of Rome, but also offers a point of contrast in that the methodologies employed in these other examples largely diverge from the method adopted by the present model.
A) Two-Dimensional Reference Maps
The Carta Tecnica Regionale of the Regione Lazio is a 1990 contour map (1:10,000 with 5 meter contour intervals) of the modern city of Rome. It displays the layout of the roads and buildings of the city in 1990. Several scholars (e.g. Lothar Haselberger, Italo Novelli, Angelo Corazza, Fabrizio Marra) use it as a base for their own maps. It thus provides a convenient resource for cross-referencing different maps.
Italo Novelli’s 1991 Atlas of Rome contains 276 aerial photographs of the area of the city
within the Aurelian walls, each at a scale of 1:1,000.15 The photographs are paired with maps of the corresponding areas depicting property boundaries, building footprints, and randomly distributed modern spot heights, elevations at specific locations on a map.
15
B) Two-Dimensional Reconstructions of the Ancient City
Although now somewhat dated, Lorenzo Quilici’s 1967 “Ricostruzione morfologica del suolo primitivo di Roma” presents a much-used contour map (1:43,500 with intervals at 5 meters) of the whole area of the city of Rome before settlement.16 The latest work in which it appears was published in 2008.17 A 1976 physical model of the terrain based on its contours also exists.18
Alessandro Cassatella and Laura Vendittelli produced a large scale map of the early city, “Roma Arcaica: fine del VII - inizi del V secolo a.C.,” in 1991 (1:7,000). Although it plots the
major structures and finds, the extremely generic contour lines only indicate the elevation every 12.5 meters.19
In 1998, Paolo Carafa included several maps of the Comitium area in Il Comizio di Roma dalle Origini all’Età di Augusto, which represent the site in various time periods before the Empire. Although none of the maps depicts the greater Forum area, the map of the Comitium at the foundation of the city (750-630 B.C.) includes the terrain with contour lines (1:2,300 with contour intervals 0.5-10 meters) determined by recent archaeological research.20
Lothar Haselberger’s Mapping Augustan Rome (2002) concentrated on reconstructing
an accurate landscape for the city in the Augustan period. Haselberger began with the Carta Tecnica Regionale, and he used geological research on the recent alluviation from the Tiber in
16
Lorenzo Quilici, “Ricostruzione morfologica del suolo primitivo di Roma,” in La Grande Roma dei Tarquini, ed. Mauro Cristofani, 30 (Roma: L’erma di Bretschneider, 1990).
17
Olivia Testa et al., “Il problema dei riporti e le modificazioni della forma originaria,” in La Geologia di Roma: Dal Centro Storico alla Periferia (Part 1), ed. Renato Funiciello, ntonio raturlon, and uido iordano ( irenze: ociet laborazioni Cartografiche, 00 : 1 .
18
Lorenzo Quilici, Roma Primitiva e le Origini della Civiltà Laziale, (Roma: Newton Compton, 1979), pl. 11; Quilici is also responsible for the model of Rome in the time of the Tarquins made in the early 1990’s and on display at the Museo della Civiltà Romana.
19
lessandro Cassatella and Laura Vendittelli, “Roma rcaica: fine del VII - inizi del V secolo a.C.,” (Roma: Quasar, 1991).
20
order to either lower or raise the terrain height in the valleys to fit the probable ancient landscape. Cultural landmarks were then positioned using historical research, topographical dictionaries, and tourist maps. Mapping Augustan Rome produced two maps, the main map (1:6,000) and an inset (1:3,000), both with 5 meter contour intervals), which are available digitally on the project’s website along with vector contour lines.21
In 2005, Dunia Filippi published the most recent plan of rchaic Rome’s physical elevation (fig. 4) in her article “Il Velabro e le origini del oro.”22 Filippi derives the contours of this map (1:5,000 with contours every 1-10 m) from her own research and from some very basic sketches by Albert J. Ammerman, who studied the area extensively by means of deep mechanical cores.23 The crucial contours below nine meters are completely hypothetical, however, leaving the crucial elevations of the entire Velabrum — and indeed the Forum area — in question. Andrea Carandini reproduces these same contour lines in the maps (1:1,300-1:3,200, 5-10 meter intervals) of early Rome in his 2012 Atlante di Roma Antica (not to be confused with the 1991
Atlas of Rome), yet the land surface here lacks clarity to a greater degree.24 The broken lines of hypothetical contours are now solid and no numbers indicate the height of the contours,
presumably at the same 5 or 10 meter intervals. Thus these very recent maps do not satisfactorily represent the elevation of the hills and valleys of early Rome.
C) Three-Dimensional Reconstructions of the Ancient City
The Digital Roman Forum project (2005) directed by Bernard Frischer and Diane Favro
21
Lothar Haselberger, Mapping Augustan Rome (Portsmouth, RI: Journal of Roman Archaeology, 2002); website: rchaeological Mapping Lab, “Digital ugustan Rome,” last modified January 3, 01 ,
http://digitalaugustanrome.org/. 22
Dunia ilippi, “Il Velabro e le origini del oro,” Workshop di Archeologia Classica 2 (2005): 95. 23
As fig. 4 shows, the contour spacing is inconsistent here.
24
provides an interactive, three-dimensional model of the structures in the Forum on June 21, 400 AD based on ancient accounts and topographical dictionaries.25 This visualization and several other recent mapping endeavors focus primarily on architectural conjecture and the recreation of the cultural features of Rome in three dimensions.
Reconstructions of the physical topography appear in three DTMs of Rome produced for
La Geologia di Roma: dal Centro Storico alla Periferia organized under the Servizio Geologico d’Italia in 00 . The two most detailed DTMs depict the rchaic and Imperial Campus Martius
using several hundred spot heights from archaeological investigations.26 The third DTM (fig. 5)
Figure 5. The DTM at 5 Meters of the City of Rome before Human Activity (1:43,500). Olivia Testa et al., “Il problema dei riporti e le modificazioni della forma originaria,” 160, fig. 13.
25
UCL Cultural Virtual Reality Laboratory, “Digital Roman orum,” last modified 00 , http://dlib.etc.ucla.edu/projects/Forum/.
26
represents the entire urban area prior to human occupation. However, this model derives all of its elevation data from the “Ricostruzione morfologica del suolo primitivo di Roma” made by Quilici in 1967. Although the only three-dimensional visualization of early Rome to date, it has ignored recent archaeological data and simply reused a forty-five-year-old map.
Katherine Wentworth Rinne’s Aquae Urbis Romae project (1998-2010) centered onthe
hydrology of the city and thus required a model of the elevation and slope of the hills. She created in an interpolation of the terrain level from modern spot heights in the 1991 Atlas of Rome and various heights collected from archaeological reports.27 The project’s website houses a digital timeline map of the city without elevation information, and the only views of the three-dimensional topography come from one model of the city from 753 B.C. to 1600 A.D. Tiber inundation and constant occupation have changed the ground surface so much between these dates, however, that the model cannot accurately represent the conditions of any more specific era, such as Archaic or even Augustan Rome.
In 2010, Bernard Frischer’s Rome Reborn continued the general concept of his Digital Roman Forum and mapped the entire city center at June 21, 320 A.D. with all of its architectural features.28 The model combines archaeological data for two hundred specific structures,
quantitative data about the general distribution of buildings in specific areas, and as previously mentioned, the digitization of Italo Gismondi’s Plastico di Roma Antica. Philippe Fleury and ophie Madeleine’s work Le Plan De Rome (2008) is very similar to that of Frischer, except that
it is based on the plaster model of Constantinian Rome in Caen, constructed by Paul Bigot from
27
Institute for Advanced Technology in the Humanities at the University of Virginia, “ quae Urbis Romae: the Waters of the City of Rome,” last modified September 26, 2007, http://www3.iath.virginia.edu/waters/first.html. 28
1900-1940.29 As noted above, these models might provide useful visions of the architecture of the late Imperial city, but they sacrifice accuracy in the physical topography, which even if corrected still does not include recent discoveries.
Diane avro and Christopher Johanson’s 2010 article “Death in Motion: uneral
Processions in the Roman orum” provides another, fairly accurate digital model of the spatial relationships in the Forum.30 This model of the Forum in ca. 170 B.C. concentrates on the
architectural landscape and derives its terrain information from satellite imagery, cadastral maps, and some georeferenced (plotted on a known geographical coordinate system) archaeological finds.
The reports of the excavations conducted during the construction of Rome’s new Metro Linea C have yielded some DTM reconstructions of newly discovered information. In her 2010 article, “Indagini archeologiche 1999-2009 lungo le mura Aureliane da via Casilina vecchia a
Porta Metronia: L’ voluzione del pasaggio,” Rossella Rea examines a segment of the Aurelian wall and recreates the ancient landscape at different times. Using 400 archaeological core smaples, field exploration, existing ruins, and historical cartography, she mapped the ground level at major phases along the wall with a DTM, and she created ingenious figures with sections displaying the stratigraphy of the phases (fig. 6).31 More models of the stratigraphy along the walls, near the Porta Asinaria, appear in Rea’s 011 publication, Cantieristica Archeologica e Opere Pubbliche: La Linea C della Metropolitana di Roma, Tratta T4; Stazioni San Giovanni,
29
Philippe Fleury and Sophie Madeleine, “ roblématique d’une restitution globale de la Rome antique: Une visite interactive avec accès dynamique aux sources anciennes,” in Actes du colloque virtual retrospect 2007,
Archéovision 3, ed. Robert Vergnieux and Caroline Delevoie (Bordeaux: Editions Ausonius, 2008): 55. 30
The second model in the article is borrowed from the Digital Roman Forum project; Favro and Johanson, “Death in Motion: Funeral Processions in the Roman Forum,” 1 -37.
31
Figure 6. Stratigraphic Section of the Aurelian Wall. Rea, “Indagini archeologiche 1999-2009 lungo le mura Aureliane da via Casilina vecchia a Porta Metronia: L’Evoluzione del pasaggio,” 228, fig. 12.
Lodi: Indagini 2010-2011.32 These models only cover a small area, but they demonstrate the potential of modern mapping technology and interpolation techniques.
In 2011 the Soprintendenza Speciale per i Beni Archeologici di Roma and National Geographic España created a web interface which displays high-quality photography of the Forum in 360 degrees and provides specific information about each ancient monument when the user selects it.33 Although this project does not recreate the ancient terrain, it provides an
innovative mechanism for the study of the Forum ruins.
Gregor Kalas, in his Visualizing Statues in the Late Antique Forum (2011), worked with
32
ergio ontana, onia Martone, and Rossella Rea, “ tazione an iovanni,” in Cantieristica Archeologica e Opere Pubbliche: La Linea C della Metropolitana di Roma, Tratta T4; Stazioni San Giovanni, Lodi: Indagini 2010-2011, ed. Rossella Rea (Milano: Electa, 2011): 146-149.
33
Favro and Johanson to georeference statue locations in the Imperial Forum. 34 He then added them to modern satellite maps, and he placed the locations and elevation drawings of the statues on the Digital Roman Forum model. This type of modeling again focuses on recreating a
hypothetical experience of the cultural topography, and it does not attempt to recreate the ancient terrain.
D) Conclusion
Many mapping endeavors with various objectives have presented their vision of the ancient city of Rome in recent years. Those which have attempted to recreate the landscape of Rome in the Archaic period have not taken advantage of the vast resources available, and the single digital visualization of Rome in this period incorporates only forty-five-year-old data.35
A notable contrast, although it does not depict Rome, is Ignacio Fiz and Hèctor A.
Orengo’s 00 article “The application of 3D reconstruction techniques in the analysis of ancient Tarraco’s urban topography.”36
It generally addresses the methodology and problems involved in mapping urban landscapes using GIS technology and archaeological data. It also discusses the value of reconstructing three-dimensional views of ancient sites.
My model utilizes as much excavation data as possible including lbert mmerman’s full set of spot heights for Rome and a LiDAR model of the modern city, never employed before in such a project. The process of creating my model required several other important data sources and a method for attaining a representation of ancient landscape from a model of modern Rome.
34
UCL xperiential Technologies Center, “Visualizing tatues in the Late ntique Roman orum,” last modified 2011, http://inscriptions.etc.ucla.edu/.
35
Recent archaeological research into early Rome is discussed further in Chapter II. 36
Chapter II
Making the Model
The DTM on which my entire project is based represents the integration of various published data in order to create a new view of the Roman Forum. The methodology of the project aims to produce legible and accurate maps, which focus on the historical elevation of the archaic terrain of the city and include the plans of the known structures. The primary software employed was the ArcGIS 10.1 mapping and spatial analysis program.
A) LiDAR Data
A set of LiDAR data collected in 2009 from the modern city of Rome forms the basis of the DTMs, and it was modified by the removal of any post-Archaic strata. LiDAR (Light Detection And Ranging) is a remote sensing technique that uses continuously pulsing lasers, fired from an airplane in this instance, to precisely measure the height of the ground based on the return time of the laser.37 The process of collecting this LiDAR data provided the most accurate assemblage of information, stored as points with x coordinates, y coordinates, elevation values, and the intensities of the laser beams, ever collected for the city of Rome. The study area for my project alone contains 5,509,963 points. The data was received in a processed form, so that it represents the bare earth only of the modern city. Thus most buildings, trees, and other obstructions above the ground were removed from the data.
As mentioned previously, the Ancient World Mapping Center and Davis Library at UNC- CH were instrumental in the coordination of the LiDAR data purchase. Now any library user can access the raw LiDAR data free-of-cost (call number: 10-916 external hard drive).
37
The horizontal projection of the data is Universal Transverse Mercator (UTM), zone 33 north. The model retains this coordinate system, so any coordinates presented in this thesis refer to both the UTM x and y coordinate system and the traditional longitude and latitude location. The vertical projection, which defines all of the elevation values associated with the horizontal coordinates, is the World Geodetic System (WGS) 1984 ellipsoid. The ellipsoid elevation does not refer to sea level. It is a construct that attempts to approximate the actual shape of the earth and to create a uniform system of elevation for the entire world. Almost all published
archaeological and geological data for Rome, however, refers to the orthometric height, which is the actual measure of the Earth’s elevation in reference to the local sea level (meters above or
below sea level). Both systems provide correct information, but each is based on a separate datum or reference point from which the measurements are taken.38
ArcGIS software cannot perform a transformation of vertical coordinate systems; senior analysts from the publisher of the software, Esri (formerly the Environmental Systems Research Institute) have confirmed that this process is not feasible for my project. While my DTM
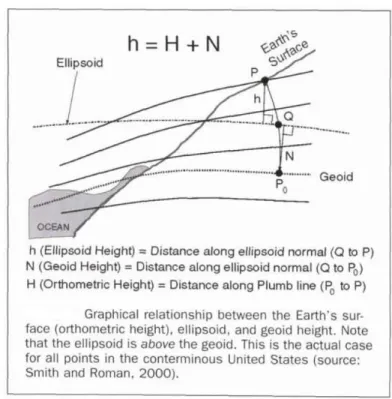
references ellipsoid heights, I have presented orthometric heights for the figures and maps because most readers easily recognize meters above the local sea level (masl). Each height was individually calculated, since any orthometric height can be derived from the ellipsoid with the use of the geoid, a model of Earth’s gravitational system. This process also makes the LiDAR data compatible with any archaeological data published as orthometric heights. The National Geodetic Survey’s 1996 Geoid was utilized in the conversion of all heights. Figure 7 depicts the
relationship between the geoid, ellipsoid, and orthometric surfaces of Earth. The data does not lose accuracy in this process, and the orthometric height is obtained by simply subtracting the geoid height from the ellipsoid height at any specific location.
38
Figure 7. The Geoid-Ellipsoid Relationship. Daniels, “Data conversion issues with LiDAR spot elevation data,” 736.
The LiDAR data of the modern city required some post-processing. I first limited the dataset to my study area, a rectangle bounded by the UTM coordinates: 4641129.466,
290770.148, 4640216.318, and 291620.991 (or Latitude in decimal degrees north: 12.47786 and 12.48843, Longitude in decimal degrees east: 41.89442 and 41.88642). The second step involved introducing heights into a part of the LiDAR data set which lacked height points, an area of about 17,000 square meters at the north-west corner of the Palatine hill (about 4 percent of the total map). These types of holes in bare-earth data are not unusual, and nine spot heights from the 1991 Atlas of Rome as well as contours from the 1990 Carta Tecnica Regionale supplied the surface elevation for this area of the modern city.39
The bare-earth data processing conducted by the LiDAR providers did not always filter the points to the exact ground level since some building foundations, such as that of the Altare
39
della Patria, occupy so much space that determining the modern ground level can prove difficult. In my third step, I removed some minor ruins, and open excavations were filled because the findings subsequently used to lower the ground level to ancient levels did not make allowances for these features. This post-processing affected any non-ground feature of a few meters in height or depth. The Atlas of Rome (1991) verified the presence of any non-ground irregularities remaining in the LiDAR data.40 This atlas and the Carta Tecnica Regionale provided the ground heights for any area requiring edits. Figure 8 marks the locations of post-processing edits.
B) Ancient Elevation Data
After finishing the post-processing, my next step consisted of altering the modern terrain by subtracting the entire fill accumulated since the first occupation. A triangular irregular network (TIN) was generated from the LiDAR terrain points within ArcGIS. A TIN is an elevation model that creates a surface of triangles with vertices at every elevation point. This TIN was then converted into a raster DTM. Rasters comprise a complex grid, and each minute square or pixel holds the average height for the small area it covers. Rasters display a surface much more smoothly and legibly than TINs and permit certain operations that are necessary for completing my model.
A contour map (fig. 9) in La Geologia di Roma: Il Centro Storico presents the levels of anthropic and alluvial fill throughout the city since its foundation and provides the necessary information to interpolate the original landscape.41 This 1:10,000 scale map has contours with 2-5 meter intervals and is based on geological investigations conducted within the city. I first
40
Novelli, Atlas of Rome. 41
Figure 8. Map of the post-processing required for the LiDAR data. Major foundations or open trenches were removed in the following areas: 1) The Altare della Patria, 2) The Basilica Julia, 3) The Basilica of Maxentius and Constantine 4) The Musei Capitolini 5) Horrea Agrippiana Excavation 6) Sant’Omobono Excavation
scanned and converted its contours into line features in ArcGIS. These lines established the heights for a TIN surface, which automatically modeled a natural grade in between the contours. Secondly, I derived a raster DTM from this TIN like the previous one. In a third step, I used the
Figure 9. A detail of the map of the anthropic and alluvial fill at Rome. This is the area relevant to my study. Corazza and Marra, “Carta dello spessore dei terreni di riporto,” tav. 13.
raster math operation in ArcGIS to subtract this fill DTM from the modern elevation DTM. The process resulted in a new DTM of the landscape in the Velabrum and Forum before human occupation. The new map then represented the level of the pre-urban city, but more reliable spot elevations for certain locations are known because of years of archaeological excavation.
and surveys, provide landscape information for before and after the pavement of the Forum. The appropriate archaeological points were incorporated into the final DTM, and if these spot
elevations differed from it at any location, the immediate area was changed tomatch the new archaeological height. Appendix I lists all of the archaeological sources used for Map A (1000-750 B.C.), the exact location of the spot heights, and any necessary justification for certain interpretations. Most elevations in this map refer to the natural ground surface, the stratum below the earliest anthropic remains, because the map depicts the area prior to significant occupation.
Appendix II includes the sources for raising the valley heights in Map B (600 B.C.), which depicts the city after the Forum pavement. It contains different elevation data for the valleys than Map A because the greatest amount of change occurred in the valleys between the times of the maps. The main amendment to the surface is the Forum pavement which raises an area of ground estimated using the scholarly proposals discussed below.
C) Topographical Information
Plans of the known structures, monuments, roads, and sacred areas of Rome during the Regal period appear in Map B. Map A has none of these features due to the scant nature of current knowledge about remains prior to 750 B.C. Building plans were drawn from individual archaeological publications and the Lexicon Topographicum Urbis Romae.42 The dating of structures follows Rome and Environs: An Archaeological Guide by Filippo Coarelli (2007) since it represents recent scholarship for all the features.43 A New Topographical Dictionary of Ancient
42
Eva Margareta Steinby, ed, Lexicon Topographicum Urbis Romae (Roma: Quasar, 1993-2007).
43
Rome provides additional information about the dating of structures given by ancient authors.44 Appendix III records the sources for the dates, the plan, and the placement and any notes on the drawing of each cultural feature. I scanned most plans and drew them as polygons within ArcMap and altered the final figures stylistically with Adobe Illustrator. Lothar Haselberger’s
Mapping Augustan Rome and the Atlante di Roma Antica aided in the location of the plans within the larger model.45 The two-dimensional structure polygons lie on top of the three-dimensional terrain of the DTM.
The small section of the Tiber river in my model is seen at a level of 4 masl, but the height varies throughout the year as is discussed below. Few scholars have attempted to reconstruct the ancient river course, and those that do often use maps of the Tiber before the installation of twentieth-century flood walls, such as Lanciani’s Forma Urbis Romae.46 I removed the modern Tiber embankments during post-processing using the course of the Tiber from Mapping Augustan Rome, which generally follows Lanciani and indicates the shape of the river before the modern flood walls. After subtracting the post-Archaic fill, I placed the river at 4 masl for the reasons explained below. The extent of the river at this level forms the course found in Map A and Map B.
44
Lawrence Richardson Jr., A New Topographical Dictionary of Ancient Rome (Baltimore, MD: The Johns Hopkins University Press, 1992).
45
Haselberger, Mapping Augustan Rome; Carandini, Atlante di Roma Antica: Biografia e Ritratti della Città. 46
Le Gall, for instance, refers to the Lanciani map: Joël Le Gall, Le Tibre, fleuve de Rome dans l’antiquité (Presses Universitaires de France, 1953), 107, 376; The small scale of Quilici’s map prevents the use of his Tiber
D) Design
Adobe Illustrator enabled the final preparation of the symbology, labeling, and color palette for the maps and figures derived from my model. The model itself is meant to allow for editing, for updates of the terrain, and for the integration of opposing theories. As with any GIS, these changes would be made by editing the data on which the model is based. As specified in the introduction, the Ancient World Mapping Center website (http://awmc.unc.edu) provides digital versions of many of the figures from this work, and it hosts the DTMs themselves and their full digital databases.47 The Appendices note all changes made to the original LiDAR terrain, however. Exploration and editing of the three-dimensional visualizations are best facilitated with the Esri ArcScene program.
E) The Completed Model
Maps A (fig. 10) and B (fig. 14), the primary representations of the two DTMs at a scale of 1:3,500, are found on the following pages. Three-dimensional views from within each DTM follow the two-dimensional maps.
47
Figure 11. Map A: View from the Palatine west toward the Tiber.
Figure 12. Map A: View from the Capitoline east towards the Forum basin.
Figure 15. Map B: View from the Tiber toward the Sant’Omobono sanctuary and the Capitoline.
Figure 16. Map B: View in a bird’s eye perspective, looking down into the Forum from the east.
Chapter III
Archaic Floods and the First Roman Flood Control
The models which I created not only visualize recently collected data, but they also have immediate implications for the study of the history of early Rome. Map A allows new
interpretations of the conditions of the Capitoline/Palatine area at its first settlement and provides insights into the issue of flooding. Map B determines the cost and effectiveness of the first changes the Roman elite introduced into the landscape. These are not the only conclusions that the models might enable, but they represent the primary focus of the present study.
A) The Problem of Early Inundations
In Livy’s account, the first recorded flood of the Tiber River at Rome saved the two founders of the city, because the men sent to drown Romulus and Remus could only deposit the infants at the edge of sluggish flood waters.48 Future floods would not pardon Romans so easily, however, and they assaulted the city several times annually, forcing citizens to mount a near constant defense against inundation. Reconstructions of flooding in the period before major flood control, during the city’s first occupation, do not exist, and questions remain about the original environmental conditions of both the Forum valley and the Velabrum.49 Now my terrain model not only proves that the average Tiber height in antiquity must have differed from its modern level, but it also permits the accurate mapping of the extent of floods in Archaic Rome.
Moreover, it demonstrates that the earliest construction projects keenly respond to the dangers of Tiber floods, and it provides new analysis of the marshy conditions of the early valleys, which
48
Titus Livius, Ab Urbe Condita Libri, 1.4. 49
may have resembled ancient accounts more than had once been thought.
Gregory Aldrete’s important 2007 study, Floods of the Tiber in Ancient Rome, provides data about the Tiber’s normal flow and average flood magnitude required to reconstruct the
eighth-century B.C. river and its inundations.50 Using monthly records from 1822 until 1940,
Aldrete reports that the modern Tiber level usually varies between 5 and 7 masl during each year
with an average of 6.48 masl.51 These measurements were conducted at the Ripetta station in
Rome. The river level is considered to be elevated only when it exceeds 7 masl. Since the river
bed was only about a meter lower in antiquity and since ancient sources and archaeology suggest
similar flood maximums for antiquity and today, scholars have generally supposed that the
modern data at least provides a sense of the flow of the ancient river.52 This assumption is
reasonable, but it provides little help in the visualization of the Tiber before Romans undertook
major measures to build up its banks.
My model provides some certainty in the reconstruction of the average archaic Tiber
level, however, because it can project the extent of the river at different elevations. As revealed
by Map A, the banks of the Tiber in pre-urban Rome were much further apart than they are now,
after millennia of silting and human reinforcement. If the Tiber reached a height of 5.48 masl,
equivalent to the modern average of 6.48, since the river bed lies a meter higher today, the river
would cover the entire Archaic Forum Boarium as well as much of the Velabrum, ending finally
50
Aldrete, Floods of the Tiber in Ancient Rome.
51
Ibid, 60-61. 52
at the edge of the Forum valley (fig. 18). The normal course of the Tiber could have entered the
Velabrum at one time, but it seems that processes of silting would have checked the growth of
this spur of the river relatively quickly. In fact, archaeological evidence proves that the surface of
the Velabrum floor did not form under hydromorphic conditions (year-round submersion), so it
may be reckoned that, at most, the valley experienced seasonal inundation.53 Thus the typically
accepted average river elevation far surpasses the range for the actual level.
As mentioned in Chapter II, my DTMs depict the Tiber at a default height of 4 masl: This
represents one of the highest elevations at which water does not cover any known dry area of the
Figure 18. Map A (1,000-750 B.C.): The Tiber at 5.48 masl. This view and all other flood images are oriented with the Palatine Hill at the right, the Forum valley at the top, and the Capitoline Hill to the left.
53
Velabrum. This level falls below the lowest modern monthly average of 4.77 masl for July, but it
still results in a pre-urban river that escapes its modern bounds.54 The lower figure for the normal
height of the Tiber in my model might fall at about 2.5 masl, considering that the bed of the
Tiber reached 2 masl in places during antiquity.55 Thus, the usual flow of the Tiber during the
early stages of the city’s development may have ranged from 2.5 to 4 masl. I have chosen to map
the Tiber at as high an elevation as possible, because this disagrees least with the only reliable
data for the average, non-flood height of the river, the modern Ripetta measurements. The model
also corroborates, in part, the reach of the Tiber into the valleys proposed by Filippi and
Coarelli.56 My estimation remains close to the recent averages mainly because ancient floods
achieved similar maximums to those of today.
Floods in the period before the Forum pavement had considerable magnitudes, and the low terrain increased their potential for devastation. Archaeological evidence from excavations at the Regia and near the Arch of Augustus revealed flood sediments in early strata, indicating that ancient floods must have reached at least 10-11 masl.57 Using the variety of literary sources which record ancient floods as well as the records of floods from more recent times, Aldrete estimates that one exceptional flood (more than 15 masl) would occur every twenty years and that lesser, but still significant, inundations attacked the city every four to five years.58
Ammerman even estimated that the Tiber probably flooded the archaic city to a level of 9 masl at
54
The height of 4.77 masl is adjusted for the ancient river bed; the modern average for July is 5.77 masl: Aldrete, Floods of the Tiber in Ancient Rome, 60.
55
The modern bed is at 3 masl near the Vatican: Giuseppe Capelli, Roberto Mazza, and Sara Taviani, “Acque sotterranee nella città di Roma,” in La Geologia di Roma: Dal Centro Storico alla Periferia (Part 1), ed. Renato Funicello, Antonio Praturlon, and Guido Giordano (Florence: Società Elabora ioni Cartografiche, 2008): 230. 56
Filippi, “Il Velabro e le origini del Foro,” 95; Coarelli, Il Foro Boario: Dalle Origini alla Fine della Repubblica, 241.
57
Ammerman, “On the origins of the Forum Romanum,” 637-638. 58
least once or twice a year.59 The hundred-year flood did not exist for the Romans; they dealt with extreme deluges several times in an average lifespan and the continual inundation of the lower valleys.
Figures 19-22 display the floods of the Tiber for Map A according to the Betocchi
classification system, which stipulates that the river is elevated at 7-10 masl, experiencing an ordinary flood at 10-13 masl, an extraordinary flood at 13-16 masl, and an exceptional flood for anything over 16 masl.60 These visualizations indicate the devastating effects of even an ordinary flood in this period, since a ten meter flood would cover the entire Velabrum, the Forum area, the Circus Maximus and parts of the valley between the Palatine and Velia. The intensity of these floods varied, usually lasting a few days and attaining their maximum during only a portion of this time, but Cassius Dio reports a flood in 3 B.C. which made the city navigable by boat for an entire week.61 Clearly, Tiber floods caused problems for the early inhabitants of the city, as they would for generations of their descendants, but Romans understood the floods well from the beginning.
The distribution of early construction at Rome indicates a keen awareness of the extent of typical floodwaters, which would later be set aside due to lack of space and environmental change. The earliest Romans dwelled on the hilltops, and they must have benefited not only from the defensive advantage of the position, but also from the natural refuge from inundations. When the hilltop communitiesunified under synoikismos, however, they immediately began to
59
Ammerman, “On the origins of the Forum Romanum,” 638. 60
The system is used by several authors. Here it is simplified because I have not included the discharge rate of the river; this information does not exist for the ancient Tiber. Aldrete, Floods of the Tiber in Ancient Rome, 62. 61
Figure 19. Map A: The Tiber at 7 masl (Elevated).
Figure 20. Map A: The Tiber at 10 masl (Ordinary Flood). The following flood maps include more area (The Aventine is at lower left) to show the extent of large floods with the sides of the figure oriented to the cardinal
Figure 21. Map A: The Tiber at 13 masl (Extraordinary Flood).
reorganize the urban space and to build in the valleys.62 Aldrete observes that later Romans avoided erecting specific categories of buildings, such as domus and insulae, in flood prone areas, while commercial, political, and entertainment structures almost always appear within flood zones.63 Even so, early in the city’s history, Romans would have probably preferred high ground for all categories of buildings.
My model reveals that most of the oldest structures and roads in the valleys were situated on outcrops and slopes, higher than ordinary flood maximums. Figure 23 illustrates that a 6.5 meter flood of Map A does not reach the Vicus Iugarius (A) and the Vicus Tuscus (B) or the sites of the Sant’Omobono sanctuary (C) and the Ara Maxima of Hercules Invictus (D). Figure 24
Figure 23. Map A: The Tiber at 6.5 masl and future sites in the Velabrum and Forum Boarium.
62
Cornell, The Beginnings of Rome: Italy and Rome from the Bronze Age to the Punic Wars (c. 1000-264 BC), 102-103.
63
depicts a 9 meter flood, which would cover the locations just mentioned and even the Forum basin, but leave the Altar of Saturn (E), the Volcanal (F), the Comitium (G), the Regia (H), and the Temple of the Vestals (I) dry. Thus the original layout of the city seems to stem in part from the practical need to circumvent, as much as possible, the negative effects of frequent moderate floods. Ammerman calls the cappellaccio (pisolitic tuff) outcrops on which the Comitium was located “elevated, rostra-like structures that readily could be used for ritual or ceremonial purposes,” but one cannot forget that natural forces must have shaped decisions as well.64
Besides the simple threat of inundation, the preference for higher elevation construction might hint at generally swampy and unfavorable conditions in the valleys, even when the Tiber was not overflowing.
My model also adds new perspectives to the understanding of environmental conditions in the Forum basin, since some scholars have presented an ambiguous vision of the early
Figure 24. Map A: The Tiber at 9 masl and future sites in the Forum area.
64
conditions in the valleys. Reconstructing the environment for any place in the eighth century B.C. is difficult and never certain, but my model can, at least, help in interpreting previous discussions. Most scholars agree that the Forum basin and Velabrum were fen-like, and that much of the runoff from nearby hills and discharge from the twenty-two natural springs of Rome ended up here on its way to the Tiber.65 Archaeological evidence verifies water-logged
conditions, because the seventh-century strata beneath the Forum contain peat, an organic material within the sediment produced in marshy environments.66 Ammerman also asserts that the valley was dry most of the year with some seasonal inundations and that the Forum could not support a permanent body of water, since a natural saddle of earth probably did not exist to hold it back, creating an even more unclear image of the area.67 Past discussion includes controversy about the typical amount of moisture in the valleys, although it generally advances the thought that the Forum area was more of a swamp than a lake.
Scholars have generally dismissed ancient accounts of the early conditions here. Dionysius of Halicarnassus, for instance, states that before being paved, the Forum area
contained a hollow filled with a lake where runoff from the hills collected.68 Ovid also indicates that a lake once filled the Forum, and he draws a connection between this lacus and the name of the Lacus Curtius.69 This clue to the etymological history of the spring’s name at the very least
65
Aldrete, Floods of the Tiber in Ancient Rome, 55, 168-169; Albert J. Ammerman, “Dawn of the eternal city: Archaeologists illuminate the shadowy origins of Rome,” 27; Christopher J. Smith, Early Rome and Latium: Economy and Society, c. 1000 to 500 BC (Oxford: Clarendon Press, 1996), 101, 158; Richardson, A New Topographical Dictionary of Ancient Rome, 170.
66
Ammerman, “On the origins of the Forum Romanum,” 635. 67
The archaeological evidence cited earlier only proves that the Velabrum was not constantly submerged, Ammerman, “Environmental Archaeology in the Velabrum, Rome: Interim Report,” 219, 220-221. 68
“τὸ δ᾽ ὑποκείμενον τῷ Καπιτωλίῳ πεδίον ἐκκόψαντες τὴν ἐν αὐτῷ πεφυκυῖαν ὕλην καὶ τῆς λίμνης, ἣ δὴ διὰ τὸ κοῖλον εἶναι τὸ χωρίον ἐπλήθυε τοῖς κατιοῦσιν ἐκ τῶν ὀρῶν νάμασι, τὰ πολλὰ χώσαντες ἀγορὰν αὐτόθι
κατεστήσαντο,” Dionysius of Halicarnassus, Antiquitates Romanae, 2.50.2; “And cutting down the forest that grew on the plain lying at the foot of the Capitoline and filling up (with earth) the greatest part of the lake, which, since it was a hollow, was well supplied by waters flowing down from the hills, they established an agora on the spot.” 69
indicates a Roman tradition that the distinctive naming of the spring pertained to an original, natural feature of the landscape. Livy calls the area around the Lacus Curtius a deep swamp (profunda palus) with a shallow pond (vadum) next to it.70 Although Livy’s language may not quite define the valley as a lake, the reader can imagine a saturated landscape. Propertius and Plutarch also comment on the repeated necessity of boat travel through the Velabrum, implying that the Forum may have seen similar conditions.71 Most ancient authors thought that the early Forum often held a fairly significant water body (lacus), but modern scholars believe the area was more a swamp (palus), which most likely varied seasonally. While it may not be possible to decide who has the correct interpretation, I intend to introduce another aspect of this problem, which has not yet received enough attention.
Evidence for a high, natural saddle of earth at the edge of the Forum to hold in a large lake does not exist, so scholars have not addressed the issue of a perennial body of water in the valley. My model demonstrates, however, that before its pavement, the Forum functioned as a true basin, which would hold a significant amount of water. This is Map A places a swamp at the lowest parts of the Forum valley. Figure 25 illustrates the maximum level of pooled water in the basin before it would have spilled over into the Velabrum. With the surface volume tool in ArcGIS, the model demonstrates that this basin could hold 3,594,000 liters of water (about 950,000 gallons), enough to fill an Olympic swimming pool one and a half times. Interestingly, two springs called lacus, the Lacus Curtius and Lacus Iuturnae, border it directly on either side. Thus, this low point probably received a regular supply of water from the two springs as well as the others nearby. The rain washed down from the hills also contributed to its filling. Even
70
“[…] ubi primum ex profunda emersus palude equus Curtium in vado statuit, Curtium lacum appellarunt,” Titus Livius, Ab Urbe Condita Libri, 1.13.5; “Where the horse of Curtius stood in the shallow pool, having been raised first from the deep swamp, they called the lake of Curtius.”
71
Figure 25. Map A: Water collected in the Forum basin at its greatest height (ca. 7.35 masl). Any water above this level would spill into the Velabrum.
though a natural stream most likely ran from the Forum to the Tiber, as seen in Map A, water presumably would still pool in the basin before following the streambed which must have dipped in elevation here.72 The stream was also far from sufficient to drain the valley, since the Romans spent so much effort replacing it with the first sewer (cloaca); the stream only served to channel water directly into the basin during floods.73 Floods, which commonly left standing pools of water after receding, would also have filled this basin.74 The 7 masl deluge depicted in figure 19
72
The courses of the streams in Map A follow those proposed by Ammerman and Hopkins with adjustments made for the terrain of my model: Ammerman, “On the origins of the Forum Romanum,” 636, 638; John N. N. Hopkins, “The Cloaca Maxima and the monumental manipulation of water in Archaic Rome,” The Waters of Rome 4 (March 2007): 6.
73
Ammerman, “On the origins of the Forum Romanum,” 636. 74
would probably have reached this area and filled it. The presence of the basin in the Forum valley indicates that during the rainy season, parts of the Forum valley would have contained some standing water, even if a lake did not cover the whole area.
The length of the rainy season in ancient Rome is not well understood, so it is unclear how seasonality affected the amount of water that potentially accumulated in the Forum pool throughout each year (thus, only a swamp pattern appears on Map A). Modern Tiber levels peak in the winter and spring, and some ancient authors attest that the same was true for antiquity.75 At least two reports of ancient floods dated to the late summer survive, however, and a flood at this time of year has not ever been recorded outside of the ancient period.76 This suggests the possibility of a longer wet season. Some scholars believe that this variability of the ancient Tiber existed due to more frequent and heavier snowfall in antiquity, but Aldrete interpreted it as a possible “statistical fluke” because of the limited amount of datable ancient flood data.77
No definitive evidence proves that the ancient Roman climate differed drastically from the modern. Water entering this large basin must have had a large impact on the local environment, however, since it would have saturated the soil within and around it completely before it even began to fill.
Although all of the questions about the early conditions in Rome’s valleys will likely never receive full answers, my model proves that the Forum valley could collect a large amount of water, which would have created a waterlogged environment and perhaps a vadum. This does not prove the ancient authors completely correct, but it does somewhat reconcile their accounts with archaeology and with the opinions of scholars. The Forum pool provides another
justification for the massive construction projects undertaken to drain and fill the valley.
75
Aldrete, Floods of the Tiber in Ancient Rome, 70; Pliny the Younger, Epistulae, 5.6.12; Q. Horatius Flaccus, Epodes, 2.25; and Plutarch, Otho, 4 mention high rains and river flow in the winter and spring.
76
Aldrete, Floods of the Tiber in Ancient Rome, 69.
B) The Battle against the Tiber Begins
Between 650 and 625 B.C. Rome’s early leaders began taking measures that did not
merely react to flooding and environmental conditions in the Forum valley but also actively prepared for serious defense against them. At this time, the Romans deposited an enormous amount of rubble in the valley and laid a pebble floor on top, creating a uniform pavement at about 9 masl between the Palatine and Capitoline.78 After the filling of the Forum valley,
between 625 and 600 B.C., they added a pebble floor to the Comitium, the central assembly area of the city, and built the first altar in the Sant’Omobono sanctuary, the foundations of the
Iuppiter Optimus Maximus temple, the Cloaca Maxima, and the Regia.79 All of the events occur as part of a sudden change, and Tim Cornell argues that the bulk of the projects were realized between 635 and 615 B.C., during what he would call the true foundation of Rome.80 My Map B can shed new light on this crucial moment of Roman history. The map represents not only the monumental human changes to the landscape but also the natural elevation increase of the Velabrum valley ca. 600 B.C. due to alluviation. My model again allows the mapping of floods to indicate the type of protection provided by the new Forum Romanum. It also provides an accurate estimate of the volume of the Forum fill and a means to determine the origins of the vast quantities of material came needed to realize this filling.
The most obvious advantage of the newly paved Forum is its defense against many of the
78
For a discussion on the debate over dating the first pavement see: Ammerman, “On the origins of the Forum Romanum,” 643-644. Two extremes have since been proposed: Coarelli dates the pavement to 600 B.C. or just before but he does not cite clear evidence: Coarelli, Rome and Environs: An Archaeological Guide, 44; and Carandini provides a very high date, believing the Forum was filled by 725 B.C. and paved soon thereafter. In the commentary to Carandini’s 2012 article, however, Anthony Snodgrass, Robin Osborne, Tim Cornell, and
Christopher Smith all introduce valid concerns with his reliance on texts and disregard of other sites in Italy: Andrea Carandini, “Urban landscapes and ethnic identity of Early Rome,” in Ethnicity and Identity in the Archaic
Mediterranean, ed. Gabriele Cifani and Simon Stoddart (Oxford, Conn.: Oxbow Books, 2012), 18-23.
79 Coarelli, Rome and Environs: An Archaeological Guide, 52; Carafa, Il Comizio di Roma dalle origini all’età di Augusto, 119; Albert J. Ammerman, “The Comitium in Rome from the beginning,” 124.
80
typical floods of the Tiber. The valley now consisted of useable space, which could probably withstand floods at or around 9 masl in height, the level of the new pavement. Figures 26 and 27 indicate the difference between an 8.5 masl flood in 750 B.C. and in 600 B.C.; the Forum fill prevents the necessity for boat travel between the hills during an inundation of this magnitude. The types of floods that assail Rome after the pavement presumably resemble the earlier
inundations, however, and figures 28-31 display the extent of the floods on the Betocchi scale in Map B. Any ordinary flood or worse on the scale would still have impacted the city greatly and covered this newly filled valley. Indeed, the Forum pavements could never end the problem of the deluges, and even in the twentieth century, when the Forum level stood four meters above this first fill, a 13 meter flood saturated the Forum (fig. 32).81 Thus the value of the Forum Romanum as merely a protection against floods must have only underscored the dramatic
Figure 26. Map A: The Tiber at 8.5 masl (Elevated). Figure 27. Map B: The Tiber at 8.5 masl (Elevated).
81
Figure 28. Map B: The Tiber at 7 masl (Elevated).
Figure 29. Map B: The Tiber at 10 masl (Ordinary Flood). The following flood maps include more area (The Aventine is at lower left) to show the extent of large floods with the sides of the figure oriented to the
Figure 30. Map B: The Tiber at 13 masl (Extraordinary Flood).
Figure 32. Photograph of the 1901 flood at 13.2 masl. Ammerman, “On the origins of the Forum Romanum,” 637.
environmental transformation that ended the pooling of large quantities of water and the generally swampy conditions in the area. The benefit of a new, viable urban space justified the enormous amount of materials and labor required to complete the project.
The question of the quantity of the rubble required for the pavement project has
previously proven difficult to answer, but my model enables a precise calculation. Ammerman offered the only prior hypothesis of the fill amount and supposed that 7,646-15,291 cubic meters (10-20,000 cubic yards) of earth were needed for the project.82 He derived this estimate by using regular shapes, a partially-filled sphere and a parallelepiped, to represent the space that the fill strata might have occupied.83 I based my estimate of the fill volume (fig. 33) on the actual area of the pavement. The north, east, and west limits of the pavement were located at the places where the level of the pavement (8.96 masl) meets the natural relief.84 The elevation of the natural relief
82
Ammerman, “Dawn of the eternal city: Archaeologists illuminate the shadowy origins of Rome,” 28. 83
Ammerman, “On the origins of the Forum Romanum,” 642. 84
Figure 33. Map B: The Forum and Comitium fill.
decreases on the south side of the pavement, however, but a wall which stood somewhere north of the south side of the later Basilica Julia would have held back the Forum pavement.85 I placed the southern boundary wall of the Forum fill within the northern third of the future Basilica Julia as a conservative estimate of where it may have stood. The Comitium area was processed
separately to reflect the seventh-century paving at 10.351 masl.86 The entire surface of the Forum Romanum at the end of the seventh century, including the Comitium, measured about 165 meters long and104 meters wide, so the actual surface area of the pavement amounts to approximately
85
A core from the south side of the Basilica shows no sign of successive fills, Ammerman, “On the origins of the Forum Romanum,” 641.
86