Brewing a Bubble:
An explanation of the Craft Beer Revolution with Conspicuous Consumption Theory and Agent Based Modelling
By Jacob Olliffe
Senior Honors Thesis Anthropology
University of North Carolina at Chapel Hill
April 7, 2017
Approved:
Acknowledgements
This thesis represents the culmination of my undergraduate studies at the University of North Carolina at Chapel Hill. As such, I am indebted to all the people who have helped me in my journey to become an honors graduate. Whilst it would be futile to try and name all of them here, several deserve individual recognition.
Firstly, I would like to thank Dr. Colin Thor West for the significant role that he has played as a mentor, advisor, and friend. This project would not have been possible without his assistance.
Next, I would like to thank the faculty of UNC’s Department of Anthropology for re-stoking my intellectual curiosity, developing me into a budding anthropologist and assisting in the thesis-writing process. In particular, I want to thank Dr. Townsend Middleton for his guidance in the early stages of this project and Drs. Angela Stuesse and Paul Leslie for serving on my thesis committee.
Table of Contents
Section
Pp.
Introduction
1
Literature Review
5
Materials & Methods
10
Results
15
Analysis of Results
19
Discussion
21
1
Introduction
Since the 1960’s, the American beer industry has become increasingly consolidated as a
dwindling number of breweries have supplied a growing proportion of the national market with mass produced beer. The Craft Beer Revolution, a term Hindy uses to describe the sudden increase in craft beer sales that has occurred since the mid 2000’s, bucks this trend (Hindy,
2014). Defying conventional business logic, the sales of smaller batch beers primarily intended for local consumption have flourished despite facing a significant cost disadvantage against national breweries, which can spread their fixed costs over a larger sales volume.
2 History of the American Beer Industry
Over its history, the American beer industry has often reflected broad cultural and demographic changes within the United States. Prior to the Civil War, beer was a relatively unpopular drink, with consumers typically preferring liquors like rum and whiskey (Acitelli, 2013). Mass immigration from central Europe postbellum and the subsequent cultural shift fundamentally altered the beer industry, as the per capita consumption of beer increased six fold between 1865 and 1915 (Acitelli, 2013).
After a hiatus from 1919 to 1933 induced by Prohibition, the beer industry reemerged with a fundamentally different competitive landscape as breweries shifted their focus from limited production for local consumption to mass production with national distribution (Acitelli, 2013). Although mass production required companies to produce bland, undifferentiated beer, this competitive shift significantly concentrated the industry. Since the one-time cost of brewing facilities are a significant part of beer production’s total cost, high volume manufacturers could
3 The Craft Beer Revolution
The Craft Beer Revolution is a relatively new consumer phenomenon characterized by the sharp increase in craft beer’s popularity during the mid-2000s. Despite being a decidedly 21st century event, the Craft Beer Revolution has its roots in the 1980’s when a small number of entrepreneurs began opening smaller, independent ‘craft’ breweries (Acitelli, 2013). Craft beer
represented a significant deviation from mass produced beers as they were typically more expensive, flavorful, and primarily intended for local consumption. The predominately local consumption of craft beers is reflected in the law, as small breweries are allowed to forgo the services of third party distributors and self-distribute their products to retailers and consumers (“Self-Distribution Laws”, 2016). Since small breweries lack the financial resources or
infrastructure to distribute regionally or nationally, this exemption implicitly recognizes that craft beer will primarily be consumed locally. Although craft brewers were initially modestly
successful, demand for craft beer has grown exponentially in the 21st century, as craft brewers have quadrupled their production since 2005 (2015 Annual Production, 2016, pp.2). The
doubling of craft beer’s market share during the same period suggests that this growth is specific
to the craft segment. Surprisingly, inflation-adjusted prices for both craft and generic beers have remained relatively stable throughout this period of rapidly changing demand (Ashenfelter et al, 2015). Thus, the Craft Beer Revolution represents a perplexing consumer phenomenon as
demand for craft beer has increased, both in absolute and relative terms, despite stable prices and a consistent cost disadvantage against national breweries.
Understanding the Craft Beer Revolution Anthropologically
4
phenomenon continues to defy widely recognized economic forces. Perhaps this is because an exclusively economic perspective ignores societal forces beyond economics which influence consumer behavior. For example, a society’s social structure can have a pronounced effect on economic outcomes by regulating the flow of information (Granovetter, 2005). Thus, this paper will investigate the Craft Beer Revolution through a broader, anthropological lens by considering how individuals’ collective experience of a socio-economically stratified society could influence
5
Literature Review
Demand shifts within economics
Given that the craft beer revolution represents a noticeable shift in national patterns of beer consumption, economic theory provides a useful framework for structurally analyzing this consumer phenomenon.
Macroeconomics typically considers demand as a function of price. When graphed, demand is usually shown as a curve which slopes downwards from left to right, thus showing that aggregate demand for a given product decreases as prices increase. Altering non-price variables such as consumer preferences or production technology may shift the curve left or right, indicating a change in demand at every price point along the curve (Graves, 2006).
In a macroeconomic framework, the exponential increase in aggregate demand during the craft beer revolution must be explained by falling prices or a significant industry change. Since prices have remained steady and, aside from the Craft Beer Revolution itself, no significant changes have occurred in the American beer industry, this consumer phenomenon is the result of evolving consumer tastes and preferences.
Differing interpretations of taste
Unfortunately, economics is ill-equipped to explain how or why mass consumer tastes and preferences change. Orthodox economic thought holds the taste for certain goods as a given, meaning that “when an explanation of economic phenomena reaches a difference in tastes between people…the problem is abandoned to whoever studies and explains tastes” (Stigler,
6
specific goods develop or dissipate, alternative ideas have attempted to explain changing tastes in economic terms. Notably, consumption capital theory argues that human tastes are universal and that both collective and individual ‘preferences’ for certain goods are simply reflective of
different patterns of consumption which render some goods more valuable than others (Stigler, 1977). For example, a trained violinist may value music more than the average person due to their enhanced appreciation of music which arises from the countless hours they have spent in practice. However, consumption capital theory is insufficient as it assumes the prior consumption of a good, while the development of a large scale consumer phenomenon such as the Craft Beer Revolution necessarily requires the incorporation of significant numbers of people who have never consumed the product before.
Biology also offers explanations for how preferences for certain flavors, and by extension edible products, may change over time. For example, Mennella argues that the development of tasting structures within the mouth and brain throughout life is responsible for children’s
predisposition to enjoy sweet and salty tastes and reject bitter tastes (2014). Thus, a change in human tasting structures could render a particular flavor tastier and create widespread demand for products which incorporate that flavor. However, a biological explanation for the Craft Beer Revolution would require a substantial genetic change to occur among a significant segment of the population. Given the recent nature of the Craft Beer Revolution, such a change is extremely unlikely to have occurred. Thus biology is unlikely to be able to offer a compelling explanation of the relatively novel national taste for craft beer.
Taste and conspicuous consumption
7
America’s 19th century ‘nouveau riche,’ Veblen challenged the economic argument that
individuals’ consumption is largely determined by the motivation to maximize utility given their
financial constraints (Trigg, 2001). Instead, he argued that, spurred by a society which attaches social status to wealth, people frequently consume in order to create the perception of wealth, often to the detriment of their actual wealth (Trigg, 2001). Specifically, individuals engage in “invidious consumption,” where they consume products beyond the means of less wealthy people, and “pecuniary emulation,” where they copy the consumption of people who occupy a
higher position on the socio-economic spectrum (Trigg, 2001, pp. 110). The concept of
conspicuous consumption is illustrated by the popularity of luxury items such as jewelry, which serve little functional purpose other than reflecting the supposed disposable wealth of the possessor, throughout the socio-economic spectrum. The pressure to create the perception of wealth is apparently felt more acutely felt by lower socio-economic classes, with working class people tending to spend a greater proportion of their income on luxury items such as jewelry and personal electronics (Charles et al, 2009).
Applying conspicuous consumption theory to modern product markets suggests that an association between a certain product and the economic elite may influence the broader
consumer base’s preference for that good, since its consumption creates the perception of
individual wealth. Thus, given that craft beer is popularly perceived as a luxury good
8 Beer consumption as an expression of class identity
The consumption of beer as an expression of identity is the critical link between
conspicuous consumption theory and the Craft Beer Revolution. As Giddens notes, in advanced capitalist societies, an increasingly large portion of individuals’ identities are constructed by the
consumption of goods and services (Giddens, 1991). A body of evidence suggests that beer is a culturally significant product which can be linked to important elements of drinkers’ identities. For example, the popular insistence on consuming locally brewed beer among Palestinians living in the West Bank illustrates how beer can be linked to national or ethnic identity. By drinking identifiably Palestinian beer, Palestinians protect their distinctive ethnic identity against the threat posed by Israeli settlement (Meneley, 2014).
Ethnographic studies of craft beer communities in the US suggest that drinking craft beer may be an expression of class identity. In his study of the San Antonio, TX, craft beer
community, Kremlick reveals the close ties between craft beer and wealth, as craft drinkers would frequently disparage generic beer with pejorative terms like, ‘cheap’ and ‘ratchet,’ which are commonly associated with the working class. Thus, by differentiating between craft and generic beer on the basis of their respective associations with class, San Antonio’s craft drinkers
could build their perceived socio-economic status via craft beer consumption. Assuming that this dynamic is reflective of American craft drinkers in general, Kremlick’s work suggests that class
has an important role in the way that craft beer is consumed.
Combining inter-disciplinary theoretical approaches
9
Beer Revolution. Ultimately, the consumer phenomenon can be understood economically as a shift in the demand curve, with drastically higher demand despite relatively stable prices. An anthropological approach via the application of Conspicuous Consumption Theory reveals how and why that shift may have occurred. Given craft beer’s association with wealth and the value American society places on personal wealth, individual consumers throughout the
10
Materials and Methods
Agent-based modelling
Models are representations of reality which abstract and simplify the important aspects of a particular situation in order to make it easier to understand (Box and Norman, 1987). A
familiar example are the solar system dioramas frequently made by schoolchildren, which depict the solar system as a series of paper balls which rotate around the ‘sun’. This paper employs an agent-based model, a type of model which consists of a series of agents who exist within a bounded environment. The behavior of these agents towards each other and their environment, as well the outcomes of these behaviors, are governed by a set of parameters and rules which are defined by the model’s user. Since they allow users to observe large numbers of individuals
acting by a common set of rules or influenced by the same systems, agent-based models are particularly helpful in examining “the conditions at the micro level that give rise to observed macro phenomena” (Richiardi, 2012, pp. 139).
Because of its ability to shed light on outcomes which arise from complex interactions between individuals and multiple systems, ABM has been particularly well utilized by
anthropologists studying the relationship between societies and the environment. Lansing’s
analysis of Balinese agriculture, which included a model of water distribution at various administrative levels, is a prominent example. This model, which considered factors such as nutrient depletion, infrastructure limitations, and vermin control, revealed that the traditional method of ‘water priests’ controlling irrigation for between 20 and 100 farms created the most
11
conditions. With the results of his model, West concluded that the traditional extended household type was likely persist on Burkina Faso’s Central Plateau, probably because it is well adapted to
environmental risks such as drought (West, 2009). Anthropologists have also used ABM to study how people respond to changing social and economic systems. Notably, Agar constructed
models of heroin epidemics in the American North-East revealed how Nixon’s ‘war on drugs’ created more complex and diverse systems of heroin production and distribution which emerged shortly after an initial decrease in the drug’s use (Agar, 2002). Thus, some precedent exists for using ABM to study the Craft Beer Revolution, as it is the product of a complex set of
interconnecting factors.
Overview of the model
This paper used NetLogo (version 6.0), an agent-based modelling program designed by Uri Wilensky from Northwestern University (1999). The program contains an array of sample models which can be extensively altered through the modification of the model’s coding
procedures. This paper’s model was created by heavily modifying the “AIDS” sample in order to
simulate the transfer of preferences among members of a socio-economically stratified society. The model consisted of a set of agents whose ‘preference’ for craft or generic beer would
continually change in accordance with their own behavior and interactions with fellow agents. A complete copy of the model’s coding procedures is including in Appendix 4.
The model’s agents, known as ‘turtles’ within the program, are representative of beer drinkers in reality. For every experiment, each agent was assigned a core set of Boolean (true or false) variables1 which refer to critical elements of conspicuous consumption theory, namely
12
class (lower, middle or upper) and a preference for a particular cultural choice. Thus, each agent had a unique profile of individual variables which indicated their socio-economic status and whether they had a preference for craft beer. Whilst the agents’ preference could change throughout a simulation, socio-economic class remained constant.
The agents existed on a two dimensional ‘map’ which possessed an x and y axis capable of describing agents’ horizontal and vertical location respectively. Each time a fictional unit of
time passed in the model, each agent would move to a new, randomly selected area of the map. If two turtles occupied the same area on the map, they had a 50% chance of ‘coupling’. If either
turtle in the couple had a preference for craft beer, the craft-preferring agent had a chance to create or renew their partner’s preference for craft beer. This socially-based preference transfer mechanism is consistent with Kremlick’s claim that craft beer drinkers are first introduced to the
product by an existing craft beer drinker in a social setting such as a bar or party (2016).
In order to make the preference transfer mechanism compliant with Conspicuous
Consumption Theory, the outcomes of interactions between agents were class based. Firstly, the baseline likelihood of creating or renewing the preference for craft beer was approximated by the assumed strength of the association between the product and wealth, with a stronger association resulting in a higher probability. Craft beer’s association with wealth was used to derive this baseline likelihood to represent the claim that people are motivated to consume in order to create the perception of wealth, with an additional assumption that people are more powerfully
13
wealthy supposedly conspicuously consume in a way that is beyond the means of lower classes, upper class turtles were more likely to adopt craft beer from an upper class partner than any other kind of partner.
In addition to the preference transfer mechanism, the model also contained a ‘preference regression’ mechanism intended to act as a negative feedback loop. As each unit of time passed
in the model, agents could spontaneously lose their preference for craft beer, with the probability of regression increasing with the length of time that an agent had held the preference. This mechanism serves to emulate the fact that consumers have a finite amount of disposable income but nearly infinite other, competing wants. The model assumes that the preference for craft beer is externally generated and that this preference will eventually disappear over time without external validation. The regression mechanism accounted for the fact that middle and upper class consumers tend to have more disposable income by increasing the amount of time that middle and upper class agents were likely to sustain the preference for craft beer without reinforcement.
Overview of Experiments Conducted
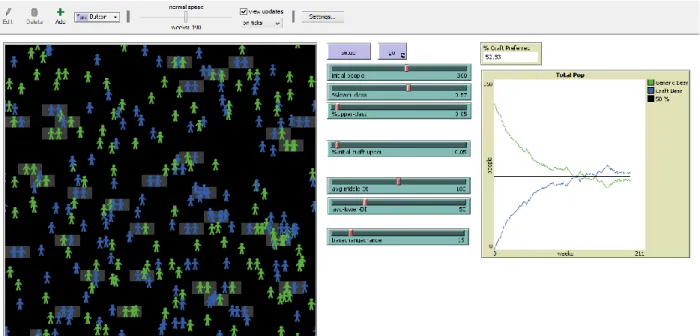
The model’s interface features a series of sliders which allow for the easy manipulation of the model’s parameters2. Preliminary testing of the model indicated that the class
stratification parameters and association between craft beer and wealth had a substantial effect on the prevalence of the preference. Importantly, preliminary testing also revealed that adjusting the “disposable income” of the middle and lower classes had a negligible effect on the popularity
of craft beer. As shown in Table 1, these variables were each given three possible values to create nine potential scenarios in total. In order to avoid creating a deterministic model, the three
14
potential values for the base preference change chance were assigned so that none of the agents’
behaviors or interactions had a certain outcome. The three potential values for class stratification were chosen to represent the past, present and the future class breakdown of the American population per Gallup polls (Newport, 2015). In order to generate a statistically relevant amount of data, the nine potential scenarios were run ten times each.
Table 1:Summary of experimental scenarios
Figure 1:Agent Based Model User Interface
Low
= 28% low, 67%
middle, 5% high
Medium
= 42% low, 53%
middle, 5% high
High
= 57% low, 38%
middle, 5% high
Low
= 5%
C1-S1 C1-S2 C1-S3
Medium
= 10%
C2-S1 C2-S2 C2-S3
High
= 15%
C3-S1 C3-S2 C3-S3
Stratification
15
Results
Individual experiment results
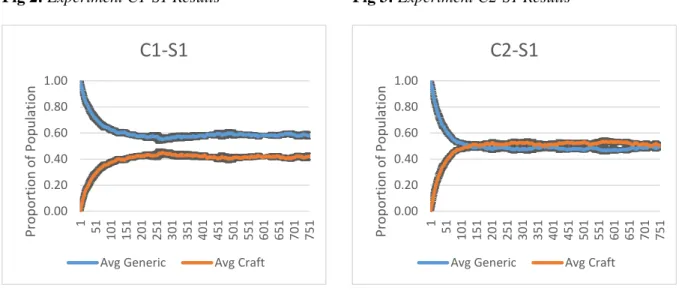
Figures 2 through 10 display the relative proportions of generic and craft beer drinkers over time for the nine different experimental conditions, with the proportions and time
represented on the x and y axes respectively. Each graph’s generic (shown in blue) and craft
16
Fig 2: Experiment C1-S1 Results Fig 3: Experiment C2-S1 Results
Fig 4: Experiment C3-S1 Results Fig 5: Experiment C1-S2 Results
Fig 6: Experiment C2-S2 Results Fig 7: Experiment C3-S2 Results
0.00 0.20 0.40 0.60 0.80 1.00 1 51
101 151 201 251 301 351 401 451 501 551 601 651 701 751
Pro p o rtio n o f Po p u lat ion
C1-S1
Avg Generic Avg Craft
0.00 0.20 0.40 0.60 0.80 1.00 1 51
101 151 201 251 301 351 401 451 501 551 601 651 701 751
Pro p o rtio n o f Po p u lat ion
C2-S1
Avg Generic Avg Craft
0.00 0.20 0.40 0.60 0.80 1.00 1 51
101 151 201 251 301 351 401 451 501 551 601 651 701 751
Pro p o rtio n o f Po p u lat ion
C3-S1
Avg Generic Avg Craft
0.00 0.20 0.40 0.60 0.80 1.00 1 51
101 151 201 251 301 351 401 451 501 551 601 651 701 751
Pro p o rtio n o f Po p u lat ion
C1-S2
Avg Generic Avg Craft
0.00 0.20 0.40 0.60 0.80 1.00 1 51
101 151 201 251 301 351 401 451 501 551 601 651 701 751
Pro p o rtio n o f Po p u lat ion
C2-S2
Avg Generic Avg Craft
0.00 0.20 0.40 0.60 0.80 1.00 1 51
101 151 201 251 301 351 401 451 501 551 601 651 701 751
Pro p o rtio n o f Po p u lat ion
C3-S2
17
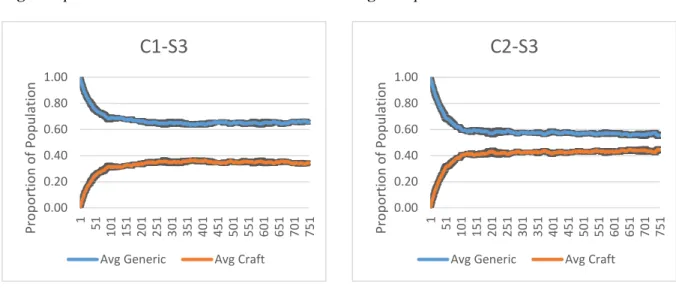
Fig 8: Experiment C1-S3 Results Fig 9: Experiment C2-S3 Results
Fig 10: Experiment C3-S3 Results
0.00 0.20 0.40 0.60 0.80 1.00 1 51
101 151 201 251 301 351 401 451 501 551 601 651 701 751
Pro p o rtio n o f Po p u lat ion
C1-S3
Avg Generic Avg Craft
0.00 0.20 0.40 0.60 0.80 1.00 1 51
101 151 201 251 301 351 401 451 501 551 601 651 701 751
Pro p o rtio n o f Po p u lat ion
C2-S3
Avg Generic Avg Craft
0.00 0.20 0.40 0.60 0.80 1.00 1 51
101 151 201 251 301 351 401 451 501 551 601 651 701 751
Pro p o rtio n o f Po p u lat ion
C3-S3
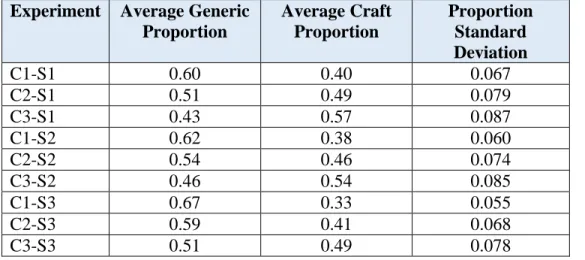
18 Summary of results
Table 2:Summary of experiment results
Experiment Average Generic Proportion
Average Craft Proportion
Proportion Standard Deviation
C1-S1 0.60 0.40 0.067
C2-S1 0.51 0.49 0.079
C3-S1 0.43 0.57 0.087
C1-S2 0.62 0.38 0.060
C2-S2 0.54 0.46 0.074
C3-S2 0.46 0.54 0.085
C1-S3 0.67 0.33 0.055
C2-S3 0.59 0.41 0.068
19
Analysis of Results
Stratification Data
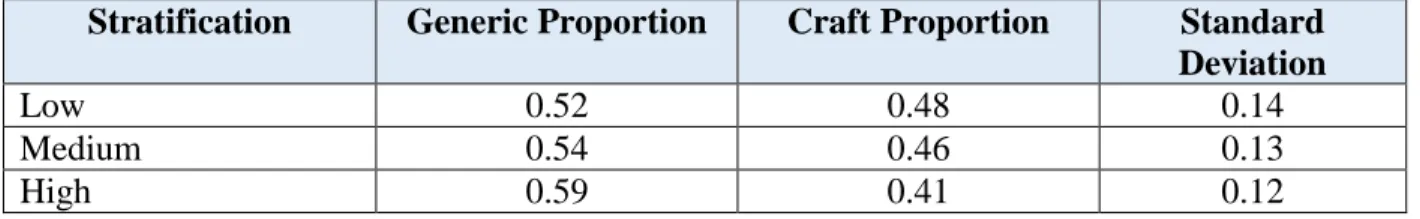
To analyze the relationship between stratification and the popularity of craft beer, simulations with the same stratification parameters but different association parameters were pooled together. A pattern demonstrated in Figures 2, 5 and 8 of craft beer becoming less popular as stratification increased was present in all pools. This trend suggests a negative correlation between stratification and the prevalence of a preference for craft beer, implying that, all else equal, craft beer becomes less popular as stratification increases. In order to more rigorously evaluate the relationship between stratification and beer preference independently of base chase, the pools’ results were numerically analyzed.
Table 3: Average craft and generic proportions by stratification pool
Stratification Generic Proportion Craft Proportion Standard
Deviation
Low 0.52 0.48 0.14
Medium 0.54 0.46 0.13
High 0.59 0.41 0.12
The values in Table 3 quantify the relationship between craft beer popularity and
20 Association Data
To evaluate the effect of the effect of an association with wealth on craft beer’s
popularity, the results were grouped into association-based pools in a similar way to the stratification groups previously described. The increase in the popularity of craft beer from the low pool to the high pool demonstrates a positive correlation between the association and the prevalence of the preference for craft beer. Considering Conspicuous Consumption Theory, this relationship is intuitive, as people will demand more a product that offers to create the perception of high socio-economic status through its consumption. The pools were also subjected to
numerical analysis.
Table 4: Average craft and generic proportions by association pool
Association Generic Proportion Craft Proportion Standard
Deviation
Low 0.63 0.37 0.11
Medium 0.54 0.46 0.13
High 0.46 0.54 0.14
The data in Table 4 confirms that association and craft proportion are positively
correlated, as craft beer’s popularity in the high pool was 24% and 17% greater than the low and medium pools respectively. A two-proportion single tailed z-test determined that these
21
Discussion
Stratification
The data generated by the model suggests that stratification has a depressive effect on the popularity of craft beer, with highly stratified simulations consistently preferring craft beer at lower rates than other simulations, all other things equal. This finding is superficially consistent with standard economic models which claim that a sizeable middle class is a strong predictor of a society’s aggregate consumption, particularly of luxury goods (Ozturk, 2016). However, this
claim is anchored in the assumption that the increased disposable income of the middle class is responsible for growth in luxury spending. However, given that preliminary testing revealed that disposable income was a relatively minor factor in the model, its results indicate that the middle class as a cultural rather than financial category has a critical role in sustaining a luxury
consumption phenomenon such as the Craft Beer Revolution. Perhaps this is because, in a society with a large culturally recognized middle class, consumers are pressured and motivated by their numerous middle class peers to consume craft beer for status. In contrast, in highly stratified societies with small middle classes, this pressure is substantially reduced and thus consumers have little motivation to consume craft beer over any of the other goods or services they may want.
22
in order to profit from booms and minimize their losses during lean times. Furthermore, whilst the model is directly concerned with craft beer, its results could be reasonably applied to other products, such as artisanal cheeses or cigars, which are associated with wealth and frequently consumed in social settings. Thus, managers in these industries should similarly take advantage of changes in socio-economic conditions to gain a competitive advantage. Finally, given the control that governments have over wealth distribution and corporate taxation, law makers have the opportunity to take advantage of conspicuous consumption and enrich the public.
Governments, particularly those in developing countries, with rapidly growing middle classes should be prepared to tax the impending boom in luxury industries to pay for a variety of public services.
Association with Wealth
The results of the model demonstrate that a strong association between craft beer and wealth is extremely conducive to the development of a widespread preference for craft beer. In light of Conspicuous Consumption Theory, this finding is intuitive; in a society where people consume to seem wealthy, products which are strongly associated with wealth will be more popular. However, a stronger association between craft beer and wealth also made the popularity of craft beer more erratic. This particular relationship between craft beer’s association with wealth and the variability of its popularity was unforeseen and deserves further inquiry.
23
desirable ways. For example, universities could develop a strong association between grand acts of philanthropy and wealth to more powerfully encourage wealthy alumni to donate. However, decision makers should use the findings carefully as despite its profitable applications, using an association with wealth to manipulate the popularity of a product may cause accessibility issues for working class people.
Role of ABM in Findings
For this paper, agent based modelling once again proved its worth as an anthropological tool. The findings regarding the effects of stratification and craft beer’s association with wealth on the popularity of the product was dependent on the analysis of a sufficiently large sample of trials with identical conditions. Since conditions on Earth vary so wildly across time and space, collecting such a sample from real life cases is impossible. Furthermore, the analysis required the creation of experimental conditions, in terms of stratification and association values, which may not currently exist. Thus, agent based model was invaluable in analyzing the Craft Beer
Revolution as the product of a set of interacting societal forces.
Limitations of the Model
Although it generated helpful data, the nebulous nature of socio-economic class and the model’s static treatment of craft beer’s association with wealth constitute shortcoming’s which
affect the reliability of the model.
24
education, rather than a readily observable characteristic, the model’s effort to divide society into
neat, mutually exclusive classes is imprecise (Berg and Ono, 2009). Whilst the model’s design could have used measurable attributes such as income to derive class breakdown, these
approximations would essentially be arbitrary as they would ignore the other factors which contribute to class. Hence, the model used a statistically sound survey of people’s self-perceived
economic class as the best available source to determine the relative sizes of socio-economic classes.
The model’s design also failed to account for any dynamism in craft beer’s association with wealth. The model treat’s craft beer’s association with wealth as static. Whilst this
relationship currently exists, it may change over time as people’s perception of the product may
change due to popular use of the product. Thus, the model is liable to become less relevant as popular views change over time. Additional research into how an association between a product and wealth changes and incorporating the findings into the model would help overcome this shortcoming and allow for a more complete understanding of the craft beer revolution.
The final notable shortcoming of this model, and agent-based modelling more broadly, is its assumption that humans are consistent decision makers. A fundamental feature of the model’s design is that agents’ behavior is strictly governed by a set of rules. However, this adherence to
rules is not entirely consistent with reality, as human decision making is irrational or governed by multiple, conflicting sets of ‘rules’ (De Martino et al, 2006). However, this discrepancy does not significantly discount the model’s value, as its results are still informative so long as people
25
Conclusion
The Craft Beer Revolution is a confounding consumer phenomenon in strictly economic terms, as the craft segment has flourished despite stable prices and a consistent cost
disadvantage. This paper sought to leverage anthropology as an additional analytical lens to understand how the market could sustain demand for craft beer under depressive economic conditions.
Analysis of the Craft Beer Revolution involved applying Conspicuous Consumption Theory to the consumer phenomenon via an agent based model in order to understand how the product’s interaction with the socio-economic hierarchy could influence levels of demand. This
model produced a set of statistically significant results which indicate that a society’s level of socio-economic stratification and an association between craft beer and wealth strongly influence the popularity of the product. Whilst stratification negatively impacted popularity, craft beer’s association with wealth drove demand up. Thus, despite its limitations, the model suggests that the origin of the Craft Beer Revolution may rest in the existence of a large middle class and a sufficiently strong association between craft beer and wealth.
The findings of this paper are significant for a variety of reasons. The most obvious is its commercial applications, as companies capable of understanding how social class could
influence demand for a product have a considerable competitive advantage. More importantly, this paper is capable of advocating for the relevance, perhaps even necessity, of anthropology in discussing important phenomena, including major commercial events. This advocacy is
26
Works Cited
Acitelli, Tom. The Audacity of Hops: The History of America’s Craft Beer Revolution, Chicago Review Press, 2013.
Agar, Michael. Reisinger, Heather. “A Tale of Two Policies: The French Connection,
Methadone, and Heroin Epidemics”. Culture, Medicine and Psychiatry, vol. 26, no. 3, 2002, pp. 371-396.
Ashenfelter, Orley. Hosken, Daniel. Weinberg, Matthew. “Efficiencies brewed: pricing and consolidation in the US beer industry.” The RAND Journal of Economics, vol. 46, no. 2, 2015, pp. 328-361.
Born, Georgina. “Making Time: Temporality, History, and the Cultural Object.” New Literary
History, vol. 46, no. 3, 2015, pp. 361-386.
Berg, Justin. Ono, Hiromi. The Encyclopedia of Human Relationships. Edited by Harry Reis and Susan Sprecher, Sage Publications, 2009.
Bourdieu, Pierre. Distinction: A Social Critique of the Judgement of Taste. Translated by Richard Nice, Harvard University Press, 1979.
Box, George. Draper, Norman. Empirical Model-Building and Response Surfaces. John Wiley & Sons, 1987.
Charles, Kerwin Kofi. Hurst, Erik. Roussanov, Nikolai. “Conspicuous Consumption and Race”.
27
De Martino, Benedetto. Kumaran, Dharshan. Seymour, Ben. Dolan, Raymond. “Frames, Biases, and Rational Decision-Making in the Human Brain”. Science, vol. 313, no. 5787, 2006, pp. 684-687.
Granovetter, Mark. “The Impact of Social Structure on Economic Outcomes”. Journal of
Economic Perspectives, vol. 19, no. 1, 2005, pp. 33-50
Graves, Philip. Sexton, Robert. “Demand and Supply Curves: Rotations versus Shifts.” Atlantic
Economic Journal, vol. 34, no. 3, 2006, pp. 361-364.
Hindy, Steve. The Craft Beer Revolution: How a Band of Brewers is Transforming the World’s Favorite Drink, St Martin’s Griffin, 2014.
Hong, Judy. “Artisanal Appeal: The Rise of Craft”. Goldman Sachs Research, 2016. Accessed
November 2016.
Kremlick, Keith. Crafting an identity: Value, practice, and the making of a craft beer community in San Antonio, Texas. The University of Texas at San Antonio, 2016. Web. Accessed September 2016.
Lansing, Stephen. Priests and Programmers: Technologies of Power in the Engineered Landscape of Bali. Princeton University Press, 2009.
Meneley, Anne. “Resistance is Fertile!” Gastronomica: The Journal of Critical Food Studies,
vol. 14, no. 4, 2014, pp. 69-78.
Mennella, Julie. “Ontogeny of taste preferences: basic biology and implications for health”.
28
Newport, Frank. “Fewer Americans Identify as Middle Class in Recent Years”. Gallup, 2015.
Accessed March 2017.
Ozturk, Ayse. “Examining the economic growth and the middle-income trap from the
perspective of the middle class”. International Business Review, vol. 25, no. 3, 2016, pp. 726-738.
Richiardi, Matteo. “Agent-based computational economics: a short introduction.” The
Knowledge Engineering Review, vol. 27, no. 2, 2012, pp. 137-149.
“Self-Distribution Laws”. American Brewers Association, 2016. Accessed December 2016.
Stigler, George. Becker, Gary. “De Gustibus Non Est Disputandum.” The American Economic
Review, vol. 67, no. 2, 1977, pp. 137-149.
Trigg, Andrew. “Veblen, Bourdieu, and Conspicuous Consumption”. Journal of Economic
Issues, vol. 35, no. 1, 2001, pp. 99-115.
West, Colin Thor. “Domestic Transitions, Desiccation, Agricultural Intensification, and Livelihood Diversification among Rural Households on the Central Plateau, Burkina Faso”. American Anthropologist, vol. 111, no. 3, 2009, pp. 275-288.
Wilensky, Uri. NetLogo. 1999.
29
Appendix 1:Model variables
Agent variables
Variable Description
Lower class Class assignments mutually exclusive Upper class
Middle class Agents not assigned lower or upper class are assumed middle class.
Craftbeer? If true, the agent has a preference for craft beer
Global variables
Variable Description
Basechangechance
Class stratification The relative proportions of agents that are lower, middle and upper class.
Middle-DI The fictional disposable income of middle
class agents
Lower-DI The fictional disposable income of lower
30
Appendix 2:two-proportion single tailed z-tests for stratification pool comparisons
H0: meanlow stratification ≥ meanmedium stratification
H1: meanlow stratification < meanmedium stratification
alpha = .05
Value
Low stratification mean 0.52
Low stratification sdev 0.14
Medium stratification mean 0.54
Medium stratification sdev 0.13
Pooled proportion 0.53
Standard Error 0.015
T-stat -1.79
P value .04
Reject H1. Accept meanlow stratification < meanmedium stratification
H0: meanmedium stratification ≥ meanhigh stratification
H1: meanmedium stratification < meanhigh stratification
alpha = .05
Value
Low stratification mean 0.54
Low stratification sdev 0.14
Medium stratification mean 0.59
Medium stratification sdev 0.12
Pooled proportion 0.57
Standard Error 0.015
T-stat -3.38
P value < 0.01
31
Appendix 3:two-proportion single tailed z-tests for association pool comparisons
H0: meanlow association ≥ meanmedium association
H1: meanlow association < meanmedium association
alpha = .05
Value
Low association mean 0.47
Low association sdev 0.14
Medium association mean 0.55
Medium association sdev 0.13
Pooled proportion 0.51
Standard Error 0.015
T-stat 5.37
P value 0.037
Reject H1. Accept meanlow association < meanmedium association
H0: meanmedium association ≥ meanhigh association
H1: meanmedium association < meanhigh association
alpha = .05
Value
Medium association mean 0.55
Medium association sdev 0.13
High association mean 0.63
High association sdev 0.11
Pooled proportion 0.59
Standard Error 0.015
T-stat 5.68
P value .037
32
Appendix 4:model’s coding procedures
globals [
prefchange-chance ;; The chance out of 100 that craftbeer? agent will pass on preference ]
turtles-own [ middle-DI lower-DI lower-class upper-class middle-class
craftbeer? ;; If true, the person has preference for craft beer. prefchange-length ;; How long the person has had the preference. coupled? ;; If true, the person is in a couple.
couple-length
partner ;; The person that is our current partner in a couple. ]
;;;
;;; SETUP PROCEDURES ;;;
33
to setup-globals
set prefchange-chance basechangechance ;; base chance of craft beer preference developing is 10
set symptoms-show 50 ;; symptoms show up 200 weeks after prefchange set slider-lowerclass %lower-class
set slider-upperclass %upper-class end
;; Create carrying-capacity number of people half are righty and half are lefty ;; Also assigns colors to people with the ASSIGN-COLORS routine.
to setup-people
create-turtles initial-people
[ setxy random-xcor random-ycor set known? false
set coupled? false set partner nobody ifelse random 2 = 0
[ set shape "person righty" ] [ set shape "person lefty" ]
;;Establishes classes per sliders on interface
set lower-class (who < initial-people * %lower-class) set upper-class (who > initial-people * (1 - %upper-class))
;; Seeds initial craft drinkers per sliders on interface
set craftbeer? (who >= initial-people * (1 - %upper-class * %initial-craft-upper))
if craftbeer?
34
assign-commitment assign-gregariousness assign-color ]
end
;; Giving characteristics to turtles
to assign-color ;; turtle procedure ifelse not craftbeer?
[ set color green ] [ ifelse known? [ set color red ] [ set color blue ] ] end
;; The following four procedures assign core turtle variables. They use ;; helper procedures so that the turtle variables have an
;; approximately "normal" distribution around the average values
to assign-commitment ;; turtle procedure set commitment 5
end
to assign-gregariousness ;; turtle procedure set gregariousness 5
end
35
repeat 40
[ set result (result + random-float center) ] report result / 20
end
to assign-middle-DI
set middle-DI random-normal avg-middle-DI 10 end
to assign-lower-DI
set lower-DI random-normal avg-lower-DI 10 end
;;;
;;; GO PROCEDURES ;;;
to go
if all? turtles [known?] [ stop ]
ask turtles [ if craftbeer?
[ set prefchange-length prefchange-length + 1 ] if coupled?
[ set couple-length couple-length + 1 ] ] ask turtles
[ if not coupled? [ move ] ]
;; Righties are always the ones to initiate mating. This is purely ;; arbitrary choice which makes the coding easier.
36
[ if not coupled? and shape = "person righty" and (random-float 10.0 < gregariousness) [ couple ] ]
ask turtles [ uncouple ] ask turtles [ l-prefchange ] ask turtles [ u-prefchange ] ask turtles [ m-prefchange ] ask turtles [ u-regress ] ask turtles [ m-regress ] ask turtles [ l-regress ] ask turtles [ assign-color ] tick
end
;; People move about at random.
to move ;; turtle procedure rt random-float 360 fd 1
end
;; People have a chance to couple depending on their tendency to have sex and ;; if they meet. To better show that coupling has occurred, the patches below ;; the couple turn gray.
to couple ;; turtle procedure -- righties only! let potential-partner one-of (turtles-at -1 0)
with [not coupled? and shape = "person lefty"] if potential-partner != nobody
37
set coupled? true
ask partner [ set coupled? true ] ask partner [ set partner myself ]
move-to patch-here ;; move to center of patch
ask potential-partner [move-to patch-here] ;; partner moves to center of patch set pcolor gray - 3
ask (patch-at -1 0) [ set pcolor gray - 3 ] ] ] end
;; If two peoples are together for longer than either person's commitment variable ;; allows, the couple breaks up.
to uncouple ;; turtle procedure
if coupled? and (shape = "person righty") [ if (couple-length > commitment) or
([couple-length] of partner) > ([commitment] of partner) [ set coupled? false
set couple-length 0
ask partner [ set couple-length 0 ] set pcolor black
ask (patch-at -1 0) [ set pcolor black ] ask partner [ set partner nobody ] ask partner [ set coupled? false ] set partner nobody ] ]
end
;; Preference changing procedures
to u-prefchange
38
[ ifelse ([upper-class] of partner)
[ if random-float 100 < (prefchange-chance + 65) ;; higher chance of spreading to middle and lower class
[ ask partner [ set craftbeer? true ] ] ] [ if random-float 100 < prefchange-chance [ ask partner [ set craftbeer? true ] ] ] ] end
to l-prefchange
if coupled? and craftbeer? and lower-class
[ ifelse ([upper-class] of partner) OR not ([lower-class] of partner)
[ if random-float 100 < (prefchange-chance - 10) ;; middle and upper class partners have greater chance
[ ask partner [ set craftbeer? true ] ] ] [ if random-float 100 < prefchange-chance [ ask partner [ set craftbeer? true ] ] ] ] end
to m-prefchange
if coupled? and not (lower-class OR upper-class) [ ifelse ([upper-class] of partner)
[ if random-float 100 < (prefchange-chance - 5) ;; middle class turtles have decreased chance of pref spreading to upper class
[ ask partner [ set craftbeer? true ] ] ] [ ifelse ([lower-class] of partner)
[ if random-float 100 < (prefchange-chance + 50) ;; middle class turtles have increased chance of pref spreading to lower class
39
;;Negative Feedback Loops
to test ;; turtle procedure
if prefchange-length > symptoms-show [ if random-float 100 < 1
[ set craftbeer? false ] ] end
to u-regress
if (upper-class) and (craftbeer?)
[ if (count turtles with [craftbeer? and lower-class] / count turtles with [lower-class] * 100) > random-normal 65 10
[ set craftbeer? false ] ] end
to m-regress
if not (lower-class OR upper-class) and (craftbeer?) [if prefchange-length > middle-DI
[ if random-float 100 < 1 [ set craftbeer? false ] ] ] end
to l-regress
if (lower-class) and (craftbeer?) [if prefchange-length > lower-DI [ if random-float 100 < 2
40
;;;
;;; MONITOR PROCEDURES ;;;
to-report %craftbeerpreferred ifelse any? turtles
[ report (count turtles with [craftbeer?] / count turtles) * 100 ] [ report 0 ]
end
;;; Tick counter stop
to time-out
if ticks >= 100 [stop] end