Sharif University of Technology
Scientia IranicaTransactions A: Civil Engineering http://scientiairanica.sharif.edu
Loading frequency eect on dynamic properties of
mixed sandy soils
A. Aghaei Araei
a;and A. Ghodrati
ba. Road, Housing and Urban Development Research Center (BHRC), Geotechnical Department, Tehran, P.O. Box 13145-1696, Iran. b. Road, Housing and Urban Development Research Center (BHRC), Institute of Building and Housing, Tehran, Iran.
Received 24 September 2016; received in revised form 9 January 2017; accepted 11 March 2017
KEYWORDS Frequency; Mixed sandy soils; Triaxial;
Shear modulus; Damping ratio.
Abstract. Most previous studies have focused on pure (clean) sands, silts, and clays; no concrete and diligent eort has been made to understand dynamic behaviors of natural sandy soils. The purpose of this paper is to evaluate the eect of loading frequency, as one of the most important factors, on the dynamic properties, especially stiness and damping characteristics of natural sandy soils mixed with silt and gravel. For this purpose, 40 dynamic triaxial tests were carried out on the cylindrical samples prepared from three mixed sandy materials. Cyclic tests were performed using large triaxial apparatus under dierent connement conditions, waveforms, and loading frequencies. Results showed that shear modulus and damping ratio were dependent on conning pressure and loading frequency. Shear modulus and damping ratio increased as loading frequency increased. Moreover, the shear modulus increased as conning pressure increased; however, damping ratio decreased. However, the eect of triangular, sinusoidal, and rectangular waveforms on the dynamic behavior was negligible. In the studied ranges of strains, the eects of the number of cyclic loadings and excess pore water pressure over G=Gmax and D were negligible. There
are considerable dierences between the obtained results of the tested soils and literature results, even for almost the same loading frequencies.
© 2018 Sharif University of Technology. All rights reserved.
1. Introduction
Sand is rarely found clean and pure in natural deposits and is usually found in composition of clay, silt, and gravel. Most previous researches have concentrated on uniform clean sands, or sands with little nes. Pub-lished results are inconclusive in clarifying the eect of added nes on sands. It has been reported that, due to particle size disparity and the availability of pores larger than the added particles, some ne particles can
*. Corresponding author. Tel.: +98 21 88255942; Fax: +98 21 88255942
E-mail addresses: [email protected] (A. Aghaei Araei); [email protected] (A. Ghodrati)
doi: 10.24200/sci.2017.4209
occupy a part of the void space and, eventually, play little or no part in the response of the mixtures [1,2]. The gravel content also plays an important role in dynamic behavior of sand mixture [3,4]. However, it should be recognized that the existence of fractions of clay, silt, and gravel could aect sand's behavior remarkably. On the other hand, an increase in demand of the alluvial deposits and response spectra in cities' microzonation projects highlights the importance of studying the dynamic behavior of shallower layers. The exact information and knowledge of strain-dependent shear modulus (G ), damping ratio (D ), and low strain shear modulus of the studied materials is necessary in such analyses.
Almost none of G and D relationships was available for soils containing large particles up until when Seed et al. [5] published results of large-scale
(diameter about 300 mm) cyclic triaxial tests. Over the three past decades, results have become available to many investigators. These studies are limited to the tests performed under loading frequency less than 0.2 Hz. More results have become available in recent years to other researchers, yet most of them were carried out under low frequency loading (less than 0.2 Hz).
Previous tests results on soils were obtained under the following conditions: undisturbed and reconsti-tuted specimen, loading frequency from 0.01 to 0.2 Hz, conning pressure from 29 to 490 kPa, sample density from 27 to 95 percent, applied cycles number from 3 to 12 cycles, ne contents from 0 to 9 percent, and maximum grain size from 10 to 150 mm.
Strong motion records from the recent earth-quakes, including 1994 Northridge, 1995 Kobe, 1999 Chi-Chi, and 2003 Bam events, have shown the impor-tance of local site conditions in the propagated ground motions [6]. One-dimensional site response analysis is widely performed to account for local site eects during an earthquake [7-9]. The dynamic soil properties have been assumed to be frequency independent in most of these approaches.
Laboratory test results, including non-resonance method in Resonant-Column (RC) test, undrained cyclic torsional simple shear tests using hollow cylin-drical torsional shear apparatus, cyclic triaxial, ben-der element, model tests including shake table, and centrifuge as well as in-situ soil-specic nonlinear dy-namic properties back-calculated from vertical array records during earthquake, show that shear modulus and damping ratio are dependent on the frequency of loading [6]. Owing to the limited available data for dierent soils at low strain, Park and Hashash assumed that only the small strain shear modulus and damping ratio are frequency dependent [9]. However, the dependency of soil dynamic properties on frequency even at low strain is not modelled clearly.
The linear theory of viscoelasticity can describe the low strain mechanical behavior of soils exposed to dynamic excitation accurately. This theory is able to accurately simulate, from a phenomenological point of view, two important features exhibited by soils undergoing harmonic oscillations: their ability to store, and, at the same time, to dissipate strain energy over a nite period of time [10-12]. An important consequence of reformulating the low strain dynamic properties of soils, within the framework of the theory of viscoelasticity, is that the velocity of propagation of body waves, in particular, shear wave (or shear modulus), and the material damping are not two independent parameters [6]. Their functional coupling is a direct consequence of material dispersion, a phenomenon by which, in viscoelastic media, the velocity of propagation of mechanical disturbance has
to be frequency dependent in order to satisfy the fun-damental principle of causality [6]. As a result of their mutual dependence, shear modulus and damping in soils should be measured simultaneously, even though, in current geotechnical engineering testing practice, these two parameters are determined separately [10,13]. In addition, Khan et al. [14] showed that the dynamic properties of soils exhibiting strong visco-elastic behavior cannot be considered to be frequency independent in the earthquake frequency bandwidth (< 30 Hz) [11], even for low strain level excitations [10] as is (happens to be) the common practice in geotech-nical engineering [15].
Results of numerical analysis show that the greater part of earthquake energy is in the frequency range of 1 to 5 Hz [16]. However, all the cyclic deviator stresses using triaxial tests, in earlier studies, were applied in uniform sinusoidal cycles at frequencies of up to 0.2 Hz [17]. The low frequency may be selected in order to measure the deformation accurately. ASTM D3999 [18] recommended the frequency variation be-tween 0.1 and 2 Hz. Zhang et al. [19] indicated that there is a signicant discrepancy at small strain levels between the recommended D curve and test data for Dminat dierent loading frequencies of sands and
ne-grained soils.
Earthquake ground motion simulation with frequency-dependent soil properties, conducted by Meng [11] and Park and Hashash [9], demonstrates that the dynamic properties of soils play an important role in the near surface earthquake ground motion analyses and need to be used in the same way as they were measured. The above-mentioned studies were limited to the ne-grained and pure sands at low shear strains. A study conducted by Aghaei Araei et al. [20] on gravel materials with ne content ranges from 0 to 49% under loading frequency range of 0.1 to 1 Hz shows that damping value at loading frequency of 1 Hz at low strain is much higher than the corresponding results presented by Seed et al. [5] and Rollins et al. [17].
Maheshwari [21] performed strain controlled undrained cyclic triaxial tests to evaluate shear mod-ulus and damping ratio of the Solani sand. The tests' results showed that the frequency of loading does not have a signicant eect on the normalized modulus in the test range of shear strain. However, the damping ratios are aected to some extent by the frequency of loading, as higher damping ratios are observed at higher frequencies [21].
Extensive triaxial testing by Aghaei Araei et al. [22-24] on gravels (e.g., frequency and conning pressure range from 0.1 to 10 Hz and 100 to 1500 kPa, respectively) revealed that the shear modulus and, especially, the damping ratio behaviors are inuenced by the loading frequency. An increase in loading fre-quency increases shear modulus at low strain; however,
the eect of frequency decreases as strain increases. The damping ratio increases considerably by increasing the loading frequency. The shear modulus increases remarkably by increasing the conning pressure; how-ever, the damping ratio negligibly changes [22-24]. Ling et al. [25] studied the dynamic shear modulus and damping ratio of compacted sand subjected to freeze-thaw cycle under multi-stage cyclic loading. The results indicated that the dynamic shear modulus increases with the increasing initial water content, temperature, loading frequency, and conning pres-sure [25].
Therefore, the reassessment of the loading fre-quency eects over other materials, such as natural sands, silts, and clays, via laboratory test is necessary not only at low strain, but also at medium and high strains via simultaneous measurement of shear modulus and damping ratio. By considering limitations of available suitable laboratory test results and available facilities, such as large-scale triaxial apparatus, in the Geotechnical laboratory at BHRC, it is useful to carry out an investigation to determine their behavior in order to have safe and economic designs and construc-tions.
Despite many experimental eorts made on ne-grained and sandy soils, there is only limited infor-mation about the behavior of mixed natural sandy soils under dierent loading frequencies. This research focuses on the eects of dierent parameters, especially loading frequency, waveforms, and conning pressure on dynamic behavior (i.e., shear modulus and damping ratio) of compacted natural sandy materials using large-scale triaxial equipment. Moreover, these results were compared to behavior curves available in the literature for similar soils in site response analyses, namely [7,26,27].
2. Material properties
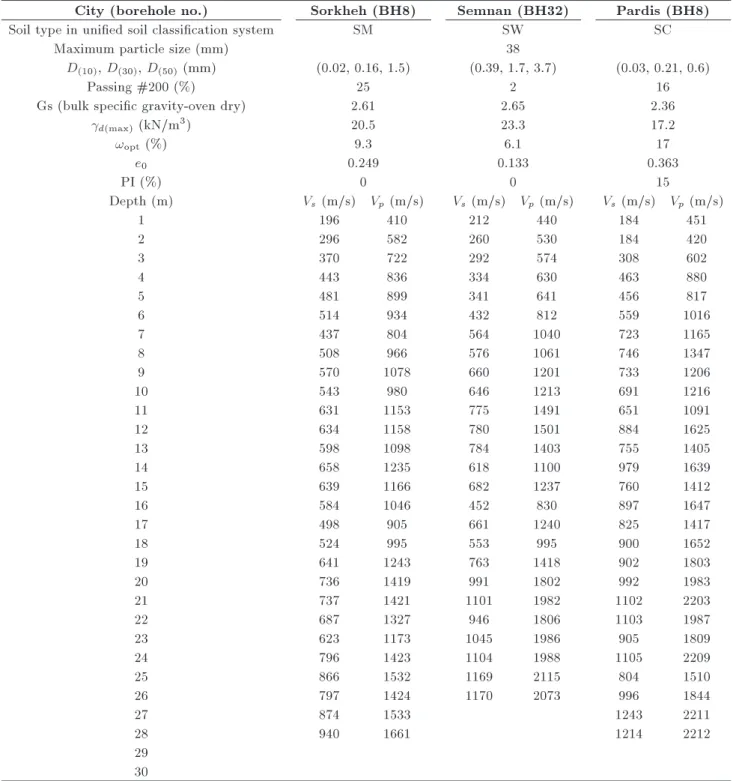
In this study, the tested samples (three soils types) were obtained from the drilling boreholes form three cities in Iran. Characteristics of the used soils were unied and similar in the whole log proles. Table 1 presents the main characteristics of tested materials, including soil type in Unied Soil Classication System, size distribution, specic gravity, dry density and optimum water content, minimum void ratio, plasticity index and P=S wave velocity values. SM, SW, and SC were coarse grains (sand) and obtained from three boreholes related to Sorkheh, Semnan, and Pardis cities. The gradation curves of the materials for triaxial testing were obtained with maximum particle sizes of 38 mm (about 1/6 diameter of large-scale triaxial specimen, which is 200 mm). SM, SW, and SC materials consist of 25, 2, and 16% ne grains, and passing percentage from sieve no. 4 (4.75 mm) is equal to 65, 57, and 86%,
respectively. The maximum dry densities and optimum water contents were evaluated for samples according to the standard proctor (ASTM D698 [28]). Specic gravity (Gs) ranges from 2.39 to 2.69, and minimum
void ratio (e0) varies from 0.133 to 0.363 for the tested
materials.
3. Dynamic testing programs
Several specimens of dierent materials were prepared and tested under dierent conning pressure condi-tions. The range of conning pressures in testing was chosen with respect to the experienced stresses' levels in soil prole (100 kPa for shallow layers, 200 kPa for intermediate layers and 500 kPa for deep layers). These tests were conducted on specimens on a large scale with 200 mm diameter and 400 mm height under dierent loading frequencies using the large-scale triaxial equipment. In all tests, a non-contact high sensitivity deformation transducer and two load cells were used. One of them was located outside the test cell and the other (the submersible type load cell) inside the cell. Deformation non-contact strain sensors were located on the both sides of the top plate in order to determine the average strain and eliminate the rotational component. These techniques exclude friction in the loading piston from measurements. All dynamic cyclic tests were performed according to ASTM D3999 [18] under eective conning pressures of 100, 200, and 500 kPa at frequencies of 0.5, 1, 2, 5, and 10 Hz, respectively. Eects of triangular, sinusoidal, and rectangular waveforms were also investigated over dynamic properties at dierent loading frequencies. The sinusoidal waveform was the main one in all cyclic triaxial tests; however, triangular and rectangular loading waveforms were applied at the three shear strain levels (low, medium, and large strains). About 40 tests were performed under dierent conditions on cylindrical specimens.
4. Testing procedure
The weight proportion of various grain sizes required to achieve the material grain size distributions was determined by the weight of each specimen. The specimens were prepared according to maximum dry density through adding optimum moisture content. In this study, specimens were prepared with their natural gradation and density due to representing the initial state of soils. The soil layers in the nature are neither completely dry nor saturated, but a state between these conditions. On the other hand, tested materials were obtained from the boreholes of the aged deposits. According to geological analysis of the studied regions, these deposits experienced relatively strong earthquakes and almost reached their maximum
Table 1. The characteristics of sandy materials used in cyclic triaxial tests.
City (borehole no.) Sorkheh (BH8) Semnan (BH32) Pardis (BH8)
Soil type in unied soil classication system SM SW SC
Maximum particle size (mm) 38
D(10), D(30), D(50)(mm) (0.02, 0.16, 1.5) (0.39, 1.7, 3.7) (0.03, 0.21, 0.6)
Passing #200 (%) 25 2 16
Gs (bulk specic gravity-oven dry) 2.61 2.65 2.36
d(max)(kN/m3) 20.5 23.3 17.2
!opt(%) 9.3 6.1 17
e0 0.249 0.133 0.363
PI (%) 0 0 15
Depth (m) Vs (m/s) Vp(m/s) Vs(m/s) Vp(m/s) Vs(m/s) Vp(m/s)
1 196 410 212 440 184 451
2 296 582 260 530 184 420
3 370 722 292 574 308 602
4 443 836 334 630 463 880
5 481 899 341 641 456 817
6 514 934 432 812 559 1016
7 437 804 564 1040 723 1165
8 508 966 576 1061 746 1347
9 570 1078 660 1201 733 1206
10 543 980 646 1213 691 1216
11 631 1153 775 1491 651 1091
12 634 1158 780 1501 884 1625
13 598 1098 784 1403 755 1405
14 658 1235 618 1100 979 1639
15 639 1166 682 1237 760 1412
16 584 1046 452 830 897 1647
17 498 905 661 1240 825 1417
18 524 995 553 995 900 1652
19 641 1243 763 1418 902 1803
20 736 1419 991 1802 992 1983
21 737 1421 1101 1982 1102 2203
22 687 1327 946 1806 1103 1987
23 623 1173 1045 1986 905 1809
24 796 1423 1104 1988 1105 2209
25 866 1532 1169 2115 804 1510
26 797 1424 1170 2073 996 1844
27 874 1533 1243 2211
28 940 1661 1214 2212
29 30
density. The results have been veried using standard proctor (ASTM D698 [28]). Therefore, in order to simulate the real conditions of deposits and implement the same procedure, the specimens were been prepared in their maximum dry density by adding optimum moisture content. The sample materials were divided into four parts. Each layer was compacted in a split mold by means of a compactor with the frequency of 60 cycles/sec. The loading was applied under initial
isotropic condition (consolidation pressures). Due to extra cost, time required, and simplicity in using only one specimen, the cyclic shear tests were typically performed using a staged approach. At rst, a limited number of cycles (i.e., 40 cycles), with the given wave-forms and loading frequencies, were applied at a very small strain level. Test results for cycles 1 to 40 were recorded by the data acquisition. Due to preparing the samples at the optimum moisture content, the
water lls almost all empty space between the grains, theoretically (i.e., zero void ratio). Therefore, it can be expected that pore water pressure be produced during cyclic loading at medium and high strain levels. However, its value is very low, compared to the satu-rated samples (less than 10%). Generally, according to ASTM D3999 [18], the specimen drainage valves open after each stage of cyclic loading to re-establish the eective consolidation stress or maintain the existing excess pore water pressure before moving on to the next higher cyclic load or deformation level. However, excess pore water pressure is generated during the cyclic loading (ASTM D3999 [18]); however, all of the calculations were performed based on the initial eective stress at the studied strain levels. The excess pore water pressure produced during this cyclic loading was dissipated by opening the drainage valve so that the original eective stresses could be retrieved. This procedure was then repeated for higher strain levels (about twice the initial amplitude) until the maximum shear strain level was attained. When the pore pressure was released due to opening the drainage valve, the volume of the specimen may decrease; thus, the sample became a little denser. The change in volume depends on the number of strain cycles applied, sample type, and axial strain amplitude. It was found that the amount of change in density was negligible for small strain amplitudes and was still very small even for strain amplitudes of up to 0.1% if the number of strain cycles was limited [5]. Therefore, it is believed that the re-use of samples for higher strain amplitudes still gives reasonably good results if the number of strain cycles applied is limited [5]. Axial loads, vertical displacements, volume changes, and pore pressures were measured at periodic intervals of 0.04, 0.02, 0.01, 0.004, and 0.002 seconds, respectively, for the applied load with frequencies of 0.5, 1, 2, 5, and 10 Hz in undrained conditions. Table 2 summarizes the charac-teristics of triaxial testing program including conning pressure, loading frequency, number of loading cycles and samples prepared.
5. Cyclic test results
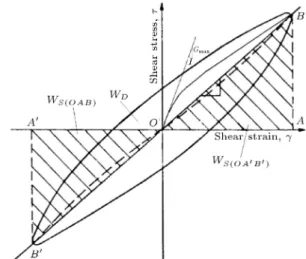
Tests results, including shear modulus and damping ratio versus shear strains, have been calculated based on the stress-strain hysteresis loop (see Figure 1) for
Figure 1. Calculation of shear modulus and damping ratio based on the stress-strain hysteresis loop.
the 1st to 40th cycles, according to ASTM D3999 [18]. The following equations were used to calculate shear strain and shear modulus:
E = 2"
a;
= (1 + v)"1;
G =2(1 + v)E ; (1) where E is Young modulus, is shear stress, "1 is
axial strain, is shear strain, and v is Poisson's ratio. Poisson's ratio, v, is measured based on the following equation for specimens in an unsaturated condition:
v = (Vp=Vs)2 2
2(Vp=Vs)2 1; (2)
where Vp and Vs represent the velocities of P and
S waves in the studied boreholes proles. Poisson's ratio, v, was calculated with respect to various depths of soil proles of the tested materials; then, their average values were considered in calculations. The Poisson's ratio was equal to 0.29 for the three materials. For example, the specimen (e.g., SM) tested under conning pressure of 100 kPa was prepared from the depths of 6 to 10 m of the soil prole. The average value of Poisson's ratio at these depths is equal to 0.29. The average value of Poisson's ratio for SW and SC
Table 2. The characteristics of triaxial testing program performed on mixed sandy soils according to ASTM D3999 [17]. Material symbol 0
3 (kPa) Number of cycles Frequency of loading (Hz) Total tests no.
SM 100, 200, 500 40 0.5, 1, 2, 5, 10 15
SW 100, 200, 500 40 1, 2, 5, 10 10
SC 100, 200, 500 40 0.5, 1, 2, 5, 10 15
specimens tested under conning pressure of 100 kPa is also equal to 0.29.
The hysteresis damping ratio (the word hysteresis means \lag" or \delay" and comes from ancient Greek) or the time-lag between a driven cyclic stress and driven strain is calculated as follows:
D =2(W WD
S(0AB)+ WS(0A0B0)) 100(%); (3)
where WD is the energy dissipated in one cycle of
loading, and Ws is the maximum strain energy stored
during the cycle.
5.1. Frequency-dependent shear modulus Results of G versus shear strain at conning pressures of 100, 200, and 500 kPa and loading frequencies of 0.5, 1, 2, 5, and 10 Hz for SM, SW, and SC materials are presented in Figure 2. The measured strain range is about 0.0001 to up 1%. According to Figure 2, at low strain amplitudes, the shear modulus is nearly constant and at its highest value, Gmax; however, it
decreases as the strain amplitude increases. The eect of loading frequency on shear modulus at all strain levels is remarkable. Generally, the shear modulus increases as loading frequency increases, especially at the low strains. However, for some materials, as shear strain increases, the eect of loading frequency on the values of G decreases; the rate of increase in G at low strains is higher than the corresponding value at a higher strain. The amplitude of strain values decreases in higher loading frequencies (e.g., 5 Hz and 10 Hz).
Contrary to the observed behavior for gravelly materials [24], the frequency of loading had a signicant impact on G at strain levels higher than 0.01%. In general, at low and medium strain levels, an increase in loading frequency causes dispersion in G curve and an increase in G. The conning pressure has a considerable eect on strain values. As expected, the higher the value of conning pressure is, the lower the amount of shear strain will be. Therefore, system performance in applying shear strains is highly aected by frequency and conning pressure.
5.2. Frequency-dependent maximum shear modulus
Many eorts have been made by researchers to develop equations for estimating maximum shear modulus, Gmax. High sensitive non-contact coiled deformation
transducers located on the opposite sides of the top plated are used to measure the average strain and eliminate the rotational component. The maximum range of measurement is 2.5 mm with accuracy of less than 0.001 mm. In this study, the extrapolation method was employed from 0.0001% strain to obtain Gmax for the material (which is also used in [5,24]).
For this purpose, the following equation has been used
to determine Gmax:
Gmax= A:f(e):(03)n; f(e) = (2:17 e)2=(1 + e);
(4) where A and n are the empirical constants, and e is the material void ratio. Gmax values of SM, SW,
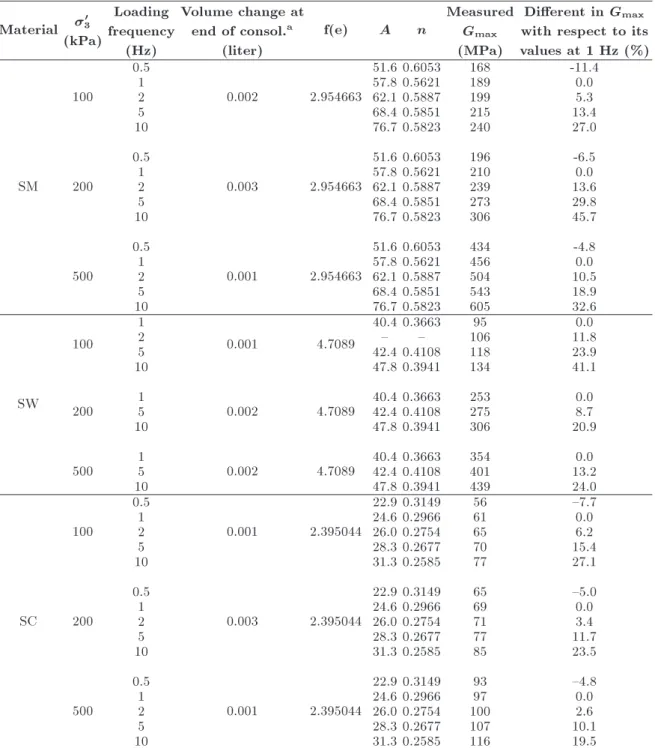
and SC materials under dierent conning pressures and loading frequencies are presented in Table 3. The material void ratio at the end of specimen consolida-tion is one of the most crucial parameters in Gmax
estimation using experimental equations (e.g., [5,29]. The void ratio at the end of specimen consolidation is determined by measuring the volume change due to drainage after applying the isotropic conning pressure. As presented in Table 3, the variation of void ratio due to consolidation is negligible because of preparing the specimens at optimum moisture content. Gmax,
A, and n values are determined by plotting G=f(e) versus conning pressure in the logarithmic form (the relationship between parameters is assumed to be linear in this method).
According to Table 3, Gmax=f(e) value increases
as conning pressure and loading frequency increase. The rate of shear modulus (due to loading frequency) increases by increasing the conning pressure. The dierence of Gmax with respect to its values at 1 Hz
(%) varies from 11:4 to 45.7, from 8.7 to 41.1, and from 7:7 to 27.1% for SM, SW, and SC, respectively. The extent of variations in Gmax could not be due
to the test errors (testing tools or measuring errors). Constants A and n are also presented in Table 3. A and n constants range from 22.9 to 76.7 and 0.2585 to 0.6053, respectively.
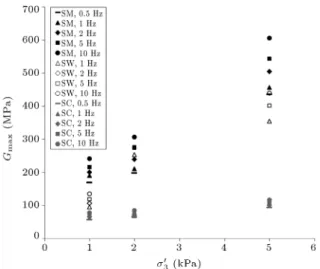
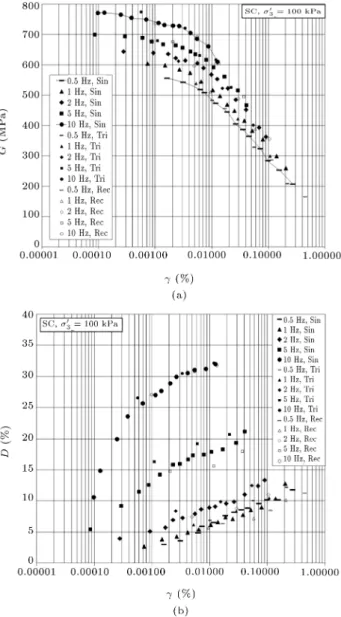
Results of Gmax under dierent conning
pres-sures for loading frequencies of 0.5, 1, 2, 5, and 10 Hz for SM, SW, and SC materials are presented in Figure 3. It is observed that SC material is less aected by loading frequency and has the lowest shear modulus value among the tested materials. The conning pressure has also the least eect on the maximum shear modulus of this material. SM material, Gmax, showed
the maximum dependency on loading frequency and conning pressure compared to the three other tested materials. SM material has the highest Gmax.
5.3. Frequency-dependent G=Gmax
Generally, in practice, shear modulus, G, is more applicable than maximum shear stress, Gmax. Thus,
the variations of G=Gmax for soils under various
circumstances have great importance. G=Gmax
curves presented by Seed and Idriss [7] have been used by many researchers and engineers for many years. In addition, the variations of G=Gmax
of sands for dierent plasticity indices have been presented in EPRI [26]. Furthermore, Kokusho [27] proposed G=Gmax relationship for non-plastic sands
Figure 2. Results of shear modulus versus shear strain at dierent conning pressures and loading frequencies: (a) SM, (b) SW and (c) SC.
Table 3. Gmax values for SM, SW, and SW materials under dierent conning pressures and loading frequencies.
Material 30
(kPa)
Loading frequency
(Hz)
Volume change at end of consol.a
(liter)
f(e) A n
Measured Gmax
(MPa)
Dierent in Gmax
with respect to its values at 1 Hz (%)
SM
100
0.5
0.002 2.954663
51.6 0.6053 168 -11.4
1 57.8 0.5621 189 0.0
2 62.1 0.5887 199 5.3
5 68.4 0.5851 215 13.4
10 76.7 0.5823 240 27.0
200
0.5
0.003 2.954663
51.6 0.6053 196 -6.5
1 57.8 0.5621 210 0.0
2 62.1 0.5887 239 13.6
5 68.4 0.5851 273 29.8
10 76.7 0.5823 306 45.7
500
0.5
0.001 2.954663
51.6 0.6053 434 -4.8
1 57.8 0.5621 456 0.0
2 62.1 0.5887 504 10.5
5 68.4 0.5851 543 18.9
10 76.7 0.5823 605 32.6
SW
100
1
0.001 4.7089
40.4 0.3663 95 0.0
2 { { 106 11.8
5 42.4 0.4108 118 23.9
10 47.8 0.3941 134 41.1
200 15 0.002 4.7089 42.4 0.410840.4 0.3663 253275 0.08.7
10 47.8 0.3941 306 20.9
500 15 0.002 4.7089 42.4 0.410840.4 0.3663 354401 13.20.0
10 47.8 0.3941 439 24.0
SC
100
0.5
0.001 2.395044
22.9 0.3149 56 {7.7
1 24.6 0.2966 61 0.0
2 26.0 0.2754 65 6.2
5 28.3 0.2677 70 15.4
10 31.3 0.2585 77 27.1
200
0.5
0.003 2.395044
22.9 0.3149 65 {5.0
1 24.6 0.2966 69 0.0
2 26.0 0.2754 71 3.4
5 28.3 0.2677 77 11.7
10 31.3 0.2585 85 23.5
500
0.5
0.001 2.395044
22.9 0.3149 93 {4.8
1 24.6 0.2966 97 0.0
2 26.0 0.2754 100 2.6
5 28.3 0.2677 107 10.1
10 31.3 0.2585 116 19.5
aconsol.: consolidation.
(P I = 0). In this study, the extrapolation method was employed from 0.0001% strain to obtain Gmax
for the materials. Subsequently, the normalized shear modulus, G=Gmax, under dierent conning pressures
and loading frequencies was obtained. Then, with respect to Gmax and density, the shear wave velocity
can be obtained. Results of G=Gmaxversus shear strain
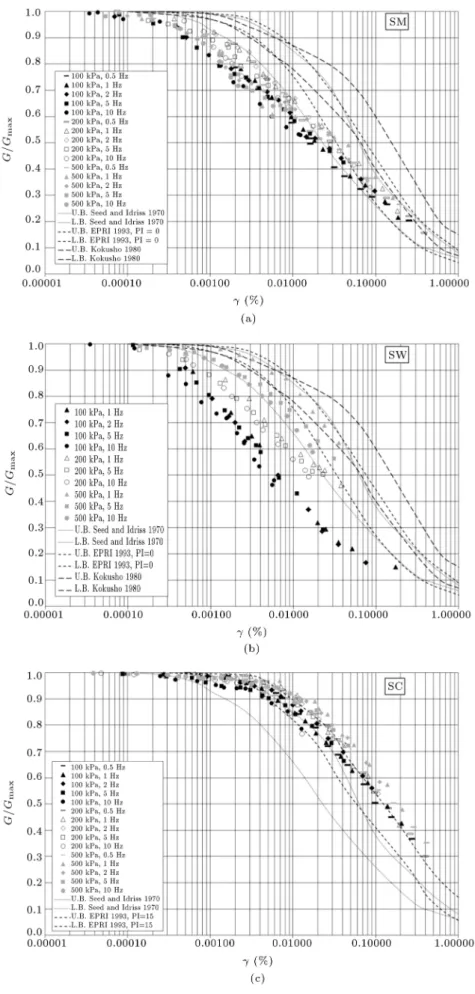
under conning pressures of 100, 200, and 500 kPa and loading frequencies of 0.5, 1, 2, 5, and 10 Hz for SM, SW, and SC materials are presented in Figure 4. The proposed curves by Seed and Idriss [7], EPRI [26], and
Kokusho [27] are also shown in the gure. Generally, at certain shear strain, as conning pressure increases, G=Gmax increases. There is a reverse trend against
increasing loading frequency in all tested specimens; the value of G=Gmax, at certain strain, decreases as
loading frequency increases. According to Figure 4, most of data points are located out of the pervious curves. The values of G=Gmax for the SM material
are less than the lower bound of Seed and Idriss [7]. On the other hand, G=Gmax of the SC material is
Figure 3. Variation of Gmax versus conning pressures at
loading frequencies of 0.5, 1, 2, 5, and 10 Hz.
In general, SM and SC are less aected by conning pressure. The remarkable variation of G=Gmax for SW
material is an interesting point.
5.4. Frequency-dependent damping ratio
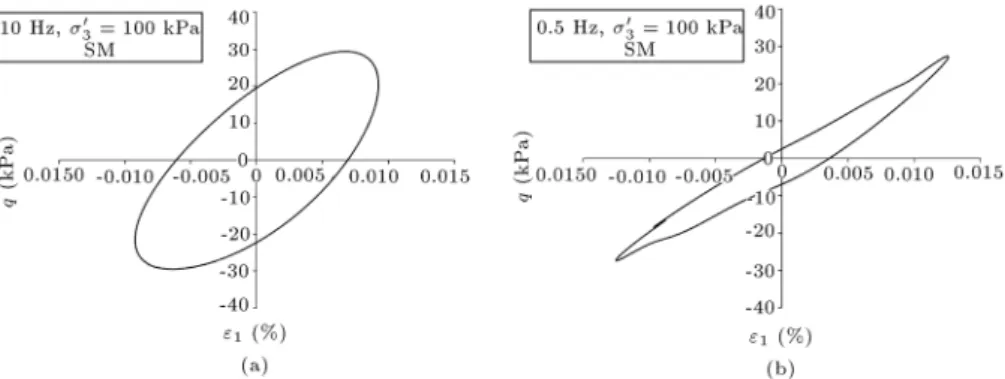
Figure 5, for instance, shows stress-strain hysteresis loop at almost the same amplitude of deviator stress for SM material under 0
3= 100 kPa at the 10th cycle and
loading frequencies of 0.5 and 10 Hz. Similar results are also obtained for SM under dierent conning pres-sures. There are some dierences in the hysteresis loop; an elliptical shape may be observed at high loading frequency. The obtained hysteresis loop indicates the importance of loading frequency in damping results.
Mechanisms contributing to material damping are friction between soil particles, inertia of particles, viscosity of soil skeleton, and viscosity of pore uid. Among them, it is perceived that the inertia acting on the individual soil particles and the system as a whole reduces the contact surface between the particles and to disturb the stable structure and orientation of grains, causing energy dissipation. In addition, dynamic loading at a higher strain rate may lead to the impact between the particles (particle collision), and the parti-cles' decreasing tendency in volume (settlement) results in greater interaction between them, causing large energy dissipation [30-32]. Generally, the higher shear modulus obtained from resonant column and bender element tests, compared to triaxial and torsional shear tests, may be a result of higher loading frequency eect. Frequency eect on damping that was not observed in triaxial and torsional shear element tests in a previous research can be explained as follows: most of element tests are performed at very low frequencies of less than 1 Hz. In this range, perhaps, the eect of frequency is negligible except for a creep eect, which may be observed at a very low frequency. Generally, in the resonant column test, damping was measured under
free vibrations. It is not necessary for the behavior of the material to be the same under free and forced vibrations, and the material in forced vibration might not dissipate energy as expected, according to the minimum principle. Recent test results have shown a high damping ratio even at low strain levels (< 0:001%) in non-resonant column tests [10,14]. All of the cyclic deviator stresses in earlier studies were applied to uniform sinusoidal cycles at frequencies of up to 0.2 Hz [17]. The low frequency may be selected to measure the deformation as well as machine limitations accurately.
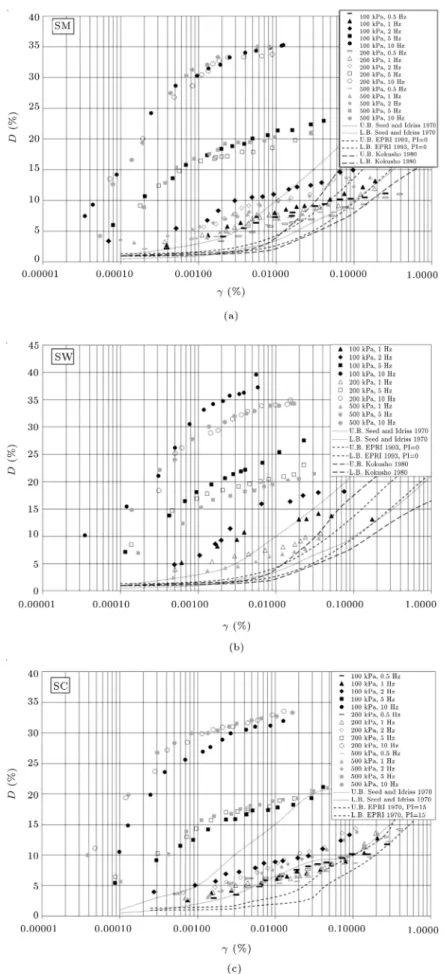
Results of damping ratio versus shear strain at conning pressures of 100, 200, and 500 kPa and loading frequencies of 0.5, 1, 2, 5, and 10 Hz for SM, SW, and SC materials are presented in Figure 6. The damping ratios of the studied soils are not signicantly aected by conning pressures. However, damping ratio decreases as conning pressure increases. It is worth mentioning here that by increasing the loading frequency, damping ratio increases not only at low strain, but also at medium and high strain levels. It appears that the damping value at any loading frequency reaches a plateau value.
Generally, the damping ratio versus shear strain of the studied materials, under loading frequency of 0.5 Hz, falls almost in the range identied previously. However, at higher loading frequencies (5 and 10 Hz), the damping ratios completely fall above the upper bound trend observed by previous studies (see Figure 6).
Comparison of D results of the studied mate-rials and the proposed curves by Seed and Idriss [7], Kokusho [27], and EPRI [26] for sands shows that data points of damping ratio are located almost out of upper bound proposed by Seed and Idriss [7]. There-fore, a signicant dierence was observed between the amounts of damping behavior of the studied materials with results available in the literature. This must be because previous studies have been performed and focused on pure sands. This could be another reason for highlighting the importance of the study on sands in decomposition of other grains, such as clay, silt, and gravels. In general, at higher shear strain levels, only insignicant amount of the data corresponding to loading frequencies of 0.5, 1, and 2 Hz are within the specied ranges. The maximum measured damping ratio for tested mixed sandy specimens at optimum moisture content was 40%. The maximum observed damping ratio at low strains was less than 10%. The reduction of damping ratio for the studied materials (less than 40%), compared with gravelly material (45%, [24]), is possibly due to maximum grain size, ne content, grains inertia, and also moisture content conditions. As a conclusion, when implementing the proposed D curves, conning pressure, plasticity
Figure 5. Stress-strain hysteresis loop for SM material at 0
3= 100 kPa and the 10th cycle under loading frequencies of
0.5 and 10 Hz.
index, maximum particle size, soils type, and loading frequency in particular should be considered.
5.5. Eect of conning pressure
The specimens of sandy materials were prepared and tested under dierent conning pressure conditions, as mentioned previously. According to the reviewed literature and the results of large triaxial tests, the eects of conning pressure on shear modulus are more pronounced than the other parameters. The results indicate that shear modulus (especially in SM materi-als) increased with an increase in conning pressure. In general, SM and SC are less aected by conning pressure. The remarkable variation of G=Gmax for SM
material is an interesting point. The damping ratios of the tested specimens are not signicantly aected by conning pressures and, thus, decrease slightly as conning pressure increases.
5.6. Eect of loading waveform
There are dierent sources of vibration with dierent waveforms, such as trac, machine, sea wave, and earthquake loading. There is not much research in the literature concerning the eects of frequency and waveform on the behaviors of natural sands. The eect of waveforms on G and D has been investigated at dierent conning pressures and loading frequencies. For this purpose, sinusoidal, triangular, and rectan-gular waveforms were applied to SM, SW, and SC specimens at the loading frequency ranging from 0.1 to 10 Hz. The deviator stress versus time under dierent waveforms for SW material under conning pressure of 500 kPa and loading frequency of 1 Hz is presented in Figure 7(a). The deviator stress versus axial strain is also shown in Figure 7(b). Despite the fact that the waveforms are dierent in appearance, they produce almost the same hysteresis loop. Therefore, in this study, shear modulus and damping ratio of the tested materials have been calculated using Eqs. (1) to (3).
The results of shear modulus and damping ratio for dierent waveforms are presented in Figure 8. According to Figure 8, the loading waveform has minor
eect on shear modulus of the tested materials. Gen-erally, shear modulus related to triangular waveform has greater values than sinusoidal and rectangular waveforms. Results also showed that damping ratio of triangular waveform is higher than that of the sinusoidal and rectangular waveforms. Aghaei Araei et al. [24] reported the opposite trend for gravelly materials.
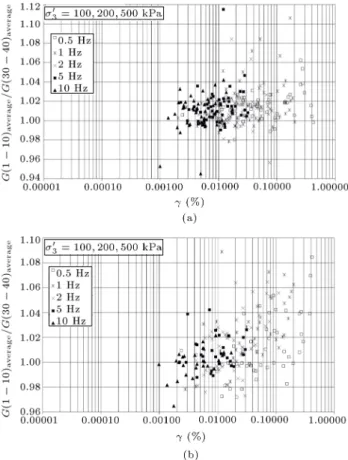
5.7. Eect of number of cycles
The eect of the number of cycles has been taken into consideration by many researchers. The increasing number of applied cycles may aect the damping ratio and shear modulus at medium and large strain levels [5,7]. This subject is also considered in this study. Figure 9, for instance, shows the test results including the eects of the number of cycles on G value (i.e., G10=G40; G10= modulus G for the 10th cycle, and
G40= modulus G for the 40th cycle) versus shear strain
for the tested specimens under sinusoidal waveform of mixed sandy materials. Generally, the values of G10=G40 increased at strain between 0.01 and 0.5%.
The values of G10=G40 are between 0.94 and 1.12 for
strain less than 0.1%. The value of G10=G40increased
slightly at shear strain higher than 0.1%. Variations of D10=D40 (D10 = damping (D) for the 10th cycle and
D40 = damping for the 40th cycle) versus shear strain
for the tested specimens under sinusoidal waveform of mixed sandy materials are also shown in Figure 9. This gure indicates that the eects of the number of cycles on damping ratio are negligible, too. However, the variations of D10=D40 range from 0.96 to 1.10 (for
strain up to 0.1%). As a result, it appears that G10=G40
and D10=D40 results were not signicantly aected by
the number of cycles (up to strain less than 0.1%) for the mixed sandy materials. It must be noted that the number of cycles does not aect the general trend of G and D curves, especially at low strains [24]. 5.8. Excess pore water pressure and pore
pressure ratio
Figure 6. Results of damping ratio versus shear strain at dierent conning pressures and loading frequencies: (a) SM, (b) SW, and (c) SC.
Figure 7. The eect of waveform: (a) Deviator stress versus time and (b) deviator stress versus axial strain.
during the cyclic test under dierent conditions. The increase in excess pore water pressure may aect the values of dynamic parameters, including shear modulus and damping ratio. For this reason, its value must be considered during the tests. Pore water pressure in the specimen has been measured directly using a very sti electronic pressure transducer. Axial loads, vertical displacements, volume changes, and pore pressures were measured at periodic intervals of 0.04, 0.02, 0.01, 0.004, and 0.002 seconds, respectively, for the applied load with frequencies of 0.5, 1, 2, 5, and 10 Hz in undrained conditions, as mentioned previously. Figure 10, for instance, shows the generated excess pore water pressure during cyclic loading test for SM materials under conning pressure of 500 kPa at dierent loading frequencies. Generally, the generated pore water pressure was negligible, especially at high frequency (e.g., 5 and 10 Hz) due to the preparation of samples at their optimum moisture content, as
Figure 8. Results of (a) G and (b) D at conning pressures of 100 kPa under loading frequencies of 0.5, 1, 2, 5, and 10 Hz and sinusoidal, triangular, and rectangular waveforms of SW specimen.
expected (see Figure 10). An increase in the loading frequency leads to the increase of the generated EPWP during cyclic loading triaxial tests at high strain levels ( > 0:1%). However, the maximum observed EPWP was less than 8 kPa (at higher stress amplitude for low frequency loading, e.g., 0.5 Hz) and could not inuence shear modulus and damping ratio results. The variations of excess pore water pressure at the 40th cycle versus shear strain of the studied mixed sandy materials are also shown in Figure 11. The variations are presented for tests under dierent conning pres-sures and loading frequencies. It appears that the pore water pressure is not aected by the loading frequency and is only proportional to the strain level. The eect of strain level increased as conning pressure increased. The maximum measured generated excess pore water
Figure 9. Eect of the number of cycles on (a) G10=G40
and (b) D10=D40results versus shear strains of the mixed
sandy specimens under sin wave.
Figure 10. The time history of the generated excess pore water pressure through cyclic loading for SM materials under conning pressure of 500 kPa at dierent loading frequencies.
pressure in cyclic tests was negligible and less than 9 kPa. The variations of pore pressure ratio (Umax=30)
at dierent levels of shear strain for the 40th cycle are also shown in Figure 12. According to Figure 12, the amount of pore pressure ratios was less than 7 percent in all studied strain levels.
Figure 11. Variations of excess pore water pressure at the 40th cycle versus shear strain of the mixed sandy materials.
Figure 12. Variations of pore pressure ratio at dierent levels of shear strain under dierent conning pressures and loading frequencies at the 40th cycle.
5.9. Volume change and axial displacement The volume change often has been reduced by opening drainage valve in triaxial tests. Thus, the sample will be denser slightly. As mentioned before, any volume change depends on axial strain level, saturation degree, number of applied cycles, and soil type. The change in density is negligible for the small strain. It was still very small even for strain amplitudes of up to 0.1% if the number of strain cycles was limited [5]. The variations of volume change versus shear strain at the end of each loading step under dierent conning pressures and loading frequencies for tested materials are shown in Figure 13. According to Figure 13, water ows in or out of the cylindrical sample by opening the drainage valve depending on the conning pressure and saturation degree. The reduction in the volume of the released water by an increase in conning pressure
Figure 13. Variations of volume change versus shear strain under dierent conning pressures and loading frequencies at the 40th cycle.
is an interesting point. Moreover, the highest degree of variation in the volume change occurred at low frequencies (0.5 and 1 Hz). Test results of the mixed sandy materials indicate that the maximum observed volume change due to drainage of the specimen is 0.006 Liter and has value of 0.004 Liter at axial strain 0.1%. The total volume of a cylindrical specimen with a diameter of 20 and 40 cm in height is 12.566 Liter. The maximum volume change observed in specimens e, is less than 0.05 percent of their total value. Therefore, the change in the void ratio of specimens e, is less than 0.05 percent, and variation of f(e) will be even less. Therefore, variations in f(e) have been ignored for the shear strain above 0.1% for these high compacted specimens. Moreover, the maximum observed strains in specimens were negligible (except for specimen under loading frequency of 0.5 Hz at shear strain greater than 0.1%) due to the high density of the tested samples. Volume change in percent at shear strain of 0.1% is less than 0.3%. Moreover, the change in density due to drainage is less than 1% at shear strain of 0.1%. According to ASTM D3999 [18] and ASTM D4015 [32], a soil material typically behaves like an elastic solid exhibiting a nondestructive response to the application of cyclic loading below a threshold axial strain level of < 0:01%, and many measurements of the same specimen may be made with various states of ambient stress. Therefore, it is believed that the re-use of samples for higher strain amplitudes (i.e., up to 0.1%) still gives reasonably good results if the number of strain cycles applied is limited.
Figure 14 shows the variations of permanent axial displacement versus shear strain under dierent conning pressures and loading frequencies at the 40th cycle. Generally, the observed permanent axial strains at higher loading frequencies (e.g., 5 and 10 Hz) are smaller than lower frequencies (e.g., 0.5 Hz). According
Figure 14. Variations of permanent axial displacement versus shear strain under dierent conning pressures and loading frequencies at the 40th cycle.
to Figure 14, the axial permanent displacements at the last stage of cyclic loading under frequency of 5.0 Hz are greater than 2 mm, which rarely reach 1 mm for shear strains less than 0.01%. Therefore, the tests may be made on the same specimen for shear strains up to 0.01% [18,24]. According to the tests results, for compacted specimens, the overall trend of the shear modulus and damping ratio curves was not aected by the number of cycles and their corresponding axial permanent strains [24]. It is worth noting that the permanent axial deformation decreases as conning pressure increases.
5.10. Comparison of D G=Gmax results with
previous studies
It is observed that when the results are presented in D G=Gmaxthe form, the complex eects of conning
pressure are eliminated, thus facilitating the interpre-tation of loading frequency eect. The relationship between damping ratio and G=Gmax is proposed by a
number of researchers as follows [19]:
D = A(G=Gmax)2+ B(G=Gmax) + C + Dmax; (5)
where coecients A, B, and C are determined through test results. Results of damping ratio versus G=Gmax
under dierent conning pressures and loading frequen-cies for the sandy materials are shown in Figure 15. The proposed curves by Seed and Idriss [7], EPRI [26], and Kokusho [27] for sands are also shown. In the study of Kokusho [27], tests were carried out on non-plastic sands (P I = 0). Since SC has 15% non-plasticity index, the results are compared only to those of Seed and Idriss [7] and EPRI [26]. According to Figure 15, there is good agreement between cyclic test results at loading frequency less than 1 Hz and the proposed curves. However, the dierences are remarkable at the frequency of 2 Hz and, especially for 5 Hz and 10 Hz.
Figure 15. Results of damping ratio versus G=Gmax under dierent conning pressures and loading frequencies: (a) SM,
6. Conclusions
In this paper, the dynamic properties (including shear modulus and damping ratio) of mixed sandy soils were evaluated. This study focused on the eects of loading frequency and conning pressure on G and D versus shear strain (which ranges from 0.0001 to 0.1%). A total number of 40 triaxial tests were conducted on the large-scale cylindrical specimens with a diameter of 200 and 400 mm in height. The main ndings of this study may be summarized as follows:
The increase in loading frequency causes an increase in shear modulus at low strain. However, the rate of the increase in G due to the increase of loading frequency may decrease as the strain increases;
Generally, for SW material, as conning pressure increases, G=Gmax curve moves from the lower
bound toward the upper bound proposed by previ-ous researchers. There are reverse trends against the increasing loading frequency in all tested specimens; G=Gmax curve moves from the upper bound
toward the lower bound. Generally, at certain strain, G=Gmax decreases as loading frequency
increases. However, SM and SC materials are less aected by conning pressure;
The damping ratios of the studied soils are not signicantly aected by conning pressures. How-ever, damping ratio decreases as conning pres-sures increase, especially at high conning prespres-sures (500 kPa). It is worth noticing here that, with the increasing loading frequency, damping ratio increases not only at low strain, but also at medium and high strain levels. It appears that the damping value at any loading frequency at higher strains level would reach a plateau value;
Comparison of D results of the studied materials and the proposed curves by Seed and Idriss [7], Kokusho [27], and EPRI [26] shows that the data points of damping ratio are located almost out of upper bound, as proposed by Seed and Idriss [7]. The dierences are remarkable at the frequencies of 5 and 10 Hz;
A signicant dierence is observed between the amounts of damping behavior of the studied materi-als with results available in the literature. This must be due to the fact that previous studies have been specically carried out and focused on pure sands. This could be another reason for highlighting the importance of the study on sands in decomposition of other grains, such as clay, silt, and gravels. When implementing the proposed Dy curves,
con-ning pressure, plasticity index, maximum particle size, soils type, and loading frequency in particular should be considered;
The eect of triangular, sinusoidal, and rectangular waveforms on the dynamic behavior is negligible. However, shear modulus and damping ratio of tri-angular waveform are slightly higher than those of sinusoidal and rectangular waveforms are;
Eects of the number of cyclic loading and excess pore water pressure on G=Gmaxand D are negligible
at strains smaller than 0.01%. The volume change and permanent axial displacement are also negligible and decrease as conning pressure increases.
Finally, considering the eects of loading fre-quency on shear modulus and, especially, damping behavior, tests should be programmed in a proper manner in terms of loading frequency and number of cyclic loading. The results of this study may be applicable to consultants, contractors, employers, and practitioners in seismic microzonation projects for similar materials.
Acknowledgments
This work was carried out during the research work conducted by the second author for a doctoral degree at the Road, Housing and Urban Development Re-search Center (BHRC). The reRe-search was supported by BHRC under grants 39-9907(2011) and 39-4773(2013). The authors are thankful for the technical help and assistance provided by the Department of Geotechnical Engineering of BHRC.
Nomenclature
G Shear modulus D Damping ratio Shear strain Hz Hertz kPa Kilo Pascal
Dmin Minimum value of damping ratio
Gs Specic gravity
D(10); (mm) Particle size (mm) corresponding to 10
passing percentage, respectively D(30); (mm) Particle size (mm) corresponding 30,
passing percentage, respectively D(50); (mm) Particle size (mm) corresponding to 50
passing percentage, respectively e0 Void ratio according to modied
proctor compaction d Dry density
!opt Optimum water content
PI Plasticity Index 0
3 Eective minor principal stress,
MPa Mega Pascal E Young modulus Shear stress v Poisson's ratio "1 Axial strain
Vp P wave velocity
Vs S wave velocity
Gmax Maximum value of shear modulus
L.B. Lower Bound U.B. Upper Bound
References
1. Lade, P.V. and Yamamuro, J.A. \Eects of nonplastic
nes on static liquefaction of sands", Can. Geotech. J., 34(6), pp. 918-928 (1997).
2. Thevanayagam, S. and Mohan, S. \Intergranular state
variables and stress-strain behaviour of silty sands", Geotechnique, 50(1), pp. 1-23 (2000).
3. Janalizadeh, A., Ghalandarzadeh, A., and Esmaeili,
M. \Behavior of sand- gravel composite with two dif-ferent method under seismic liquefaction conditions", Technical Journal of Engineering and Applied Silences, 2(6), pp. 123-131 (2012).
4. Kong, X., Xu, B., and Zou, D. \experimental study on
the behaviors of sand-gravel composites liquefaction", Soil Stress-Strain Behavior: Measurement and Analy-sis, Geotechnical Symposium in Roma, March 16 & 17 (2006).
5. Seed, H.B., Wong, R.T., Idriss, I.M., and Tokimatsu,
K. \Moduli and damping factors for dynamic analyses of cohesionless soils", J. Geotech. Eng., 112(11), pp. 1016-1032 (1986).
6. Aghaei Araei, A., Razeghi, H.R., Ghalandarzadeh,
A., and Hashemi Tabatabaei, S. \Eects of loading rate and initial stress on stress-strain behavior of rock ll materials under monotonic and cyclic loading conditions", J. Scientia Iranica, 19(5), pp. 1220-1235 (2012).
7. Seed, H.B. and Idriss, I.M. \Soil moduli and damping
factors for dynamic analysis", Report No. EERC 70-10, University of California, Berkeley (1970).
8. Idriss, I.M. \Response of soft soil sites during
earth-quakes", Proc. H. Bolton Seed Memorial Symposium, J.M. Duncan (editor), 2, pp. 273-290 (1990).
9. Park, D. and Hashash, Y.M.A. \Rate-dependent soil
behavior in seismic site response analysis", Canadian Geotechnical Journal, 45(4), pp. 454-469 (2008).
10. Lai, C.G., Pallara, O., Lo Presti, D.C., and Turco,
E. \Low-strain stiness and material damping ratio coupling in soils, Advanced laboratory stress-strain testing of geomaterials", T. Tatsuoka, S. Shibuya, and R. Kuwano, Eds., Balkema, Lisse, The Netherlands, pp. 265-274 (2001).
11. Meng, J. \Earthquake ground motion simulation with
frequency-dependent soil properties", Soil Dynamics and Earthquake Engineering, Elsevier, 27, pp. 234-241 (2007).
12. Meza-Fajardo, K.C. and Lai, C.G. \Explicit causal
relations between material damping ratio and phase velocity from exact solutions of the dispersion equa-tions of linear viscoelasticity", Geophysical Journal International, 171(3), pp. 1247-1257 (2007).
13. Rix, G.J. and Meng, J. \A non-resonance method for
measuring dynamic soil properties", Geotech. Test. J., 28(1), pp. 1-8 (2005).
14. Khan, Z.H., Cascante, G., El Naggar, M.H., and Lai,
C.G. \Measurement of frequency-dependent dynamic properties of soils using the resonant-column device", Journal of Geotechnical and Geoenvironmental Engi-neering, ASCE, 134(9), pp. 1319-1326 (2008).
15. Shibuya, S., Mitachi, T., Fukuda, F., and Degoshi, T.
\Strain-rate eects on shear modulus and damping of normally consolidated clay", Geotech. Test. J., 18(3), pp. 365-375 (1995).
16. Feizi-Khankandi, S., Mirghasemi, A.A.,
Ghalan-darzadeh, A., and Hoeg, K. \The cyclic triaxial tests on asphalt concrete as a water barrier for embankment dams", Soils and Foundations, 48(3), pp. 319-332 (2008).
17. Rollins, K.M., Evans, M.D., Diehl, N.B., and Daily,
W.D. \Shear modulus and damping relationships for gravels", Journal of Geotechnical and Geoenvironmen-tal Engineering, ASCE, 124(5), pp. 398-405 (1998).
18. ASTM D3999. \Standard test methods for the
de-termination of the modulus and damping properties of soils using the cyclic triaxial apparatus", Annual Book of ASTM Standard, ASTM International, West Conshohocken, PA (2006).
19. Zhang, J., Andrus, R., and Juang, C.H. \Normalized
shear modulus and material damping ratio relation-ships", Journal of Geotechnical and Geoenvironmental Engineering, ASEC, 130(4), pp. 453-464 (2005).
20. Aghaei Araei, A., Tabatabaei, S.H., and
Ghalan-darzadeh, A. \Assessment of shear modulus and damp-ing ratio of gravelly soils", Research Project, No. 3-4469- 2007, BHRC, Iran (2008).
21. Maheshwari, B.K., Kale, S.S., and Kaynia, A.M.
\Dynamic properties of Solani sand at large strains: a parametric study", International Journal of Geotech-nical Engineering, 6, pp. 353-358 (2012).
22. Aghaei Araei, A., Tabatabaei, S.H., and
Ghalan-darzadeh, A. \Assessment of shear modulus and damp-ing ratio of gravelly soils", BHRC Publication, No. R-548, BHRC, Iran (2011a).
23. Aghaei Araei, A., Razeghi, H.R., Tabatabaei, S.H.,
and Ghalandarzadeh, A. \Evaluation of frequency content on properties of gravelly soils", BHRC Pub-lication, No. R-630, BHRC, Iran (2011b).
24. Aghaei Araei, A., Razeghi, H.R., Tabatabaei, S.H., and Ghalandarzadeh, A. \Loading frequency eect on stiness, damping and cyclic strength of modeled rockll materials", Soil Dynamics and Earthquake Engineering, Elsevier, 33(1), pp. 1-18 (2012).
25. Ling, X.Z., Zhang, F., Li, Q.L., and Wang, J.H.
\Dynamic shear modulus and damping ratio of frozen compacted sand subjected to freeze-thaw cycle under multi-stage cyclic loading", Soil Dynamics and Earth-quake Engineering, 76, pp. 111-121 (2015).
26. Electric Power Research Institute (EPRI), \Guidelines
for determining design basis ground motions", Final Rep. No. TR-102293, Palo Alto, Calif (1993).
27. Kokusho, T. \Cyclic triaxial test of dynamic soil
prop-erties for wide strain range", Soils and Foundations, 20, pp. 45-60 (1980).
28. ASTM D698 \Standard test methods for laboratory
compaction characteristics of soils using standard ef-fort" (2007).
29. Nishio, N., Tamaoki, K., and Machida, Y. \Dynamic
deformation characteristics of crushed gravel by means of large-size triaxial test apparatus", Proceedings of the 2th Annual Convention, Japanese Society of Soil Mechanics and Foundation Engineering, pp. 603-604 (1985).
30. Sundarraj, K.P. \Evaluation of deformation
charac-teristics of 1-G model ground during shaking using a laminar box", PhD Dissertation, University of Tokyo, Japan (1996).
31. Kallioglou, P., Tika, T.H., and Pitilakis, K. \Shear
modulus and 938 damping ratio of cohesive soils", J. Earthquake Eng. 12(6), pp. 879-913 (2008).
32. ASTM D4015. \Standard test methods for modulus
and damping of soils by the resonant-column method", Re-approved 2000 (1992).
Biographies
Ata Aghaei Araei received his PhD degree from Iran University of Science and Technology (IUST), Iran in 2011. He also was a PhD Researcher at the Geotechnical Laboratory of Civil Engineering at The University of Tokyo. Since 2003, he has been working as a Senior Geotechnical Engineer and the Head of the Geotechnical Laboratory at the Building and Housing Research Center (BHRC). Dr. Aghaei Araei's primary research interests include monotonic and dynamic testing on geomaterials, microzonation, and geotechnical equipment construction.
Ahmadreza Ghodrati received his MD degree from Arak University, Iran in 2012 and is now a PhD student at the Institute of Building and Housing, Road, Housing and Urban Development Research Center (BHRC) in Iran. His primary research interests include risk assessment, geotechnical and geoenvironmental engineering, and dynamic testing on geomaterials.