The effects of satiety responsiveness and maternal work status on the relationship between breastfeeding and BMI z-score of toddlers
Amber Hathcock, BS1
Katrina Krause, MA1
Anthony J. Viera, MD, MPH2
Bernard F. Fuemeller, PhD, MPH1
Cheryl Lovelady, PhD, MPH, RD3
Truls Ostbye, MD, PhD1
1
Department of Community and Family Medicine, Duke University Medical Center, Durham NC
2
Departmentof Family Medicine, University of North Carolina at Chapel Hill, Chapel Hill NC
3
Abstract:
Background & Objective: The association between breastfeeding and decreased toddler adiposity
has been confirmed in numerous studies. The mechanism behind this association is still
unknown. One theory is that children who are breastfed have increased responsiveness to internal
satiety cues. The mode of delivery of breast milk (bottle vs. breast) may also influence the satiety
responsiveness.
Methods: We conducted secondary data analysis of 428 toddlers aged 2 years. Mothers’ body
mass index (BMI) and children’s BMI z-score were measured. Mothers completed the satiety
subscale of the Child Eating Behavior Questionnaire (CEBQ) and the scores used to assess
satiety responsiveness. Maternal work status was used as a proxy for mode of delivery of breast
milk. Regression analyses were used to determine if satiety responsiveness and work status
modified the effects of breastfeeding on BMI z-score and BMI percentile.
Results: Initiation of breastfeeding was associated with decreased BMI z-score (0.40 vs. 0.60;
p=0.04); this association was attenuated after controlling for satiety responsiveness (adjusted
BMI z-scores: 0.44 vs. 0.48, p=0.70. Interestingly, increased satiety responsiveness was weakly
associated with decreased duration and intensity of breastfeeding; this relationship was mitigated
after controlling for maternal work status.
Conclusion: The association between breastfeeding and toddler obesity is at least in part due to
increased satiety responsiveness. The mode of delivery of milk for infants may be partially
responsible for the increase in satiety responsiveness observed with breastfeeding. More research
is needed to characterize satiety responsiveness and its influence on the relationship between
Introduction:
Childhood obesity is an increasingly important public health issue; in 2010, an estimated
32 percent of children in the United States were overweight or obese.1 Several studies have
found that breastfeeding is associated with decreased adiposity.2-9 In one study, longer duration
of breastfeeding was associated with decreased body mass index (BMI) at age 1 year. 9 In
another study, toddlers who were breastfed as infants had a reduced risk of being overweight
when compared to children who were never breastfed.4 The association between breastfeeding
and reduced childhood obesity is so provocative that potential strategies for the prevention of
childhood obesity in the United States include the promotion of breastfeeding. 10 However, little
is known about the mechanisms by which breastfeeding may decrease childhood obesity.
Breastfeeding and childhood obesity rates are affected by similar maternal social factors,
including education, race, and maternal work status. Higher levels of parental education are
associated with lower rates of obesity and increased rates of initiation and duration of
breastfeeding, 611 Among African Americans and Mexican Americans, there is no association
between family socioeconomic status (SES) and overweight, while higher SES is related to
higher prevalence of overweight in white Americans. 6 Maternal employment status has a
negative effect on breastfeeding; mothers who are employed have overall shorter duration of
exclusive breastfeeding. 11-12 In particular, mothers who are employed fulltime outside of the
home are less likely to initiate breastfeeding and have shorter duration of exclusive breastfeeding
compared to mothers who are employed part-time or are unemployed. 13
Social factors only partially explain the link between childhood obesity and
breastfeeding and reduced childhood obesity is satiety responsiveness.14 That is, breastfed
children may have a better response to internal satiety cues.15 Increased breastfeeding is
associated with less parental control over feeding. Less parental control over feeding practices is
associated with decreased child adiposity and greater satiety responsiveness among children.15-19
Breastfeeding itself may also be directly associated with increased satiety responsiveness.
We are unaware of literature exploring the relationship between breastfeeding, satiety
responsiveness, maternal work status, and toddler adiposity. In this paper, we attempt to describe
the influence of satiety responsiveness and maternal work status on the association between
breastfeeding and toddler adiposity We hypothesize that the interplay between the variables is as
follows: (1) increased breastfeeding is associated with a lower BMI z-score and 2) a higher
satiety responsiveness score at age 2 years; (3) a higher satiety responsiveness score is associated
with a lower BMI z-score at 2 years of age; (4) satiety responsiveness is a mediator of the
relationship between breastfeeding and BMI z-score; and (5) maternal work status influences
breastfeeding rates and the effect of breastfeeding on satiety (Figure 1).
Methods
Overall Design:
We conducted a secondary analysis of data from Active Mothers Postpartum (AMP) and
Kids and Adults Now-Defeat Obesity (KAN-DO), two randomized control trials performed at
Duke University School of Medicine. Study participants were children who completed adiposity
assessment at age 24-35 months and whose mothers reported infant and toddler eating behaviors
z-score, and scores on the Child Eating Behaviour Questionnairesatiety subscale.16 Institutional
Review Board approval was obtained at Duke University.
Data Source and Participants:
The source population comprised 850 children who participated in AMP and KAN-DO.
Of the 450 participants in AMP, 280 completed the12-month and 2-year survey and are included
in the study. Of the 400 participants in the KAN-DO study, 148 children were aged 24-35
months and are included in the study. The final analysis sample consisted of a total of 428
children.
Active Mothers Postpartum (AMP). AMP is a 5-year randomized control trial to evaluate the effect of an intervention to promote physical activity and healthy diet for weight loss among
postpartum women with a pre-pregnancy BMI ≥ 25. Women were randomized to either: minimal
care, which included new mothers’ newsletters; or the AMP intervention that included
counseling, printed materials intended to educate and motivate mothers regarding healthy diet
and increased physical activity, and the use of dietary recalls and accelerometers. Women in the
study completed a survey at baseline and an annual follow-up survey. For this study, we used
data collected during the 12-month survey, in which mothers reported infant feeding practices
and plans to work outside the home. Toddler adiposity was measured at a 24 month follow-up. 20
Kids and Adults Now – Defeat Obesity (KAN-DO). KAN-DO is a randomized behavioral intervention study designed to promote healthy eating and increased physical activity and to
prevent or reduce overweight for dyads of overweight and obese postpartum mothers and their
toddlers aged 2-5 years. KAN-DO incorporates assessments and intervention components similar
in this study; only data from children who were 2 years old at the time of initial assessment are
included in this study.
Variables:
Body Mass Index (BMI) Outcomes. We used BMI z-score to assess toddler adiposity.To determine the BMI z-score, BMI was calculated based on measured weight and height and
adjusted for age and gender. 21 Overweight and obesity are defined in this study as BMI ≥ 85th
and 95th percentile, respectively.
Satiety Responsiveness. To assess satiety responsiveness, we used parent responses to questions derived from the Child Eating Behaviour Questionnaire (CEBQ). 16 Parents rated how
often their children displayed the following eating behaviors: “leaves food on his/her plate,”
“gets full before his/her meal is finished,” “gets full up easily,” “cannot eat a meal if she/he has
had a snack just before,” and “has a big appetite.” Individual item scores range from 1 (never) to
5 (always), with the exception of “my child has a big appetite,” which was assigned a score of 1
(always) to 5 (never). A total satiety responsiveness score was determined as the means of the
individual ratings. Higher satiety responsiveness scores denote increased satiety
responsiveness.16
Breastfeeding Variables. Participant mothers completed a survey in which they reported infant feeding for each month of the first year of infant life. We included 4 different
breastfeeding dimensions: initiation, exclusive breastfeeding, duration, and lactation score.
Breastfeeding initiation is defined as self-report of breastfeeding or mixed feeding at age 1
month. Exclusive breastfeeding is defined as breastfeeding only for the first 6 months of life.
follows: 0-3 months, 4-6 months, 7-9 months, and 10-12 months. Intensity score was determined
based on the duration and exclusivity of breastfeeding. Exclusive breastfeeding was awarded 2
points for each month reported; combination of breast and bottle feeding was assigned 1 point,
and exclusive bottle feeding was assigned 0 points. Total intensity score was the sum of these
points and ranged from 0 (exclusive bottle feeding for 12 months) to 24 (exclusive breastfeeding
for 12 months).
Analysis:
We report descriptive analyses of the sample using means and percentages. We assessed
relationships of the 4 dimensions of breastfeeding with the main outcomes of BMI z-score, BMI
percentiles, and scores on the CEBQ satiety subscale. We also assessed the relationships between
the breastfeeding variables and satiety responsiveness and between satiety responsiveness and
the BMI outcomes. We examined the relationships between work status and the four
breastfeeding dimensions. In these bivariate analyses, we tested for significance using
chi-square, t-test, or ANOVA as appropriate. Multivariate linear and logistic regressions were used
to assess the effect of satiety responsiveness on the relationship between breastfeeding and BMI
outcomes. We also used multivariate linear and logistic regression to assess the effect of work
status on the relationship between breastfeeding and BMI outcomes. Results from the
multivariate analysis are reported as mean BMI z-score, mean satiety responsiveness score, and
odds ratios of being overweight or obese. We considered a p-value ≤0.05 to be significant. We
Results:
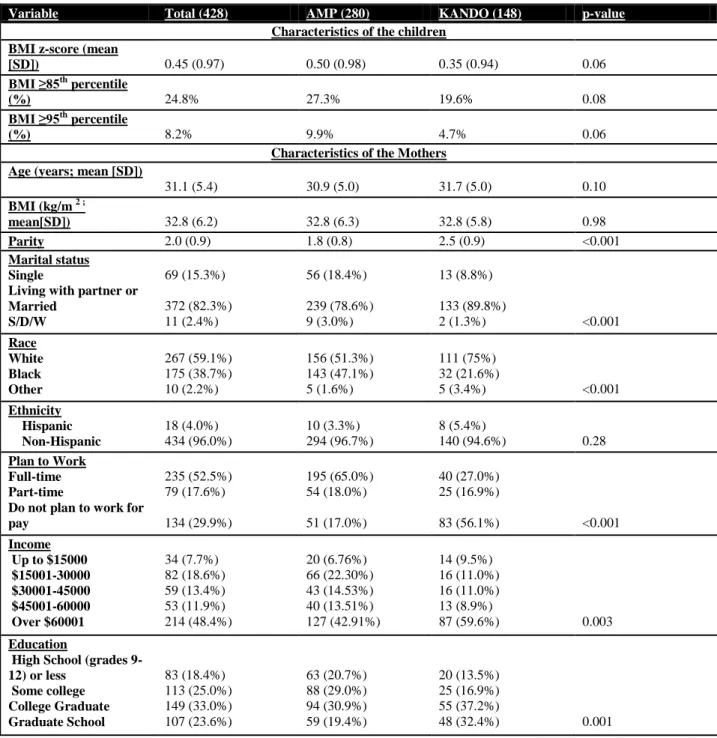
Characteristics of Sample
The mean BMI z-score for children included in the pooled dataset was 0.45; roughly a
quarter of the children were classified as overweight (BMI ≥85th
percentile), and 8 % were obese
(BMI ≥95th
percentile) (Table 1). The characteristics for children from each study differed,
though not significantly. Compared to the children from KANDO, the mean BMI z-score was
higher for children from AMP (0.50 vs. 0.35) and a greater proportion of the AMP children were
overweight (27.3% vs. 19.6%) and obese (9.9% vs. 4.7%).
The maternal characteristics from the pooled data set are as follows: the average maternal
age was 31.1 years with a mean maternal BMI of 32.75 kg/m2 (Table 1). Most of the women
were married, Caucasian, and non-Hispanic; a little more than half had at least a college
education, worked full-time, and had an annual income of at least $60 000. Compared to women
from the KAN-DO data set, more of the women from the AMP data set were single and black.
AMP women were also less educated and had lower income. Fewer women from KAN-DO were
employed full-time (27% vs. 65%, p<0.001; Table 1).
Breastfeeding and BMI.
For the pooled data set, children who ever breastfed had lower mean BMI z-scores than
children who did not (mean BMI z-score 0.40 vs. 0.60, p=0.04); no significant difference
between the proportions of children above 85th or 95th percentile existed based on initiation of
breastfeeding (Table 2a). Children who exclusively breastfed or breastfed for greater duration
did not significantly differ in BMI z-score and BMI percentiles compared to children who did
lactation score of 24, a significantly greater proportion of children with a lactation score of 0
were above 85th percentile (30.3% vs. 16.7%, p=0.03; table 2a); BMI z-score and proportion
above 95th percentile did not differ significantly based on intensity of breastfeeding (Table 2a).
No significant relationship between the 4 breastfeeding variables and BMI z-score or percentiles
existed in the AMP data set alone. In the KAN-DO data set, BMI z-score and percentile were
affected only by initiation of breastfeeding; toddlers who were ever breastfed had significantly
lower BMI z-scores (0.29 vs. 0.69, p=0.04) and fewer of them were above the 85th percentile
(16.5% vs. 38.1%, p=0.02).
Satiety and BMI
Compared to children with a satiety score of 3 or less, children who scored >3 on the
satiety responsiveness subscale had a significantly lower BMI z-score (0.59 vs. 0.27, p<0.01) in
the pooled dataset. Similarly, significantly more children with satiety scores ≤ 3 were above 85th
percentile (28.9% vs. 20.4%, p=0.04). The proportion of children who were obese did not differ
based on satiety score (Table 2b). In the AMP data set, lower satiety score was significantly
associated with a higher BMI z-score (0.60 vs. 0.36, p=0.05) and a greater likelihood of being
above 85th percentile but not 95th percentile (32.5% vs. 22.0%, p=0.05). Higher satiety score was
associated with lower BMI z-score in the KAN-DO data set (0.12 vs. 0.57, p=0.01); proportions
of children above 85th or 95th percentile did not differ based on satiety score.
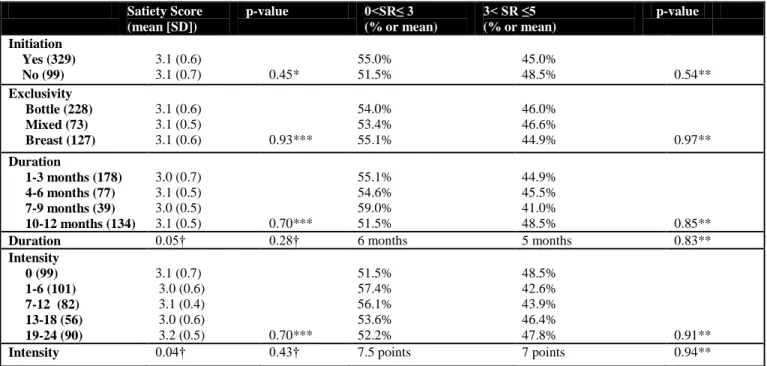
Breastfeeding and Satiety
In the pooled data set, children who were ever breastfed and those who were exclusively
did not have significantly different satiety scores than children who were never breastfed or those
satiety responsiveness in the pooled dataset (Table 2c). No significant relationship between the
four breastfeeding variables and satiety responsiveness existed in either the AMP or KAN-DO
data sets when analyzed separately.
Work Status and Breastfeeding
In the pooled data set, compared to children of mothers who did not plan to work outside
of the home, children of mothers who planned to work full-time outside of the home were less
likely to be exclusively breastfed (19.9% vs. 40.9%, p<0.01), were breastfed for shorter
durations (4.8 months vs. 6.5 months, p<0.01), and had lower lactation scores (7.7 vs. 11.6,
p<0.01). Toddlers whose mothers did not plan to work outside the home had the highest rates of
exclusive breastfeeding, greatest duration of breastfeeding and the highest lactation scores. Rates
of breastfeeding initiation did not differ based on the mothers’ planned work status (Table 2d).
Analysis of the AMP dataset yielded similar results. Information on actual work status
was available for mothers of children from the AMP data set. Results obtained from analysis of
the relationship between actual work status and breastfeeding yielded similar results with the
only difference being that rates of exclusivity of breastfeeding did not differ significantly based
on maternal work status.
Interestingly, toddlers from the KAN-DO dataset whose mothers planned to work
full-time had significantly higher rates of initiation of breastfeeding compared to toddlers whose
mothers did not plan to work outside the home at all (87.5% vs. 80.7%, p=0.05). The highest
rates of initiation and exclusivity of breastfeeding were among children of mothers who planned
to work part-time. Duration and intensity of breastfeeding did not differ significantly between the
Breastfeeding and BMI, Adjusted for Satiety Responsiveness
After adjusting for satiety score, the mean BMI z-score of children who were ever
breastfed did not differ significantly from the mean BMI z-score for children who were never
breastfed; similarly, mean BMI z-scores for children who were exclusively breastfed did not
significantly differ from the mean BMI z-scores for children who were mixed- or bottle-fed
(Table 3a). Duration and intensity of breastfeeding did not significantly affect BMI z-score and
breastfeeding relationship, though adjusting for satiety score mitigated the effect of each variable
on BMI z-score, as demonstrated by a decrease in beta coefficient (Table 3b). Similar results
were obtained after analyzing data from AMP and KAN-DO separately.
After adjusting for satiety responsiveness, the odds of being overweight (BMI>85th
percentile) or obese (BMI>95th percentile) did not differ significantly for children who were ever
breastfed vs. never being breastfed (BMI >85th percentile: OR 0.70, 95% CI 0.43, 1.16; BMI
>95th percentile: OR 0.60, 95% CI 0.29, 1.24), children who were breastfed exclusively vs. not
(BMI >85th percentile: OR 1.19, 95% CI 0.92, 1.54; BMI >95th percentile: OR 1.13, 95% CI
0.76, 1.68), and children who were breastfed for greater duration or with greater intensity (BMI
>85th percentile: OR 0.96, 95% CI 0.92, 1.01; BMI >95th percentile: 0.96. 95% CI 0.89, 1.03)
(BMI >85th percentile: OR 0.97, 95% CI 0.95, 1.00; BMI >95th percentile: OR 0.98, 95% CI
0.94, 1.02)(Tables 3c).
Breastfeeding and Satiety Response, Adjusted for Work Status
After adjusting for age and parity or parity and marital status, the 4 breastfeeding
additionally attenuated the effects of initiation, exclusivity, duration, and intensity of
breastfeeding on satiety responsiveness, though this effect was not significant (Table 4).
Discussion
In our study, increased breastfeeding and greater satiety responsiveness were each
moderately associated with decreased toddler adiposity. The mean BMI z-score was significantly
lower for children who initiated breastfeeding. The prevalence of overweight was lower for
children who breastfed with greater intensity. These relationships were attenuated after
controlling for satiety responsiveness and other factors. Satiety responsiveness was also
significantly associated with adiposity. Toddlers with a higher satiety score were less likely to be
overweight. Maternal work status was weakly associated with breastfeeding and satiety
responsiveness. Maternal employment was associated with decreased rates of breastfeeding
across all 4 dimensions. Interestingly, increased satiety responsiveness was associated with
shorter duration and lower intensity of breastfeeding. This association was mitigated after
controlling for maternal work status.
Results relating breastfeeding to decreased obesity are consistent with previous studies,
though specifics of the link between breastfeeding and obesity differed slightly in our study
when compared to previous studies. 2-9 Other studies showed that duration and exclusivity of
breastfeeding were particularly related to odds of obesity but not BMI. 5, 7-8, 22 In our study,
initiation was the only breastfeeding variable linked to toddler adiposity, as measured by BMI
z-score rather than BMI. The relationship was diminished after controlling for satiety
responsiveness. Maternal work status was associated with decreased breastfeeding rates, which is
responsiveness to breastfeeding. A greater proportion of the published research addressed the
relationship between obesity or breastfeeding and parental control of feeding for older children,
but not satiety responsiveness as estimated by CEBQ satiety subscale scores specifically. 15, 19
Differences between this study and previous studies may be due to differences in
confounding variables. Other studies controlled for maternal smoking, while that information
was not available in either data set used for this study. It is unclear if this information would
have affected the results to a significant degree.
Some notable limitations exist in our study. The sample size in this study was relatively
small compared to other studies, especially when data from each study was analyzed separately.
Numerous statistical comparisons were completed; statistically significant findings defined as
p<0.05 should therefore be interpreted with caution. A much higher proportion of participants
initiated breastfeeding in each study, which may overestimate differences in outcomes between
breastfeeding initiation groups. Furthermore, the measure of satiety responsiveness may not be
sensitive enough to find a relationship with breastfeeding given the sample size. All the mothers
in the study were overweight or obese; this may limit the ability to find a statistically significant
difference in BMI z-score or obesity rates between groups. Inclusion of normal weight women
may provide a greater range of BMI z-score among toddlers. Our analysis sample comprised data
from two separate studies and results may be affected by differences between these two studies.
This was addressed by analyzing data from each study separately in addition to the pooled data
set; the results obtained from the separate study groups did not drastically differ from those
Our analysis may also have been limited by our maternal work status variable. Most of
the work data was based on a plan to work. We had access to a smaller sample size of actual
work info; analysis of each of these yielded similar results, though the sample sizes may have
been too small to detect a statistically significant difference in each of the outcomes.
Strengths of this study include the chosen anthropometric measure of toddler adiposity.
Previous studies used BMI as a measure of toddler adiposity; this measure is less than ideal due
to normal BMI variations among toddlers. This study used BMI z-score, which is age- and
gender-adjusted, as an adiposity measure. 21 This study further benefitted by the assessment of
toddlers at the same age, making the sample less susceptible to confounding due to
developmental differences.
Maternal weight and BMI are the greatest predictors of child BMI, suggesting genetics
influence child adiposity. However, social factors, such as learned eating behaviors, may also
play a role in child adiposity. 15 Results from this study suggest that satiety responsiveness
partially explains the association between breastfeeding and toddler obesity. The relationship
between breastfeeding and satiety responsiveness disappeared after controlling for maternal work
status. This suggests that the mode of delivery of milk for infants, or the degree of control in the
parental feeding style, may be partially responsible for the increase in satiety responsiveness
observed with breastfeeding. Future research that further characterizes the role of satiety
Reference:
1. IOM. Bridging the evidence gap in obesity prevention: A framework to inform decision-making. Washington, DC: Institute of Medicine;2010.
2. Gillman MW, Rifas-Shiman SL, Camargo CA, Jr., et al. Risk of overweight among adolescents who were breastfed as infants. JAMA. May 16 2001;285(19):2461-2467. 3. Kramer MS, Matush L, Vanilovich I, et al. Effects of prolonged and exclusive
breastfeeding on child height, weight, adiposity, and blood pressure at age 6.5 y: evidence from a large randomized trial. Am J Clin Nutr. Dec 2007;86(6):1717-1721. 4. Hediger ML, Overpeck MD, Kuczmarski RJ, Ruan WJ. Association between infant
breastfeeding and overweight in young children. JAMA. May 16 2001;285(19):2453-2460.
5. Arenz S, Ruckerl R, Koletzko B, von Kries R. Breast-feeding and childhood obesity--a systematic review. Int J Obes Relat Metab Disord. Oct 2004;28(10):1247-1256. 6. Butte NF. Impact of infant feeding practices on childhood obesity. J Nutr. Feb
2009;139(2):412S-416S.
7. Owen CG, Martin RM, Whincup PH, Smith GD, Cook DG. Effect of infant feeding on the risk of obesity across the life course: a quantitative review of published evidence.
Pediatrics. May 2005;115(5):1367-1377.
8. Harder T, Bergmann R, Kallischnigg G, Plagemann A. Duration of breastfeeding and risk of overweight: a meta-analysis. Am J Epidemiol. Sep 1 2005;162(5):397-403.
9. O'Tierney PF, Barker DJ, Osmond C, Kajantie E, Eriksson JG. Duration of breast-feeding and adiposity in adult life. J Nutr. Feb 2009;139(2):422S-425S.
10. Khan LK, Sobush K, Keener D, et al. Recommended community strategies and measurements to prevent obesity in the United States. MMWR Recomm Rep. Jul 24 2009;58(RR-7):1-26.
11. Li R, Darling N, Maurice E, Barker L, Grummer-Strawn LM. Breastfeeding rates in the United States by characteristics of the child, mother, or family: the 2002 National Immunization Survey. Pediatrics. Jan 2005;115(1):e31-37.
12. Ryan AS, Zhou W, Arensberg MB. The effect of employment status on breastfeeding in the United States. Womens Health Issues. Sep-Oct 2006;16(5):243-251.
13. Fein SB, Roe B. The effect of work status on initiation and duration of breast-feeding.
Am J Public Health. Jul 1998;88(7):1042-1046.
14. Taveras EM, Sandora TJ, Shih MC, Ross-Degnan D, Goldmann DA, Gillman MW. The
association of television and video viewing with fast food intake by preschool-age children. Obesity (Silver Spring). Nov 2006;14(11):2034-2041.
15. Taveras EM, Rifas-Shiman SL, Scanlon KS, Grummer-Strawn LM, Sherry B, Gillman MW. To what extent is the protective effect of breastfeeding on future overweight explained by decreased maternal feeding restriction? Pediatrics. Dec 2006;118(6):2341-2348.
16. Wardle J, Guthrie CA, Sanderson S, Rapoport L. Development of the Children's Eating Behaviour Questionnaire. J Child Psychol Psychiatry. Oct 2001;42(7):963-970.
17. Birch LL, Fisher JO. Development of eating behaviors among children and adolescents.
Pediatrics. Mar 1998;101(3 Pt 2):539-549.
19. Taveras EM, Scanlon KS, Birch L, Rifas-Shiman SL, Rich-Edwards JW, Gillman MW. Association of breastfeeding with maternal control of infant feeding at age 1 year.
Pediatrics. Nov 2004;114(5):e577-583.
20. Ostbye T, Krause KM, Brouwer RJ, et al. Active Mothers Postpartum (AMP): rationale, design, and baseline characteristics. J Womens Health (Larchmt). Dec 2008;17(10):1567-1575.
21. Hu FB. Measurements of Adiposity and Body Composition. Obesity Epidemiology. NY: Oxford University Press; 2008:53-83.
22. Owen CG, Martin RM, Whincup PH, Davey-Smith G, Gillman MW, Cook DG. The
effect of breastfeeding on mean body mass index throughout life: a quantitative review of published and unpublished observational evidence. Am J Clin Nutr. Dec
Figure 1. Model of interplay between satiety responsiveness, maternal work status, and toddler adiposity.
Breast
feeding
↑Satiety
Response
↓Toddler
Obesity
Maternal
Work
Status
1
2
5
3
4
Table 1. Key characteristics of the children and mothers in the study population.
Variable Total (428) AMP (280) KANDO (148) p-value
Characteristics of the children BMI z-score (mean
[SD]) 0.45 (0.97) 0.50 (0.98) 0.35 (0.94) 0.06
BMI ≥85th
percentile
(%) 24.8% 27.3% 19.6% 0.08
BMI ≥95th
percentile
(%) 8.2% 9.9% 4.7% 0.06
Characteristics of the Mothers Age (years; mean [SD])
31.1 (5.4) 30.9 (5.0) 31.7 (5.0) 0.10
BMI (kg/m 2 ;
mean[SD]) 32.8 (6.2) 32.8 (6.3) 32.8 (5.8) 0.98
Parity 2.0 (0.9) 1.8 (0.8) 2.5 (0.9) <0.001
Marital status Single
Living with partner or Married S/D/W 69 (15.3%) 372 (82.3%) 11 (2.4%) 56 (18.4%) 239 (78.6%) 9 (3.0%) 13 (8.8%) 133 (89.8%)
2 (1.3%) <0.001
Race White Black Other 267 (59.1%) 175 (38.7%) 10 (2.2%) 156 (51.3%) 143 (47.1%) 5 (1.6%) 111 (75%) 32 (21.6%)
5 (3.4%) <0.001
Ethnicity Hispanic Non-Hispanic 18 (4.0%) 434 (96.0%) 10 (3.3%) 294 (96.7%) 8 (5.4%)
140 (94.6%) 0.28
Plan to Work Full-time Part-time
Do not plan to work for pay 235 (52.5%) 79 (17.6%) 134 (29.9%) 195 (65.0%) 54 (18.0%) 51 (17.0%) 40 (27.0%) 25 (16.9%)
83 (56.1%) <0.001
Income Up to $15000 $15001-30000 $30001-45000 $45001-60000 Over $60001 34 (7.7%) 82 (18.6%) 59 (13.4%) 53 (11.9%) 214 (48.4%) 20 (6.76%) 66 (22.30%) 43 (14.53%) 40 (13.51%) 127 (42.91%) 14 (9.5%) 16 (11.0%) 16 (11.0%) 13 (8.9%)
87 (59.6%) 0.003
Education
High School (grades 9-12) or less
Some college College Graduate Graduate School 83 (18.4%) 113 (25.0%) 149 (33.0%) 107 (23.6%) 63 (20.7%) 88 (29.0%) 94 (30.9%) 59 (19.4%) 20 (13.5%) 25 (16.9%) 55 (37.2%)
Table 2a. Aim 1: Association between breastfeeding and mean BMI z-score, BMI>85th percentile, and
BMI >95th percentile from pooled dataset
BMI z-score (mean [SD]
p-value BMI >85%ile
(%)
p-value BMI >95%ile
(%) p-value Initiation Yes (329) No (99) 0.40 (1.1)
0.60 (0.9) 0.04*
23.4%
30.3% 0.17**
7.6%
12.1% 0.16**
Exclusivity Bottle (228) Mixed (73) Breast (127) 0.51 (1.0) 0.39 (1.1)
0.36 (0.8) 0.36***
26.3% 31.5%
18.9% 0.11**
9.7% 6.9%
7.9% 0.71**
Duration
1-3 months (178) 4-6 months (77) 7-9 months (39) 10-12 months (134)
0.54 (1.0) 0.43 (0.9) 0.30 (1.1)
0.37 (0.9) 0.31***
27.0% 27.3% 20.5%
21.6% 0.66**
8.0% 5.2% 7.7%
7.5% 0.90**
Intensity 0 (99) 1-6 (101) 7-12 (82) 13-18 (56) 19-24 (90) 0.60 (1.1) 0.45 (1.0) 0.48 (1.0) 0.27 (1.0)
0.35 (0.8) 0.29***
30.3% 23.8% 31.7% 21.4%
16.7% 0.02*
12.1% 7.9% 8.5% 7.1%
6.7% 0.70**
*p-value obtained from a t-test; ** p-value obtained from chi-squared test; *** p-value obtained from one-way ANOVA
Table 2b. Aim 2: Association between satiety and mean BMI z-score, BMI>85th percentile and BMI >95th
percentile from pooled data.
BMI z-score (mean [SD]
p-value BMI >85%ile
(%)
p-value BMI >95%ile
(%) p-value Satiety Responsiveness ≤3 (232) >3 (196) 0.59 (0.9)
0.27 (1.0) <0.01*
28.9%
20.4% 0.04**
10.3%
6.6% 0.17**
Table 2c. Aim 3: Association between 4 dimensions of breastfeeding and satiety from pooled data.
*p-value obtained from a t-test; ** p-value obtained from chi-squared test; *** p-value obtained from one-way ANOVA; †Spearman’s Correlation and p-value
Table 2d. Aim 5a: Association between maternal work status and 4 dimensions of breastfeeding from pooled data. Initiation (%) Yes (329) No (99) p-value** Exclusivity (%) Bottle (228) Mixed (72) Breast (125)
p-value** Duration
(months; median)
p-value†† Intensity
(median)
p-value††
Plan to not
work (132) 78.0% 22.0%
0.13
47.0% 12.1% 40.9% 6.5
0.001
11.6 (9.9)
<0.001 Plan to work
PT (72) 84.7% 15.3% 43.1% 19.4% 37.5%
<0.001
6.5 11.1 (8.9)
Plan to work
FT (221) 73.3% 26.7% 61.1% 19.0% 19.9% 4.8 7.7 (7.6)
** p-value obtained from chi-squared test ; ††p-value obtained from Kruskal-Willis test
Satiety Score (mean [SD])
p-value 0<SR≤ 3
(% or mean)
3< SR ≤5 (% or mean)
p-value
Initiation Yes (329) No (99)
3.1 (0.6)
3.1 (0.7) 0.45*
55.0% 51.5%
45.0%
48.5% 0.54**
Exclusivity Bottle (228) Mixed (73) Breast (127) 3.1 (0.6) 3.1 (0.5)
3.1 (0.6) 0.93***
54.0% 53.4% 55.1%
46.0% 46.6%
44.9% 0.97**
Duration
1-3 months (178) 4-6 months (77) 7-9 months (39) 10-12 months (134)
3.0 (0.7) 3.1 (0.5) 3.0 (0.5)
3.1 (0.5) 0.70***
55.1% 54.6% 59.0% 51.5% 44.9% 45.5% 41.0%
48.5% 0.85**
Duration 0.05† 0.28† 6 months 5 months 0.83**
Intensity 0 (99) 1-6 (101) 7-12 (82) 13-18 (56) 19-24 (90) 3.1 (0.7) 3.0 (0.6) 3.1 (0.4) 3.0 (0.6)
3.2 (0.5) 0.70***
51.5% 57.4% 56.1% 53.6% 52.2% 48.5% 42.6% 43.9% 46.4%
47.8% 0.91**
Table 3a. Aim 4: Mean BMI z-score based on Initiation and Exclusivity of Breastfeeding Unadjusted and Adjusted for Satiety Score.
Adjusted
BMI z-score (mean [95% CI])*
p-value** Adjusted BMI z-score
with Sat. Score(mean [95% CI])*
p-value**
Initiation
Yes (326) No (99)
0.44 (0.33, 0.54)
0.47 (0.27, 0.67) 0.77
0.44 (0.33, 0.54)
0.48 (0.28, 0.67) 0.70
Exclusivity Breast(127) Mixed (73) Bottle (228)
0.46 (0.29, 0.63) 0.41 (0.19, 0.63)
0.45 (0.32, 0.57) 0.94
0.46 (0.29, 0.63) 0.41 (0.19, 0.63)
0.45 (0.32, 0.57) 0.94
* Adjusted for maternal BMI, education, parity, and initial study group (AMP or KAN-DO); all other variables did not significantly affect the relationship.
** p-value obtained from multiple linear regression.
Table 3b. Aim 4: Effects of duration and intensity of breastfeeding on mean BMI z-score.
Coefficient* p-value** Adjusted Coefficient
with Sat. Score*
p-value**
Duration** -0.006 0.59 -0.004 0.68
Intensity** -0.012 0.73 -0.009 0.79
* Adjusted for maternal BMI, education, parity, and initial study group (AMP or KAN-DO); all other variables did not significantly affect the relationship.
** p-value obtained from multiple linear regression.
Table 3c. Aim 4: Odds and 95% CI of being at least overweight (BMI>85th percentile) or obese (BMI
>95th percentile) based on 4 dimensions of breastfeeding.
BMI >85th percentile BMI >95th percentile
Unadjusted OR
p-value¥
OR Adjusted for SR
p-value¥
Unadjusted OR
p-value¥
OR Adjusted for SR
Table 4. Aim 5b: Effect of Maternal Work Status on Relationship between 4 dimensions of breastfeeding and satiety responsiveness.
Satiety score (Mean [95% CI])
p-value** Satiety Score Adjusted
for Work Status (Mean [95%CI])
p-value**
Initiation*
Yes (326) No (99)
3.07 (3.00, 3.14)
3.08 (2.96, 3.20) 0.89
3.07 (3.00, 3.13)
3.09 (2.97, 3.21) 0.80
Exclusivity* Breast(127) Mixed (73) Bottle (228)
3.08 (2.98, 3.19) 3.08 (2.94, 3.22)
3.06 (2.98, 3.14) 0.96
3.05 (2.94, 3.16) 3.10 (2.96, 3.24)
3.08 (3.00, 3.15) 0.87
Beta Coefficient
p-value** Beta coefficient
Adjusted for Work Status
p-value**
Duration* 0.0056 0.38 0.0027 0.67
Intensity* 0.0155 0.45 0.0041 0.84