Trace
• Trace, page 1
• Configure Trace, page 4
Trace
Cisco Unified Serviceability provides trace tools to assist you in troubleshooting issues with your voice application. Cisco Unified Serviceability supports SDI (System Diagnostic Interface) trace, SDL (Signaling Distribution Layer) trace (for Cisco CallManager and Cisco CTIManager services, applicable to Cisco Unified Communications Manager only), and Log4J trace (for Java applications).
You use the Trace Configuration window to specify the level of information that you want traced as well the type of information that you want to be included in each trace file.
Cisco Unified Communications Manager only: If the service is a call-processing application such as Cisco CallManager or Cisco CTIManager, you can configure a trace on devices such as phones and gateway. Cisco Unified Communications Manager only: In the Alarm Configuration window, you can direct alarms to various locations, including SDL trace log files. If you want to do so, you can configure trace for alerts in the Cisco Unified Real-Time Monitoring Tool (Unified RTMT).
After you have configured information that you want to include in the trace files for the various services, you can collect and view trace files by using the Trace and Log Central option in the Cisco Unified Real-Time Monitoring Tool.
Cisco Unified IM and Presence Serviceability provides trace tools to assist you in troubleshooting issues with your instant messaging and presence application. Cisco Unified IM and Presence Serviceability supports:
•SDI trace
•Log4J trace (for Java applications)
You can configure the level of information that you want traced (debug level), what information you want to trace (trace fields), and information about the trace files (such as number of files per service, size of file, and time that the data is stored in the trace files). You can configure trace for a single service or apply the trace settings for that service to all servers in the cluster.
In theAlarm Configurationwindow, you can direct alarms to various locations. If you want to do so, you can configure trace for alerts in the IM and Presence Unified RTMT.
After you have configured information that you want to include in the trace files for the various services, you can collect and view trace files by using the Trace and Log Central option in the Unified RTMT. You can configure trace parameters for any feature or network service that is available on any IM and Presence node in the cluster. Use theTrace Configurationwindow to specify the parameters that you want to trace for troubleshooting problems. If you want to use predetermined troubleshooting trace settings rather than choosing your own trace fields, you can use theTroubleshooting Trace Settingwindow.
Enabling Trace decreases system performance; therefore, enable Trace only for troubleshooting purposes. For assistance in using Trace, contact Cisco Technical Assistance Center (TAC).
Note
Trace Configuration
You can configure trace parameters for any feature or network service that displays in the Serviceability interface. If you have clusters, you can configure trace parameters for any feature or network service that is available on any server in the cluster. Use the Trace Configuration window to specify the parameters that you want to trace for troubleshooting problems.
You can configure the level of information that you want traced (debug level), what information you want to trace (trace fields), and information about the trace files (such as number of files per service, size of file, and time that the data is stored in the trace files). If you have clusters, you can configure trace for a single service or apply the trace settings for that service to all servers in the cluster.
If you want to use predetermined troubleshooting trace settings rather than choosing your own trace fields, you can use the Troubleshooting Trace window. For more information on troubleshooting trace, see Trace settings.
After you have configured information that you want to include in the trace files for the various services, you can collect trace files by using the trace and log central option in Unified RTMT. For more information regarding trace collection, see Trace collection.
Trace Settings
The Troubleshooting Trace Settings window allows you to choose the services for which you want to set predetermined troubleshooting trace settings. In this window, you can choose a single service or multiple services and change the trace settings for those services to the predetermined trace settings. If you have clusters, you can choose the services on different servers in the cluster, so the trace settings of the chosen services get changed to the predetermined trace settings. You can choose specific activated services for a single server, all activated services for the server, specific activated services for all servers in the cluster, or all activated services for all servers in the cluster. In the window, N/A displays next to inactive services.
The predetermined troubleshooting trace settings for a feature or network service include SDL, SDI, and Log4j trace settings. Before the troubleshooting trace settings are applied, the system backs up the original trace settings. When you reset the troubleshooting trace settings, the original trace settings are restored.
Note
When you open the Troubleshooting Trace Settings window after you apply troubleshooting trace settings to a service, the service that you set for troubleshooting displays as checked. In the Troubleshooting Trace
Trace Trace Configuration
After you apply Troubleshooting Trace Setting to a service, the Trace Configuration window displays a message that troubleshooting trace is set for that service. From the Related Links drop-down list box, you can choose the Troubleshooting Trace Settings option if you want to reset the settings for the service. For the given service, the Trace Configuration window displays all the settings as read-only, except for some parameters of trace output settings, for example, Maximum No. of Files. You can modify these parameters even after you apply troubleshooting trace settings.
Trace Collection
Use Trace and Log Central, an option in the Cisco Unified Real-Time Monitoring Tool, to collect, view, and zip various service traces or other log files. With the Trace and Log Central option, you can collect SDL/SDI traces, Application Logs, System Logs (such as Event View Application, Security, and System logs), and crash dump files.
Do not use Windows NotePad to view collected trace files to view collected trace files, because Windows NotePad does not properly display line breaks.
Tip
Cisco Unified Communications Manager only: For devices that support encryption, the Secure Real-time Transport Protocol (SRTP) keying material does not display in the trace file.
Note
For more information about trace collection, seeCisco Unified Real-Time Monitoring Tool Administration Guide.
Called Party Tracing
Called Party Tracing allows you to configure a directory number or list of directory numbers that you want to trace. You can request on-demand tracing of calls using the Session Trace Tool.
For more information, see theCisco Unified Real-Time Monitoring Tool Administration Guide.
Set Up Trace Configuration
The following procedure provides an overview of the steps to configure and collect trace for feature and network services in the Serviceability interface.
Procedure
Step 1 Configure the values of the TLC Throttling CPU Goal and TLC Throttling IOWait Goal service parameters (Cisco RIS Data Collector service) by performing one of these steps:
•Cisco Unified Communications Manager Administration and Cisco Unified IM and Presense: Select
System> ServiceParametersand configure the values of the TLC Throttling CPU Goal and TLC Throttling IOWait Goal service parameters (Cisco RIS Data Collector service).
Trace
•Cisco Unity Connection only: SelectSystem Settings>Service Parametersin Cisco Unity Connection Administration and configure the values of the TLC Throttling CPU Goal and TLC Throttling IOWait Goal service parameters (Cisco RIS Data Collector service).
Step 2 Configure the trace setting for the service for which you want to collect traces. If you have clusters, you can configure trace for the service on one server or on all servers in the cluster.
To configure trace settings, choose what information you want to include in the trace log by choosing the debug level and trace fields.
If you want to run predetermined traces on services, set troubleshooting trace for those services.
Step 3 Install the Cisco Unified Real-Time Monitoring Tool on a local PC.
Step 4 If you want to generate an alarm when the specified search string exists in a monitored trace file, enable the LogFileSearchStringFound alert in Unified RTMT.
You can find the LogFileSearchStringFound alarm in the LpmTctCatalog. (SelectAlarms>Definitions. In the Find alarms where drop-down list box, choose theSystem Alarm Catalog; in the Equals drop-down list box, chooseLpmTctCatalog).
Step 5 If you want to automatically capture traces for alerts such as CriticalServiceDownand CodeYellow, check the
Enable Trace Downloadcheck box in the Set Alert/Properties dialog box for the specific alert in Unified RTMT; configure how often that you want the download to occur.
Step 6 Collect the traces.
Step 7 View the log file in the appropriate viewer.
Step 8 If you enabled troubleshooting trace, reset the trace settings services, so the original settings are restored. Leaving troubleshooting trace enabled for a long time increases the size of the trace files and may affect the performance of the services.
Note
Configure Trace
This section provides information for configuring trace settings.
Enabling trace decreases system performance; therefore, enable trace only for troubleshooting purposes. For assistance in using trace, contact your technical support team.
Note
Set Up Trace Parameters
This section describes how to configure trace parameters for feature and network services that you manage through the Serviceability GUI.
Trace Configure Trace
For Cisco Unity Connection, you may need to run trace in Cisco Unified Serviceability and Cisco Unity Connection Serviceability to troubleshoot Cisco Unity Connection issues. For information on how to run trace in Cisco Unity Connection Serviceability, refer to theCisco Unity Connection Serviceability Administration Guide.
Tip
Procedure
Step 1 SelectTrace>Configuration.
The Trace Configuration window displays.
Step 2 From the Server drop-down list box, select the server that is running the service for which you want to configure trace; then, clickGo.
Step 3 From the Service Group drop-down list box, select the service group for the service that you want to configure trace; then, clickGo.
The Service Groups in Trace Configuration table lists the services and trace libraries that correspond to the options that display in the Service Group drop-down list box.
Tip
Step 4 From the Service drop-down list box, select the service for which you want to configure trace and, clickGo. The drop-down list box displays active and inactive services.
Cisco Unity Connection only: For the Cisco CallManager and CTIManager services, you can configure SDL trace parameters. To do so, open the Trace Configuration window for one of those services, and click theGobutton that is next to the Related Links drop-down list box.
Tip
If you configured Troubleshooting Trace for the service, a message displays at the top of the window that indicates that the Troubleshooting Traces feature is set, which means that the system disables all fields in the Trace Configuration window except for Trace Output Settings. To configure the Trace Output Settings, go to Step 11. To reset Troubleshooting Trace, see the Set up troubleshooting trace settings.
The trace parameters display for the service that you chose. In addition, the Apply to All Nodes check box displays (Cisco Unified Communications Manager only).
Step 5 Unified Communications Manager and IM and Presence only: If you want to do so, you can apply the trace settings for the service or trace library to all servers in the cluster by checking theApply to All Nodescheck box; that is, if your configuration supports clusters.
Step 6 Check theTrace Oncheck box.
Step 7 Cisco Unity Connection only: If you are configuring SDL trace parameters, go to Step 10.
Step 8 Select the level of information that you want traced from theDebug Trace Levellist box, as described in Debug trace level settings.
Step 9 Check theTrace Fieldscheck box for the service that you chose, for example, Cisco Log Partition Monitoring Tool Trace Fields.
Step 10 If the service does not have multiple trace settings where you can specify the traces that you want to activate, check theEnable All Tracecheck box. If the service that you chose has multiple trace settings, check the check boxes next to the trace check boxes that you want to enable, as described in Trace field descriptions.
Step 11 To limit the number and size of the trace files, specify the trace output setting. See Trace Ouput Settings for descriptions.
Step 12 To save your trace parameters configuration, click theSavebutton.
The changes to trace configuration take effect immediately for all services except Cisco Messaging Interface (Cisco Unified Communications Manager only). The trace configuration changes for Cisco Messaging Interface
Trace
To set the default, click theSet Default
button.
Note
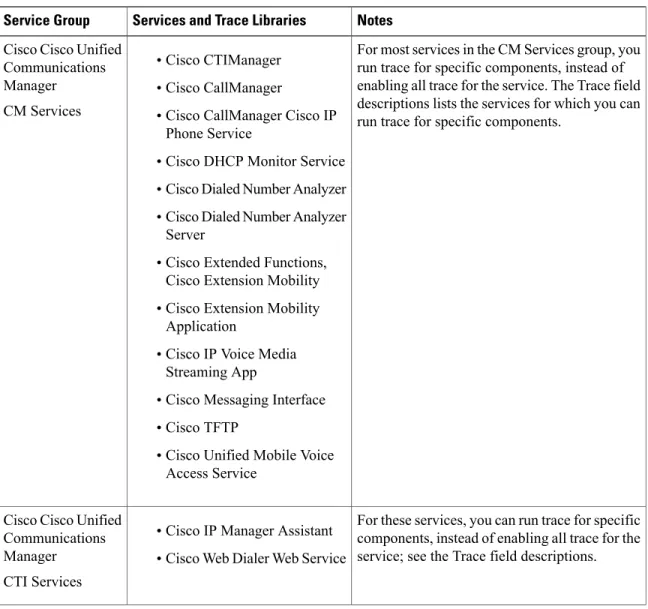
Service Groups in Trace Configuration
The following table lists the services and trace libraries that correspond to the options in the Service Group drop-down list box in the Trace Configuration window.
Table 1: Service Groups in Trace Configuration
Notes Services and Trace Libraries
Service Group
For most services in the CM Services group, you run trace for specific components, instead of enabling all trace for the service. The Trace field descriptions lists the services for which you can run trace for specific components.
•Cisco CTIManager
•Cisco CallManager
•Cisco CallManager Cisco IP Phone Service
•Cisco DHCP Monitor Service
•Cisco Dialed Number Analyzer
•Cisco Dialed Number Analyzer Server
•Cisco Extended Functions, Cisco Extension Mobility
•Cisco Extension Mobility Application
•Cisco IP Voice Media Streaming App
•Cisco Messaging Interface
•Cisco TFTP
•Cisco Unified Mobile Voice Access Service
Cisco Cisco Unified Communications Manager CM Services
For these services, you can run trace for specific components, instead of enabling all trace for the service; see the Trace field descriptions.
•Cisco IP Manager Assistant
•Cisco Web Dialer Web Service Cisco Cisco Unified
Communications Manager CTI Services
Trace Service Groups in Trace Configuration
Notes Services and Trace Libraries
Service Group
You enable all trace for each service, instead of running trace for specific components.
In Cisco Cisco Unified Communications Manager CDR Analysis and Reporting, when reports are run that call stored procedures, Cisco Unified Communications Manager CDR Analysis and Reporting checks the configured debug trace level for the Cisco Unified Communications Manager CDR Analysis and Reporting Scheduler service and the Cisco Unified Communications Manager CDR Analysis and Reporting Web Service in the Trace Configuration window before stored procedure logging begins. For pregenerated reports, Cisco Unified Communications Manager CDR Analysis and Reporting checks the level for the Cisco Unified Communications Manager CDR Analysis and Reporting Scheduler service; for on-demand reports, Cisco Unified
Communications Manager CDR Analysis and Reporting checks the level for the Cisco Cisco Unified Communications Manager CDR Analysis and Reporting Web Service. If you choose Debug from the Debug Trace Level drop-down list box, stored procedure logging gets enabled and continues until you choose another option from the drop-down list box. The following Cisco Unified Communications Manager CDR Analysis and Reporting reports use stored procedure logging: Gateway Utilization report, Route and Line Group Utilization report, Route/Hunt List Utilization report, Route Pattern/Hunt Pilot Utilization report, Conference Call Details report, Conference Call Summary report, Conference Bridge Utilization report, Voice Messaging Utilization report, and the CDR Search report.
•Cisco Cisco Unified Communications Manager CDR Analysis and Reporting Scheduler
•Cisco Cisco Unified Communications Manager CDR Analysis and Reporting Web Service
•Cisco CDR Agent
•Cisco CDR Repository Manager
Cisco Cisco Unified Communications Manager CDR Services
Trace
Notes Services and Trace Libraries
Service Group
See topics related to feature and network services in Cisco Unified IM and Presence Serviceability for a description of these services.
•For these services, you should enable all trace for the service, instead of running trace for specific components.
•Cisco Client Profile Agent
•Cisco Config Agent
•Cisco Intercluster Sync Agent
•Cisco Login Datastore
•Cisco OAM Agent
•Cisco Presence Datastore
•Cisco Presence Engine
•Cisco IM and Presence Data Monitor
•Cisco Route Datastore
•Cisco SIP Proxy
•Cisco SIP Registration Datastore
•Cisco Server Recovery Manager
•Cisco Sync Agent
•Cisco XCP Authentication Service
•Cisco XCP Config Manager
•Cisco XCP Connection Manager
•Cisco XCP Directory Service
•Cisco XCP Message Archiver
•Cisco XCP Router
•Cisco XCP SIP Federation Connection Manager
•Cisco XCP Text Conference Manager
•Cisco XCP Web Connection Manager •Cisco XCP XMPP Federation Connection Manager IM and Presence Services Trace Service Groups in Trace Configuration
Notes Services and Trace Libraries
Service Group
Choosing the Cisco CCM DBL Web Library option activates the trace for database access for Java applications. For database access for C++ applications, activate trace for Cisco Database Layer Monitor, as described in the Cisco Extended Functions trace fields.
Choosing the Cisco Role-based Security option, which supports Cisco Cisco Unified
Communications Manager, activates trace for user-role authorization.
For most services in the Database and Admin Services group, you enable all trace for the service/library, instead of enabling trace for specific components. For Cisco Database Layer Monitor, you can run trace for specific
components.
You can control logging for services in the Cisco Unified IM and Presence Serviceability UI. To change the log level, select the System Services group and Cisco CCMService Web Service.
Note
Cisco Cisco Unified
Communications Manager and Cisco Unity Connection:
•Cisco AXL Web Service
•Cisco CCM DBL Web Library
•Cisco CCMAdmin Web Service
•Cisco CCMUser Web Service
•Cisco Database Layer Monitor
•Cisco UXL Web Service
Cisco Cisco Unified Communications Manager
•Cisco Bulk Provisioning Service
•Cisco GRT Communications Web Service
•Cisco Role-based Security
•Cisco TAPS Service
•Cisco Unified Reporting Web Service
IM and Presence Services:
•Cisco AXL Web Service
•Cisco Bulk Provisioning Service
•Cisco CCMUser Web Service
•Cisco Database Layer Monitor
•Cisco GRT Communications Web Service
•Cisco IM and Presence Admin
•Cisco Unified Reporting Web Service
•Platform Administrative Web Service
Database and Admin Services
Trace
Notes Services and Trace Libraries
Service Group
Choosing the Cisco CCM NCS Web Library option activates trace for database change notification for the Java client.
Choosing the Cisco Unity RTMT Web Service option activates trace for the Unity RTMT servlets; running this trace creates the server-side log for Unity RTMT client queries.
Cisco Cisco Unified
Communications Manager and Cisco Unity Connection:
•Cisco AMC Service
•Cisco CCM NCS Web Library
•CCM PD Web Service
•Cisco CallManager SNMP Service
•Cisco Log Partition Monitoring Tool
•Cisco RIS Data Collector
•Cisco RTMT Web Service
•Cisco Audit Event Service
•Cisco RisBean Library
Cisco Cisco Unified Communications Manager:
•Cisco CCM PD Web Service
IM and Presence Services:
•Cisco AMC Service
•Cisco Audit Event Service
•Cisco Log Partition Monitoring Tool
•Cisco RIS Data Collector
•Cisco RTMT Web Service
•Cisco RisBean Library Performance and
Monitoring Services
You enable all trace for each service, instead of running trace for specific components.
•Cisco CTL Provider
•Cisco Certificate Authority Proxy Function
•Cisco Trust Verification Service
Cisco Cisco Unified Communications Manager
Security Services
Trace Service Groups in Trace Configuration
Notes Services and Trace Libraries
Service Group
You enable all trace for this service, instead of running trace for specific components. Cisco DirSync
Cisco Cisco Unified Communications Manager
Directory Services
You enable all trace for each service, instead of running trace for specific components.
•Cisco DRF Local
•Cisco Cisco Unified
Communications Manager and Cisco Unity Connection only: Cisco DRF Master
Backup and Restore Services
Choosing the Cisco CCMRealm Web Service option activates trace for login authentication. Choosing the Cisco Common User Interface option activates trace for the common code that multiple applications use; for example, Cisco Unified Operating System Administration and Cisco Unified Serviceability.
Choosing the Cisco CCMService Web Service option activates trace for the Cisco Unified Serviceability web application (GUI). You enable all trace for each option/service, instead of running trace for specific components. Cisco Cisco Unified
Communications Manager:
•Cisco CCMRealm Web Service
•Cisco CCMService Web Service
•Cisco Common User Interface
•Cisco Trace Collection Service
IM and Presence Services:
•Cisco CCMService Web Service
•Cisco Trace Collection Service System Services
Choosing the Cisco SOAP Web Service option activates the trace for the AXL Serviceability API.
You enable all trace for this service, instead of running trace for specific components.
•Cisco SOAP Web Service
•Cisco SOAPMessage Service SOAP Services
The Cisco Unified OS Admin Web Service supports Cisco Unified Operating System Administration, which is the web application that provides management of platform-related functionality such as certificate management, version settings, and installations and upgrades. You enable all trace for this service, instead of running trace for specific components. Cisco Unified OS Admin Web
Service Platform Services
Trace
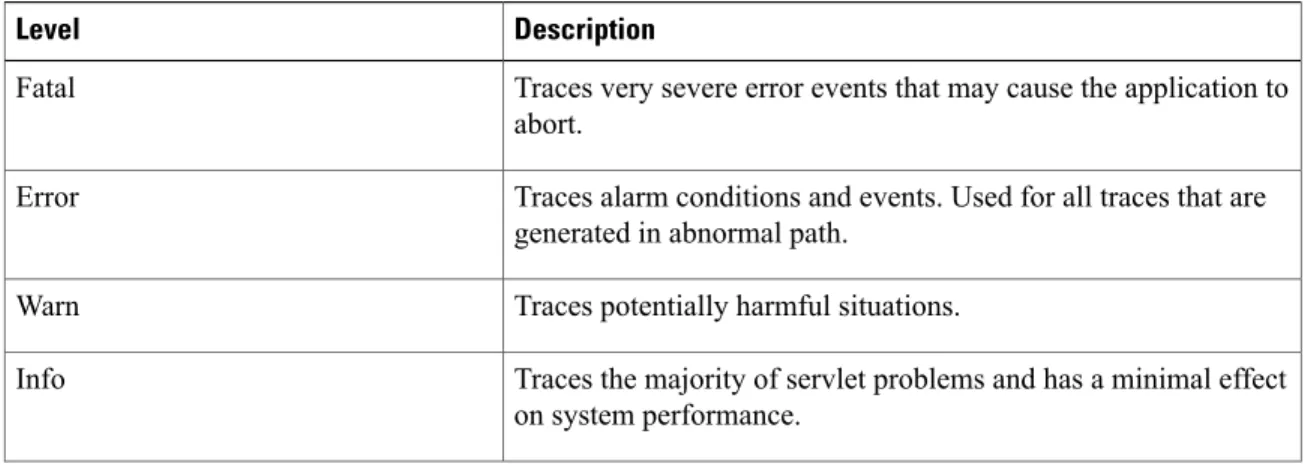
Debug Trace Level Settings
The following table describes the debug trace level settings for services.
Table 2: Debug Trace Levels for Services
Description Level
Traces alarm conditions and events. Used for all traces that are generated in abnormal path. Uses minimum number of CPU cycles. Error
Traces all Error conditions plus process and device initialization messages.
Special
Traces all Special conditions plus subsystem state transitions that occur during normal operation. Traces call-processing events. State Transition
Traces all State Transition conditions plus media layer events that occur during normal operation.
Significant
Not all services use this trace level.
Note
Traces all Significant conditions plus entry and exit points of routines.
Entry/Exit
Traces all Entry/Exit conditions plus low-level debugging information.
Arbitrary
Traces all Arbitrary conditions plus detailed debugging information.
Detailed
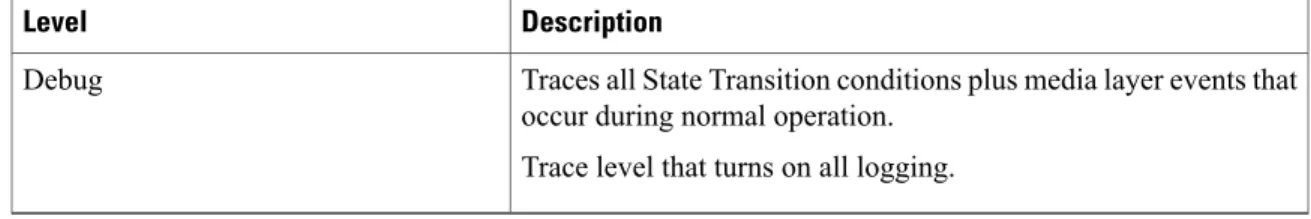
The following table describes the debug trace level settings for servlets.
Table 3: Debug Trace Levels for Servlets
Description Level
Traces very severe error events that may cause the application to abort.
Fatal
Traces alarm conditions and events. Used for all traces that are generated in abnormal path.
Error
Traces potentially harmful situations. Warn
Traces the majority of servlet problems and has a minimal effect on system performance.
Info
Trace Debug Trace Level Settings
Description Level
Traces all State Transition conditions plus media layer events that occur during normal operation.
Trace level that turns on all logging. Debug
Trace Field Descriptions
For some services, you can activate trace for specific components, instead of enabling all trace for the service. The following list includes the services for which you can activate trace for specific components. Clicking one of the cross-references takes you to the applicable section where a description displays for each trace field for the service. If a service does not exist in the following list, the Enable All Trace check box displays for the service in the Trace Configuration window.
The following services are applicable to Cisco Unified Communications Manager and Cisco Unity Connection:
•Database layer monitor trace fields
•Cisco RIS data collector trace fields
The following services are applicable to Cisco Unified Communications Manager:
•Cisco CallManager SDI trace fields
•Cisco CallManager SDL trace fields
•Cisco CTIManager SDL trace fields
•Cisco Extended Functions trace fields
•Cisco Extension Mobility trace fields
•Cisco IP manager assistant trace fields
•Cisco IP voice media streaming app trace fields
•Cisco TFTP trace fields
•Cisco Web Dialer web service trace fields
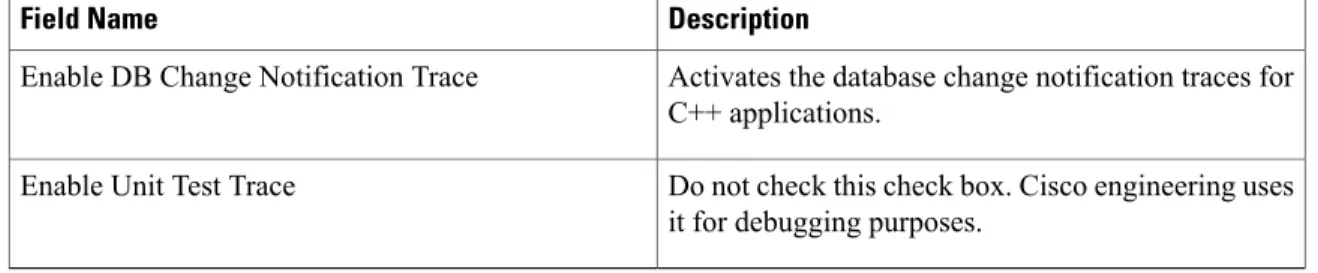
Database Layer Monitor Trace Fields
The following table describes the Cisco Database Layer Monitor trace fields. The Cisco Database Layer Monitor service supports Cisco Unified Communications Manager and Cisco Unity Connection.
Table 4: Cisco Database Layer Monitor Trace Fields
Description Field Name
Activates database library trace for C++ applications. Enable DB Library Trace
Activates service trace. Enable Service Trace
Trace
Description Field Name
Activates the database change notification traces for C++ applications.
Enable DB Change Notification Trace
Do not check this check box. Cisco engineering uses it for debugging purposes.
Enable Unit Test Trace
Cisco RIS Data Collector Trace Fields
The following table describes the Cisco RIS Data Collector trace fields. The Cisco RIS Data Collector service supports Cisco Unified Communications Manager and Cisco Unity Connection.
Table 5: Cisco RIS Data Collector Trace Fields
Description Field Name
Activates trace for the RISDC thread of the RIS data collector service (RIS).
Enable RISDC Trace
Activates trace for the system access library in the RIS data collector.
Enable System Access Trace
Activates trace for the link services library in the RIS data collector.
Enable Link Services Trace
Activates trace for the RISDC access library in the RIS data collector.
Enable RISDC Access Trace
Activates trace for the RISDB library in the RIS data collector.
Enable RISDB Trace
Activates trace for the PI library in the RIS data collector.
Enable PI Trace
Activates trace for the input/output XML messages of the RIS data collector service.
Enable XML Trace
Activates trace for the troubleshooting perfmon data logging in the RIS data collector. Used to trace the name of the log file, the total number of counters that are logged, the names of the application and system counters and instances, calculation of process and thread CPU percentage, and occurrences of log file rollover and deletion.
Enable Perfmon Logger Trace
Trace Trace Field Descriptions
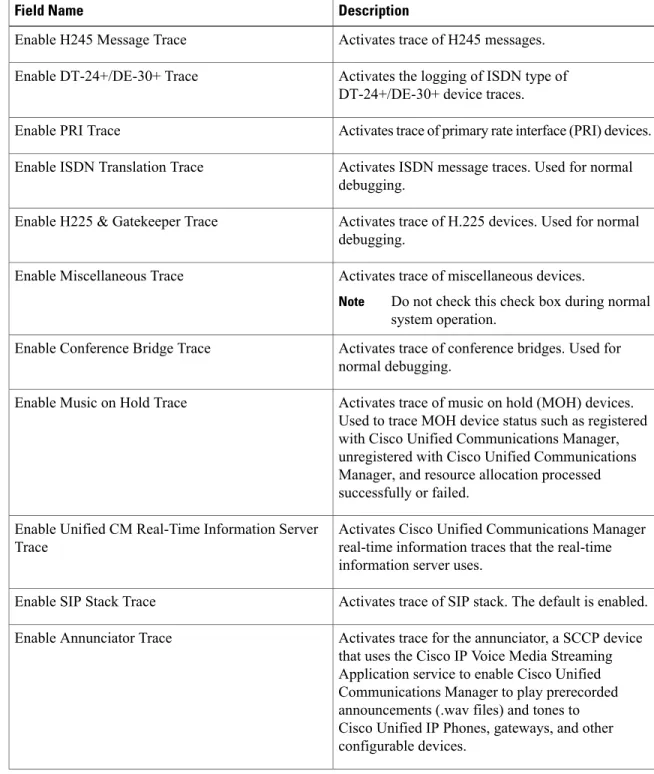
Cisco CallManager SDI Trace Fields
The following table describes the Cisco CallManager SDI trace fields. The Cisco CallManager service supports Cisco Unified Communications Manager.
Table 6: Cisco CallManager SDI Trace Fields
Description Field Name
Activates trace of H245 messages. Enable H245 Message Trace
Activates the logging of ISDN type of DT-24+/DE-30+ device traces. Enable DT-24+/DE-30+ Trace
Activates trace of primary rate interface (PRI) devices. Enable PRI Trace
Activates ISDN message traces. Used for normal debugging.
Enable ISDN Translation Trace
Activates trace of H.225 devices. Used for normal debugging.
Enable H225 & Gatekeeper Trace
Activates trace of miscellaneous devices.
Do not check this check box during normal system operation.
Note
Enable Miscellaneous Trace
Activates trace of conference bridges. Used for normal debugging.
Enable Conference Bridge Trace
Activates trace of music on hold (MOH) devices. Used to trace MOH device status such as registered with Cisco Unified Communications Manager, unregistered with Cisco Unified Communications Manager, and resource allocation processed successfully or failed.
Enable Music on Hold Trace
Activates Cisco Unified Communications Manager real-time information traces that the real-time information server uses.
Enable Unified CM Real-Time Information Server Trace
Activates trace of SIP stack. The default is enabled. Enable SIP Stack Trace
Activates trace for the annunciator, a SCCP device that uses the Cisco IP Voice Media Streaming Application service to enable Cisco Unified Communications Manager to play prerecorded announcements (.wav files) and tones to Cisco Unified IP Phones, gateways, and other configurable devices.
Enable Annunciator Trace
Trace
Description Field Name
Activates traces for CDR. Enable CDR Trace
Activates trace of all analog trunk (AT) gateways. Enable Analog Trunk Trace
Activates trace of phone devices. Trace information includes SoftPhone devices. Used for normal debugging.
Enable All Phone Device Trace
Activates trace of media termination point (MTP) devices. Used for normal debugging.
Enable MTP Trace
Activates trace of all analog and digital gateways. Enable All Gateway Trace
Activates trace for call forwarding and all subsystems that are not covered by another check box. Used for normal debugging.
Enable Forward and Miscellaneous Trace
Activates trace for media gateway control protocol (MGCP) devices. Used for normal debugging. Enable MGCP Trace
Activates trace for media resource manager (MRM) activities.
Enable Media Resource Manager Trace
Activates trace for SIP call processing. Enable SIP Call Processing Trace
Activates trace for SCCP keepalive trace information in the Cisco CallManager traces. Because each SCCP device reports keepalive messages every 30 seconds, and each keepalive message creates 3 lines of trace data, the system generates a large amount of trace data when this check box is checked.
Enable SCCP Keep Alive Trace
Activates trace for SIP keepalive (REGISTER refresh) trace information in the Cisco CallManager traces. Because each SIP device reports keepalive messages every 2 minutes, and each keepalive message can create multiple lines of trace data, the system generates a large amount of trace data when this check box is checked.
Enable SIP Keep Alive (REGISTER Refresh) Trace
Cisco CallManager SDL Trace Fields
The following table describes the Cisco CallManager SDL trace filter settings. The Cisco CallManager service supports Cisco Unified Communications Manager.
Trace Trace Field Descriptions
Cisco recommends that you use the defaults unless a Cisco engineer instructs you to do otherwise.
Note
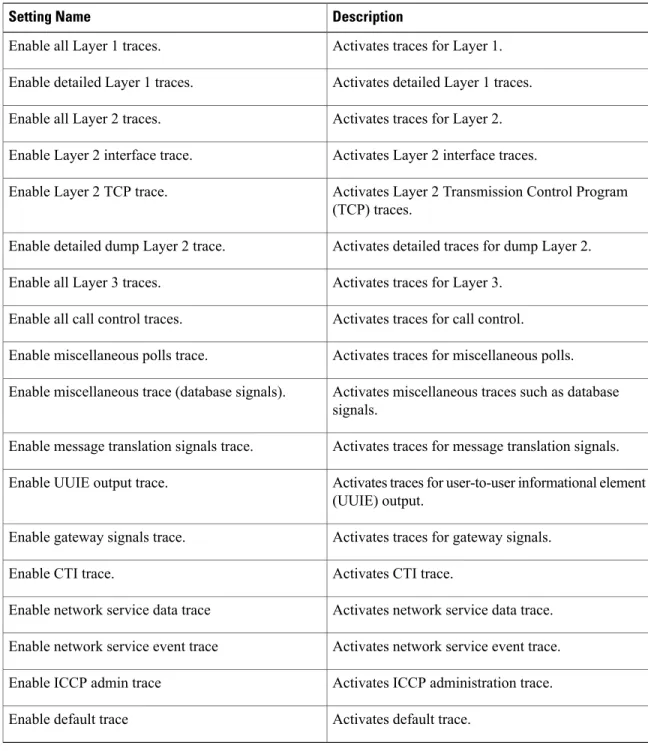
Table 7: Cisco CallManager SDL Configuration Trace Filter Settings
Description Setting Name
Activates traces for Layer 1. Enable all Layer 1 traces.
Activates detailed Layer 1 traces. Enable detailed Layer 1 traces.
Activates traces for Layer 2. Enable all Layer 2 traces.
Activates Layer 2 interface traces. Enable Layer 2 interface trace.
Activates Layer 2 Transmission Control Program (TCP) traces.
Enable Layer 2 TCP trace.
Activates detailed traces for dump Layer 2. Enable detailed dump Layer 2 trace.
Activates traces for Layer 3. Enable all Layer 3 traces.
Activates traces for call control. Enable all call control traces.
Activates traces for miscellaneous polls. Enable miscellaneous polls trace.
Activates miscellaneous traces such as database signals.
Enable miscellaneous trace (database signals).
Activates traces for message translation signals. Enable message translation signals trace.
Activates traces for user-to-user informational element (UUIE) output.
Enable UUIE output trace.
Activates traces for gateway signals. Enable gateway signals trace.
Activates CTI trace. Enable CTI trace.
Activates network service data trace. Enable network service data trace
Activates network service event trace. Enable network service event trace
Activates ICCP administration trace. Enable ICCP admin trace
Activates default trace. Enable default trace
The following table describes the Cisco CallManager SDL configuration characteristics.
Trace
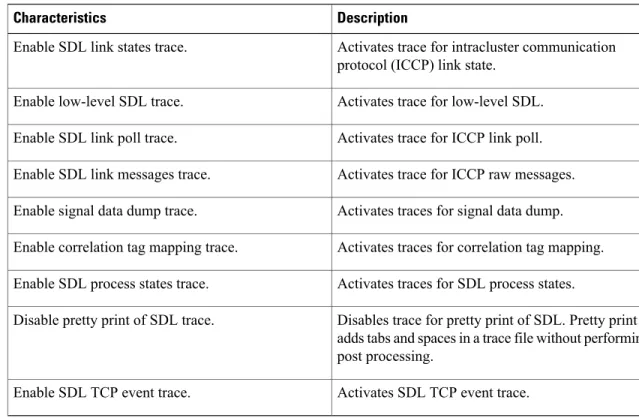
Table 8: Cisco CallManager SDL Configuration Trace Characteristics
Description Characteristics
Activates trace for intracluster communication protocol (ICCP) link state.
Enable SDL link states trace.
Activates trace for low-level SDL. Enable low-level SDL trace.
Activates trace for ICCP link poll. Enable SDL link poll trace.
Activates trace for ICCP raw messages. Enable SDL link messages trace.
Activates traces for signal data dump. Enable signal data dump trace.
Activates traces for correlation tag mapping. Enable correlation tag mapping trace.
Activates traces for SDL process states. Enable SDL process states trace.
Disables trace for pretty print of SDL. Pretty print adds tabs and spaces in a trace file without performing post processing.
Disable pretty print of SDL trace.
Activates SDL TCP event trace. Enable SDL TCP event trace.
Cisco CTIManager SDL Trace Fields
The following table describes the Cisco CTIManager SDL configuration trace filter settings. The Cisco CTIManager service supports Cisco Unified Communications Manager.
Cisco recommends that you use the defaults unless a Cisco engineer instructs you to do otherwise.
Tip
When you choose the CTIManager service from the Service Groups drop-down list box, the Trace Configuration window displays for SDI traces for this service. To activate SDI trace for the Cisco CTI Manager service, check theEnable All Tracecheck box in the Trace Configuration window for the Cisco CTIManager service. To access the SDL Configuration window, chooseSDL Configurationfrom the Related Links drop-down list box; the settings that are described in Cisco CTIManager SDL Configuration Trace Filter Settings table and Cisco CTIManager SDL Configuration Trace Characteristics table display.
Tip
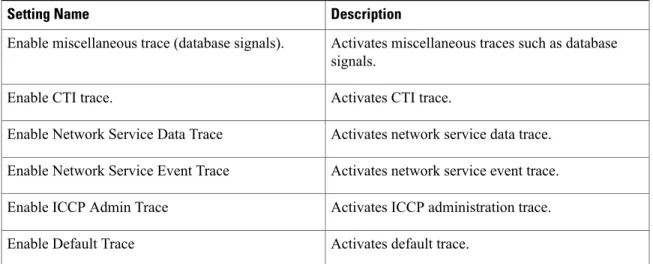
Table 9: Cisco CTIManager SDL Configuration Trace Filter Settings
Description Setting Name
Activates traces for miscellaneous polls. Enable miscellaneous polls trace.
Trace Trace Field Descriptions
Description Setting Name
Activates miscellaneous traces such as database signals.
Enable miscellaneous trace (database signals).
Activates CTI trace. Enable CTI trace.
Activates network service data trace. Enable Network Service Data Trace
Activates network service event trace. Enable Network Service Event Trace
Activates ICCP administration trace. Enable ICCP Admin Trace
Activates default trace. Enable Default Trace
The following table describes the Cisco CTIManager SDL configuration trace characteristics.
Table 10: Cisco CTIManager SDL Configuration Trace Characteristics
Description Characteristics
Activates trace for ICCP link state. Enable SDL link states trace.
Activates trace for low-level SDL. Enable low-level SDL trace.
Activates trace for ICCP link poll. Enable SDL link poll trace.
Activates trace for ICCP raw messages. Enable SDL link messages trace.
Activates traces for signal data dump. Enable signal data dump trace.
Activates traces for correlation tag mapping. Enable correlation tag mapping trace.
Activates traces for SDL process states. Enable SDL process states trace.
Disables trace for pretty print of SDL. Pretty print adds tabs and spaces in a trace file without performing post processing.
Disable pretty print of SDL trace.
Activates SDL TCP event trace. Enable SDL TCP Event trace
Cisco Extended Functions Trace Fields
The following table describes the Cisco Extended Functions trace fields. The Cisco Extended Functions service supports Cisco Unified Communications Manager.
Trace
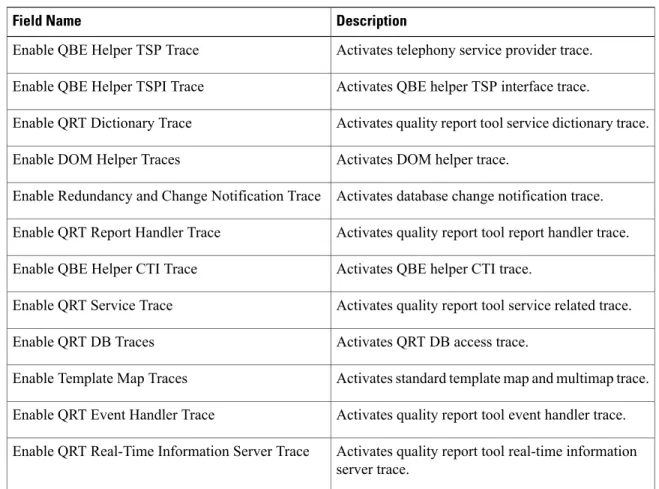
Table 11: Cisco Extended Functions Trace Fields
Description Field Name
Activates telephony service provider trace. Enable QBE Helper TSP Trace
Activates QBE helper TSP interface trace. Enable QBE Helper TSPI Trace
Activates quality report tool service dictionary trace. Enable QRT Dictionary Trace
Activates DOM helper trace. Enable DOM Helper Traces
Activates database change notification trace. Enable Redundancy and Change Notification Trace
Activates quality report tool report handler trace. Enable QRT Report Handler Trace
Activates QBE helper CTI trace. Enable QBE Helper CTI Trace
Activates quality report tool service related trace. Enable QRT Service Trace
Activates QRT DB access trace. Enable QRT DB Traces
Activates standard template map and multimap trace. Enable Template Map Traces
Activates quality report tool event handler trace. Enable QRT Event Handler Trace
Activates quality report tool real-time information server trace.
Enable QRT Real-Time Information Server Trace
Cisco Extension Mobility Trace Fields
The following table describes the Cisco Extension Mobility trace fields. The Cisco Extension Mobility service supports Cisco Unified Communications Manager.
Table 12: Cisco Extension Mobility Trace Fields
Description Field Name
Activates trace for the extension mobility service. Enable EM Service Trace
When you activate trace for the Cisco Extension Mobility Application service, you check the Enable All Trace check box in the Trace Configuration window for the Cisco Extension Mobility Application service.
Tip
Trace Trace Field Descriptions
Cisco IP Manager Assistant Trace Fields
The following table describes the Cisco IP Manager Assistant trace fields. The Cisco IP Manager Assistant service supports Cisco Unified Communications Manager Assistant.
Table 13: Cisco IP Manager Assistant Trace Fields
Description Field Name
Activates trace for the Cisco IP Manager Assistant service.
Enable IPMA Service Trace
Activates trace for the changes that you make to the manager and assistant configurations.
Enable IPMA Manager Configuration Change Log
Activates trace for the CTI Manager connection. Enable IPMA CTI Trace
Activates trace for the secure connection to CTIManager.
Enable IPMA CTI Security Trace
Cisco IP Voice Media Streaming App Trace Fields
The information in this section does not apply to Cisco Unity Connection.
The following table describes the Cisco IP Voice Media Streaming App trace fields. The Cisco IP Voice Media Streaming App service supports Cisco Unified Communications Manager.
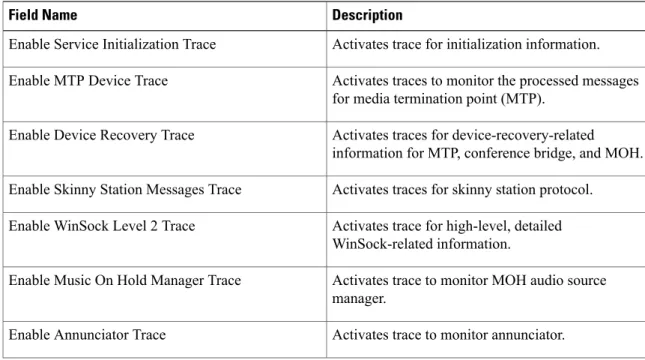
Table 14: Cisco IP Voice Media Streaming Application Trace Fields
Description Field Name
Activates trace for initialization information. Enable Service Initialization Trace
Activates traces to monitor the processed messages for media termination point (MTP).
Enable MTP Device Trace
Activates traces for device-recovery-related information for MTP, conference bridge, and MOH. Enable Device Recovery Trace
Activates traces for skinny station protocol. Enable Skinny Station Messages Trace
Activates trace for high-level, detailed WinSock-related information.
Enable WinSock Level 2 Trace
Activates trace to monitor MOH audio source manager.
Enable Music On Hold Manager Trace
Activates trace to monitor annunciator. Enable Annunciator Trace
Trace
Description Field Name
Activates trace to monitor database setup and changes for MTP, conference bridge, and MOH.
Enable DB Setup Manager Trace
Activates traces to monitor the processed messages for conference bridge.
Enable Conference Bridge Device Trace
Activates device driver traces. Enable Device Driver Trace
Activates trace for low-level, general, WinSock-related information. Enable WinSock Level 1 Trace
Activates traces to monitor the processed messages for MOH.
Enable Music on Hold Device Trace
Activates trace to monitor the download of MOH audio source files.
Enable TFTP Downloads Trace
Cisco TFTP Trace Fields
The following table describes the Cisco TFTP trace fields. The Cisco TFTP service supports Cisco Unified Communications Manager.
Table 15: Cisco TFTP Trace Fields
Description Field Name
Activates trace for service system. Enable Service System Trace
Activates trace for build files. Enable Build File Trace
Activates trace for serve files. Enable Serve File Trace
Cisco Web Dialer Web Service Trace Fields
The following table describes the Cisco Web Dialer Web Service trace fields. The Cisco Web Dialer Web Service supports Cisco Unified Communications Manager.
Table 16: Cisco Web Dialer Web Service Trace Fields
Description Field Name
Activates trace for Cisco Web Dialer servlet. Enable Web Dialer Servlet Trace
Activates trace for the Redirector servlet. Enable Redirector Servlet Trace
Trace Trace Field Descriptions
IM and Presence SIP Proxy Service Trace Filter Settings
The following table below describes the service trace filter settings for the IM and Presence SIP Proxy.
Table 17: IM and Presence SIP Proxy Service Trace Filter Settings
Description Parameter
This parameter enables the proxy access log trace; the first line of each SIP message received by the proxy is logged.
Enable Access Log Trace
This parameter enables tracing for the Authentication module. Enable Authentication
Trace
This parameter enables tracing for the Calendar module. Enable CALENDAR
Trace
This parameter enables tracing for the CTI Gateway. Enable CTI Gateway
Trace
This parameter enables tracing for the Enum module. Enable Enum Trace
This parameter enables tracing for the Method/Event routing module. Enable Method/Event
Routing Trace
This parameter enables tracing for the Number Expansion module. Enable Number
Expansion Trace
This parameter enables tracing of parser information related to the operation of the per-sipd child SIP parser.
Enable Parser Trace
This parameter enables tracing for information about processing of PAI, RPID, and Diversion headers in relation to privacy requests.
Enable Privacy Trace
This parameter enables tracing for the Registry module. Enable Registry Trace
This parameter enables tracing for the Routing module. Enable Routing Trace
This parameter enables tracing for the SIP UA application module. Enable SIPUA Trace
This parameter enables tracing for the Server. Enable Server Trace
This parameter enables tracing for information related to the operation of the per-sipd SIP state machine.
Enable SIP Message and State Machine Trace
This parameter enables tracing for information related to the TCP transport of SIP messages by TCP services.
Enable SIP TCP Trace
This parameter enables tracing for information related to the TLS transport of SIP messages by TCP services.
Enable SIP TLS Trace
Trace
Description Parameter
This parameter enables trace for the SIP XMPP IM Gateway. Enable SIP XMPP IM
Gateway Trace
This parameter enables tracing for the Presence Web Service. Enable Presence Web
Service Trace
IM and Presence Trace Field Descriptions
The following tables provide field descriptions for the services that support trace activation of specific components. For some services, you can activate trace for specific component instead of enabling all trace for the service. If a service is not included in this chapter, Enable All Trace displays for the service in the Trace Configuration window.
Cisco Access Log Trace Fields
The following table describes the Cisco Access Log trace fields.
Table 18: Access Log Trace Fields
Description Field Name
Turns on Access Log trace. Enable Access Log Trace
Cisco Authentication Trace Fields
The following table describes the Cisco Authentication trace fields.
Table 19: Authentication Trace Fields
Description Field Name
Turns on authentication trace. Enable Authentication Trace
Cisco Calendar Trace Fields
The following table describes the Cisco Calendar trace fields.
Table 20: Calendar Trace Fields
Description Field Name
Trace IM and Presence Trace Field Descriptions
Cisco CTI Gateway Trace Fields
The following table describes the Cisco CTI Gateway trace fields.
Table 21: CTI Gateway Trace Fields
Description Field Name
Turns on CTI Gateway trace. Enable CTI Gateway Trace
Cisco Database Layer Monitor Trace Fields
The following table describes the Cisco Database Layer Monitor trace fields.
Table 22: Cisco Database Layer Monitor Trace Fields
Description Field Name
Turns on database library trace for C++ applications. Enable DB Library Trace
Turns on service trace. Enable Service Trace
Activates the database change notification traces for C++ applications.
Enable DB Change Notification Trace
Do not check. Cisco engineering uses it for debugging purposes.
Enable Unit Test Trace
Cisco Enum Trace Fields
The following table describes the Cisco Enum trace fields.
Table 23: Enum Trace Fields
Description Field Name
Turns on Enum trace. Enable Enum Trace
Cisco Method/Event Trace Fields
The following table describes the Cisco Method/Event trace fields.
Trace
Table 24: Method/Event Trace Fields
Description Field Name
Turns on Method/Event trace. Enable Method/Event Trace
Cisco Number Expansion Trace Fields
The following table describes the Cisco Number Expansion trace fields.
Table 25: Number Expansion Trace Fields
Description Field Name
Activates number expansion trace. Enable Number Expansion Trace
Cisco Parser Trace Fields
The following table describes the Cisco Parser trace fields.
Table 26: Parser Trace Fields
Description Field Name
Activates parser trace. Enable Parser Trace
Cisco Privacy Trace Fields
The following table describes the Cisco Privacy trace fields.
Table 27: PrivacyTrace Fields
Description Field Name
Activates Privacy trace. Enable Privacy Trace
Cisco Proxy Trace Fields
The following table describes the Cisco proxy trace fields.
Trace IM and Presence Trace Field Descriptions
Table 28: Proxy Trace Fields
Description Field Name
Turns on Proxy trace. Add Proxy
Cisco RIS Data Collector Trace Fields
The following table describes the Cisco RIS Data Collector trace fields.
Table 29: Cisco RIS Data Collector Trace Fields
Description Field Name
Activates trace for the RISDC thread of the RIS data collector service (RIS).
Enable RISDC Trace
Activates trace for the system access library in the RIS data collector.
Enable System Access Trace
Activates trace for the link services library in the RIS data collector.
Enable Link Services Trace
Activates trace for the RISDC access library in the RIS data collector.
Enable RISDC Access Trace
Activates trace for the RISDB library in the RIS data collector.
Enable RISDB Trace
Activates trace for the PI library in the RIS data collector.
Enable PI Trace
Activates trace for the input/output XML messages of the RIS data collector service.
Enable XML Trace
Activates trace for the troubleshooting perfmon data logging in the RIS data collector. Used to trace the name of the log file, the total number of counters that are logged, the names of the application and system counters and instances, calculation of process and thread CPU percentage, and occurrences of log file rollover and deletion.
Enable Perfmon Logger Trace
Cisco Registry Trace Fields
The following table describes the Cisco Registry trace fields.
Trace
Table 30: Registry Trace Fields
Description Field Name
Activates Registry trace. Enable Registry Trace
Cisco Routing Trace Fields
The following table describes the Cisco Routing trace fields.
Table 31: Routing Trace Fields
Description Field Name
Activates Routing trace. Enable Routing Trace
Cisco Server Trace Fields
The following table describes the Cisco Server trace fields.
Table 32: Server Trace Fields
Description Field Name
Activates Server trace. Enable Server Trace
Cisco SIP Message and State Machine Trace Fields
The following table describes the Cisco SIP Message and State Machine trace fields.
Table 33: SIP Message and State Machine Trace Fields
Description Field Name
Activates SIP Message and State Machine trace. Enable SIP Message and State Machine Trace
Cisco SIP TCP Trace Fields
The following table describes the Cisco SIP TCP trace fields.
Trace IM and Presence Trace Field Descriptions
Table 34: SIP TCP Trace Fields
Description Field Name
Activates SIP TCP trace. Enable SIP TCP Trace
Cisco SIP TLS Trace Fields
The following table describes the Cisco SIP TLS trace fields.
Table 35: SIP TLS Trace Fields
Description Field Name
Activates SIP TLS trace. Enable SIP TLS Trace
Cisco Web Service Trace Fields
The following table describes the Cisco Web Service trace fields.
Table 36: Web Service Trace Fields
Description Field Name
Activates Presence Web Service trace. Enable Presence Web Service Trace
Trace Output Settings
The following table contains the trace log file descriptions.
When you change either the Maximum No. of Files or the Maximum File Size settings in the Trace Configuration window, the system deletes all service log files except for the current file, that is, if the service is running; if the service has not been activated, the system deletes the files immediately after you activate the service. Before you change the Maximum No. of Files setting or the Maximum File Size setting, download and save the service log files to another server if you want to keep a record of the log files; to perform this task, use Trace and Log Central in Unity RTMT.
Caution
Trace
Table 37: Trace Output Settings
Description Field
This field specifies the total number of trace files for a given service.
Cisco Unified Serviceability automatically appends a sequence number to the filename to indicate which file it is, for example, cus299.txt. When the last file in the sequence is full, the trace data begins writing over the first file. The default varies by service. Maximum number of files
This field specifies the maximum size of the trace file in megabytes. The default varies by service. Maximum file size (MB)
Trace Setting Troubleshooting
Troubleshoot Trace Settings Window
TheTroubleshooting Trace Settingswindow allows you to select the services in the Serviceability GUI for which you want to set predetermined troubleshooting trace settings. In this window, you can select the services on different nodes in the cluster. This populates the trace settings changes for all the services you choose. You can select specific active services for a single node, all active services for the node, specific active services for all nodes in the cluster, or all active services for all nodes in the cluster. In the window, N/A displays next to inactive services.
For IM and Presence the predetermined troubleshooting trace settings for an IM and Presence feature or network service include SDI and Log4j trace settings. Before the troubleshooting trace settings are applied, the system backs up the original trace settings. When you reset the troubleshooting trace settings, the original trace settings are restored.
Note
When you open theTroubleshooting Trace Settingswindow after you apply troubleshooting trace settings to a service, the service that you set for troubleshooting displays as checked. In theTroubleshooting Trace Settingswindow, you can reset the trace settings to the original settings.
After you apply Troubleshooting Trace Setting to a service, theTrace Configurationwindow displays a message that troubleshooting trace is set for that service. From theRelated Linkslist box, you can select the Troubleshooting Trace Settings option if you want to reset the settings for the service. For the given service, theTrace Configurationwindow displays all the settings as read-only, except for some parameters of trace output settings, for example, Maximum No. of Files.
Troubleshoot Trace Settings
Before You BeginTrace Trace Setting Troubleshooting
Procedure
Step 1 SelectTrace>Troubleshooting Trace Settings.
Step 2 Select the server where you want to troubleshoot trace settings from theServerlist box.
Step 3 SelectGo.
A list of services display. The services that are not active display as N/A.
Step 4 Perform one of the following actions:
a) To monitor specific services on the node that you selected from theServerlist box, check the service in theServicespane.
For example, the Database and Admin Services, Performance and Monitoring Services, or the Backup and Restore Services pane (and so on).
This task affects only the node that you selected from theServerlist box.
b) To monitor all services on the node that you selected from theServerlist box, checkCheck All Services. c) Cisco Unified Communications Manager and IM and Presence clusters only: To monitor specific services
on all nodes in a cluster, checkCheck Selected Services on All Nodes. This setting applies for all nodes in the cluster where the service is active.
d) Cisco Unified Communications Manager and IM and Presence clusters only: To monitor all services for all nodes in the cluster, checkCheck All Services on All Nodes.
Step 5 SelectSave.
Step 6 Select one of the following buttons to restore the original trace settings:
a) Reset Troubleshooting Traces—Restores the original trace settings for the services on the node that you chose in the Server list box; also displays as an icon that you can select.
b) Cisco Unified Communications Manager and IM and Presence clusters only:Reset Troubleshooting Traces On All Nodes—Restores the original trace settings for the services on all nodes in the cluster. The Reset Troubleshooting Traces button displays only if you have set troubleshooting trace for one or more services.
Leaving troubleshooting trace enabled for a long time increases the size of the trace files and may affect the performance of the services.
Note
After you select theResetbutton, the window refreshes and the service check boxes display as unchecked.
Trace
Trace Trace Setting Troubleshooting