A Comparative Study of Power Line Communication
Networks With and Without Buffer
Shensheng Tang1, Yi Xie2, Chenghua Tang3 and Jinwen Zhu4
1,4Missouri Western State University, USA
{stang, jzhu}@missouriwestern.edu 2Sun Yat-Sen University, China
3Guilin University of Electronic Technology, China
Abstract: Power line communication (PLC) has recently been receiving widespread attention due to its applications in the smart grid. We present a comparative study on the call-level performance of PLC networks with and without buffer through queueing theory. The PLC network model consists of a base station (BS) and a number of subscriber stations that are interconnected with each other and with the BS via power lines. The power line transmission channels are subject to failure during service due to disturbance. A two-dimensional Markov process is used for the modeling. Performance comparison is presented through theoretic analysis and numerical results.
Keywords: Power line communication, Performance modeling, Markov process, Buffer.
1.
Introduction
Power line communication (PLC) is a communication technology that enables data transmission over existing power lines. PLC can be generally classified as narrowband PLC and broadband PLC. Narrowband PLC usually operates at lower frequencies (3-500 kHz), and provides lower data rates (up to 100s of kbps). It has longer transmission range (up to several kilometers), which can be extended using repeaters (RPs). Broadband PLC usually operates at higher frequencies (1.8-250 MHz), and provides higher data rates (up to 100s of Mbps) and is used in shorter-range applications, such as a last-mile technology.
The great advantage of PLC is that it does not need extra telecommunication wires. It re-uses existing power lines. Considering the pervasiveness of power lines, this means with PLC, huge cost of deploying wires such as Ethernet in many buildings can be saved. Similar to any other communication technologies, PLC needs the data to be modulated in the transmitter, transmitted through power line medium, and demodulated in the receiver. In reality, however, there are still lots of challenges for the implementation. Since the power line network has originally been designed for electricity distribution, rather than for data transfer, the power line as communication channel has various noise and disturbance characteristics, resulting in an unreliable channel. Many factors, such as channel attenuation, white noise, RF noise from nearby radio transmitters, impulse noise from electrical machines and relays, may cause the channel unreliability.
In practice the impact of RF noise on a channel can be reduced significantly with OFDM (Orthogonal Frequency Division Multiplexing) technology [1]. Based on the measurements reported in [2], [3], the noise in the power line communication channels can be categorized in five types,
among which the asynchronous impulsive noise is the most unfavorable one and makes more difficulties to the power line channels. The power spectral density of this type of noise can reach values of more than 50dB above the background noise. This paper presents a comparative study on the call-level performance of PLC networks with buffer and without buffer consideration through queueing theory. The PLC network model consists of a base station (BS), which is located at a transformer station and connected to the backbone communication networks, and a number of subscriber stations (SSs) that are interconnected with each other and with the BS via the power lines. An OFDM based transmission technique is assumed for providing the transmission channels in a frequency spectrum, which is divided into a set of narrowband subcarriers (or subchannels). The subchannels are subject to failure during service due to the noise/disturbance on the power lines.
When a channel is in failure, its associated call will wait at the channel until the channel is recovered (i.e., the disturbance is gone), then the call continues its service. The failure events in different subchannels are independent due to the flat fading characteristic in each divided subchannel.
We study the system by considering two different cases. One is that the system is assumed to have no buffer; when all the channels are not available, the next call request will be rejected from the system. The other is that the system has a buffer; when all the channels are not available, the next call request can be admitted to the buffer waiting for an available channel. If a channel becomes available, the head-of-line (HOL) of the queue will access the channel. If the buffer is full, the next call request will be rejected from the system.
The remainder of the paper is organized as follows. Section 2 provides a brief literature servey in recent years. Section 3 presents the system description. Section 4 develops a two-dimensional Markov model and analyzes it by considering no-buffer case and buffer case. Section 5 derives several performance metrics of interest in both cases. Section 6 presents simulation and numerical results for performance comparison. Finally, the paper is concluded in Section 7.
2.
Related Work
[14]-[17]; (d) Physical layer modulation and coding technologies [18]-[21]; and (e) PLC device prototype design and implementation issues [22]-[25].
In [4], the bit error rate (BER) performance of the OFDM system under the impulsive noise and multipath effects were theoretically analyzed in terms of closed form formulas. It was shown that OFDM can mitigate the adverse effect of the impulsive noise and only the heavily disturbed impulsive noise will interfere the BER performance. It was also shown that the adverse effect of multipath is more serious than that of impulsive noise. In [5], the effects of branches in power line networks was studied where quadrature amplitude modulation (QAM) was used. The results indicated possibility of degradation of channel performance with increase in number of branches. In [6], a frequency-domain approach was proposed to characterize and model the statistical variation of power-line noise. The model considers both the background noise and the impulsive noise. Using these noise models, the performance of two major classes of digital modulation schemes, single-carrier modulation and multicarrier modulation, were analyzed and compared. It was found that the multicarrier scheme performs better than the single-carrier scheme under the observed power-line noise with non-Gaussian statistics. In [7], the PLC system performance was analyzed using direct-sequence code division multiple access (DS-CDMA) technique with an adaptive equalizer based on Laguerre filter. The objectives are to improve the system performance in terms of the BER at the receiver, and to eliminate the effect of noise disturbance due to Gaussian noise, impulse noise and multipath fading in the power line channel. In [8], the PLC throughput for home connectivity was analyzed by probing noisy channel scenarios in a PLC network and the statistical results were presented. In [9], the performance of two prominent PLC industrial specifications for e-metering applications, PRIME and G3, were compared under various realistic noise conditions. Both PRIME and G3 offer good performance, but PRIME is preferable because it achieves higher data rates. In [10], a finite-source PLC network model subject to disturbance was developed through a queueing theoretic framework. Two cases of results due to channel failure were analyzed and performance metrics were validated by numerical results.
In [1], a centralized MAC protocol was analyzed for circuit switched voice and data traffic to obtain voice and data call blocking probabilities in a PLC network, where the OFDM transmission technique was used to divide the available spectrum into several subchannels which are narrow-band and almost flat fading. In [11], a polling signalling scheme was compared with an ALOHA signalling scheme by simulations to study a reservation MAC protocol for a PLC network with data traffic alone. In [12], an analytic model of the MAC algorithm was proposed in HomePlug 1.0 PLC network. The results showed that the low priority group demonstrates larger MAC throughput than the high priority group. In [13], the performance of a distributed MAC scheme was studied in an OFDM based PLC network that offers circuit switched voice and packet switched data services. The performance of the distributed MAC was evaluated and compared with that of a centralized MAC.
In [14], a mathematical model of narrowband power line noise was developed based on experimental measurements. The noise is expressed as a Gaussian process whose
instantaneous variance is a periodic time function. The cyclostationary features of power line noise is described in close form. The noise waveform generated with this model shows good agreement with that of actually measured noise. In [15], the indoor power line noise in the frequency range from 2 to 30MHz was measured in several environments. The measured noise was applied by the chi-square test and the amplitudes, durations, and interarrival time of indoor power line impulses were modeled. In [16], a top-down approach and a bottom-up approach were proposed for statistical power line channel modeling. Both approaches were compared and shown that they are both capable of statistically representing real channels. In [17], a canonical statistical-physical model of the instantaneous statistics of asynchronous noise was derived based on the physical properties of the PLC channel and the temporal models of the interarrival and duration of interference impulses.
In [18], a short summary of typical transfer characteristics and interference to be observed at power line networks was given. The modulation schemes, namely the classic frequency hopping modulation and the multifrequency phase modulation were evaluated and significant advantages of multifrequency phase modulation in comparison with classic frequency hopping were pointed out. In [19], a transmission scheme combining 4-FSK (Frequency Shift Keying) modulation with diversity and coding was proposed to make the transmission over power lines robust against permanent frequency disturbances and impulse noise. the error correcting capability of the scheme was derived using non-coherent detection. The scheme can be considered as a form of coded Frequency Hopping. In [20], the performances of a convolutionally coded PSK (Phase Shift Keying) and a convolutionally coded PSK/OFDM with IO-NMLSE (Independent Overlapped Noncoherent Maximum Likelihood Sequence Estimator) were evaluated over power line channel models by computer simulation. Both were shown to provide high performances compared to the conventional convolutionally code DPSK (Differentially PSK) with Viterbi decoding. In [21], the sub-carrier adaptive modulation was proposed based on the pre-coded OFDM transmission. The transmission power of each sub-carrier and coding rate according to the channel situation under the impulsive multi-path channel was analyzed in order to improve the performance of the adaptive modulation scheme.
communication network, like Ethernet, implemented using broadband PLC techniques.
3.
System Description
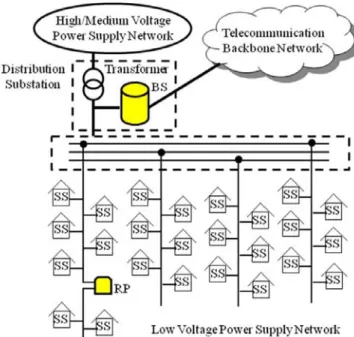
Consider a PLC network in the range of a low-voltage power supply network, as shown in Fig. 1. It consists of a BS and a number of SSs that are interconnected via power lines. The BS is located at a distribution substation and is connected to an external backbone telecommunication network. The substation distributes power to the covered low-voltage power supply network and receives power from a medium-voltage or high-voltage power supply network. When an SS is located near the BS, the communication can be organized directly between the SS and the BS. Otherwise, one or more repeaters (RPs) may be required inside the network to compensate for signal attenuation.
Figure 1. A PLC network architecture.
The signal transmission directions in the PLC network include downlink from the BS to the SSs and uplink from an SS to the BS. The PLC access network holds a logical bus topology, where a set of SSs are connected via a shared communication media — power line. This type of network may have problems when two or more SSs want to transmit at the same time on the same bus. Hence, some scheme of collision handling or collision avoidance is required for communications, such as carrier sense multiple access (CSMA) or an access control by the BS. The latter is assumed here.
The OFDM is recommended by ITU-T G.hn [26] as the modulation scheme for PLC networks due to the fact that it can cope with frequency selectivity (or time dispersion) without complex equalization filters. Moreover, OFDM can perform better than single carrier modulation in the presence of impulsive noise. The available spectrum is divided into a set of narrowband subcarriers (or subchannels). We assume that these channels are all traffic channels, without including any control channels. The signaling control is assumed to be ideal and is not discussed here.
The BS knows about the occupancy status of the channels,
i.e., the OFDM subchannels. The BS allocates the available channels to the requested calls from the SSs. When a requested call arrives, it will occupy one channel if one is available; otherwise, it will either be rejected from the system or enter a buffer. We consider both cases.
• Case A: No buffer is maintained. The rejected call is lost. • Case B: A buffer is maintained to hold the rejected call,
which can get service when an idle channel becomes available. The waiting calls are served in first-come first-served (FCFS) order. Assume that there is no upper bound for the waiting time. Note that the considered PLC network has a finite population N with m traffic channels (N > m), the buffer size is set as N - m.
Note that the channels are subject to failure during service due to disturbance. The failure events in different channels are independent and identically-distributed (i.i.d.). When a channel is in failure, the associated call will wait at the channel until the channel is recovered. Once the failed channel is recovered, the waiting call will continue its service immediately.
4.
Performance Modeling
Assume that the above PLC network has a total of N SSs and m traffic channels (N > m). Hence, for Case B, it is appropriate to set the buffer size as N - m. We assume that the arrival process of an individual idle SS is a Poisson process with rate λ. The channel holding time of a call is exponentially distributed with mean 1/µ. We also assume that the occurrence of channel failures follows a Poisson process with rate α. In each failure event, the recovery time is exponentially distributed with mean 1/β.
Let X(t) be the number of calls waiting on channels due to channel failure at time t. Let Y(t) be the number of calls that are being served at time t (Case A), or the number of calls that are being served and waiting in the buffer at time t (Case B). The process (X(t),Y(t)) can be shown to be a two-dimensional Markov process with state space given by
Case A: SA = { (i, j) | 0 ≤ i ≤ m, 0 ≤ j ≤ m-i }, or Case B: SB = { (i, j) | 0 ≤ i ≤ m, 0 ≤ j ≤ N-i }.
We denote the transition rate from state to by and derive the different transition rates as follows [cf. 10].
) ,
(i j (i,'j')
' ,' , j i
j i
T
Case A:
(1a)
⎩ ⎨
⎧ − − ≤ ≤ − ≤ < −
=
+
. ,
0
, 0
, 1 0
, ) (
1 ,
, otherwise
i m j m
i j
i N Tij
j i
λ
(2a)
⎩ ⎨
⎧ ≤ ≤ − ≤ ≤ −
=
−
. ,
0
, 1
, 1 0
, 1 ,
, otherwise
i m j m i j Tij
j i
µ
(3a)
⎩ ⎨
⎧ ≤ ≤ − ≤ ≤ −
=
− +
. ,
0
, 1
, 1 0
, 1 , 1
, otherwise
i m j m i j
Ti j
j i
α
(4a)
⎩ ⎨
⎧ ≤ ≤ ≤ ≤ −
=
+ −
. ,
0
, 0
, 1 , 1 , 1
, otherwise
i m j m i i
Ti j
j i
Case B:
(1b)
⎩ ⎨
⎧ − − ≤ ≤ ≤ < −
= + . , 0 , 0 , 0 , ) ( 1 , , otherwise i N j m i j i N Tij
j i λ (2b) ⎩ ⎨ ⎧ − ≤ ≤ − ≤ ≤ − = − . , 0 , 1 , 1 1 , } , min{ 1 , , otherwise i N j m i i m j Tij
j i µ (3b) ⎩ ⎨ ⎧ − ≤ ≤ − ≤ ≤ − = − + . , 0 , 1 , 1 0 , } , min{ 1 , 1 , otherwise i N j m i i m j
Ti j
j i α (4b) ⎩ ⎨ ⎧ ≤ ≤ ≤ ≤ − = + − . , 0 , 0 , 1 , 1 , 1 , otherwise i N j m i i Ti j
j i
β
Let π(i, j) denote the steady-state probability that the PLC network is at state (i, j). The global balance equations of the system are given as follows:
Case A:
0 , 0 ,
, ) 1 )( 1 , 1 ( ) 1 )( 1 , ( ) 1 )( 1 , 1 ( ) 1 )( 1 , ( ] ) ( ) )[( , ( i m j m i j j i j j i i j i j i N j i i j j i N j i − < ≤ < ≤ + + − + + + + + − + + + − − − = + + + − − α π µ π β π λ π β α µ λ π (5a)
0 , ,
, ) 1 )( 1 , 1 ( ) 1 )( 1 , 1 ( ) 1 )( 1 , ( ] ) ( )[ , ( i m j m i i j i j j i j i N j i i j j i − = ≤ ≤ + − + + + + − + + − − − = + + β π α π λ π β α µ π (6a) Case B:
0 , 0 ,
, } 1 , 1 min{( ) 1 , 1 ( ) 1 )( 1 , 1 ( } , 1 min{ ) 1 , ( ) 1 )( 1 , ( ] ) }( , min{ ) )[( , ( i N j m i i m j j i i j i i m j j i j i N j i i i m j j i N j i − ≤ ≤ < ≤ + − + + − + + − + + − + + + + − − − = + + − + − − α π β π µ π λ π β α µ λ π (5b)
, 0 ,
, } 1 , 1 min{ ) 1 , 1 ( ) 1 )( 1 , ( ] ) )[( , ( m N j m i i m j j i j i N j i i j i N j i − ≤ ≤ = + − + + − + + − − − = + − − α π λ π β λ π (6b)
where π(i,−1)=ˆ 0, π(−1,j)=ˆ 0, and π(i,j)=ˆ 0 if i+ j>m. The above equations contain (m+1)(m+2)/2 unknowns in Case A, i.e., π(i,j) with 0≤i≤m and 0≤ j≤m−i; or (m+1) (N-m+1) + m(m+1)/2 unknowns in Case B, i.e., π(i,j)
with N−m+1≤ j≤N and 0≤i≤N− j . But there are only m(m+1)/2 independent equations in the above equations for Case A; or m(N-m) + m(m+1)/2 independent equations for Case B. Thus, to solve the problem, (m+1) more equations are required for Case A; or (N+1) more equations are required for Case B.
It is found that if α = 0 and β = 0, a set of particular solutions for Case A and Case B can be determined respectively as follows [27]. Case A: . , , 2 , 1 ), 0 , 0 ( ) , 0
( j m
j N j j L = ⎟⎟ ⎠ ⎞ ⎜⎜ ⎝ ⎛ ⎟⎟ ⎠ ⎞ ⎜⎜ ⎝ ⎛ =
π
µ
λ
π
(7a)Case B: ⎪ ⎪ ⎩ ⎪ ⎪ ⎨ ⎧ ≤ ≤ ⎟⎟ ⎠ ⎞ ⎜⎜ ⎝ ⎛ − − ≤ ≤ ⎟⎟ ⎠ ⎞ ⎜⎜ ⎝ ⎛ − =
− (0,0), .
! )! ( ! , 1 1 ), 0 , 0 ( )! ( ! ! ) , 0 ( N j m m m j N N m j j N j N j j m j j
π
µ
λ
π
µ
λ
π
(7b)The final equations for Case A and Case B are provided respectively by the normalization condition:
Case A: (, ) 1. (8a) 0 0
∑∑
= − = = m i i m j j iπ
Case B: (8b) . 1 ) , ( ) , (0 0 1 0
∑∑
−∑ ∑
= = = − + − = = + m N j m i N m N j j N i j i j iπ
π
Equations (5a – 8a) and (5b – 8b) are sufficient to evaluate the steady-state probabilities π(i, j) for Case A and Case B, respectively. Then, various performance metrics can be determined for both cases.
5.
Performance Metrics
5.1 The Probability That All Channels Are Not Available
The probability that all channels are not available (either in service or in failure) is the sum of the steady-state probabilities with i+ j = m for Case A, and with i+ j ≥ m for Case B, respectively, so that the next coming call request has to be rejected. This event is usually seen by an external observer.
Case A:
(
,
)
.
(9a) 0 nobuffer∑
=−
=
m ii
m
i
P
π
Case B: (9b).
)
,
(
0 buffer∑ ∑
= − − =
=
m i i N i m jj
i
P
π
5.2 The Mean System Throughput
The mean system throughput is defined as the mean number of calls being served per unit time. We derive it in Case A and Case B respectively as follows.
Case A: 1
(
,
)
.
(10a) 0 ] [ 1 ,∑∑
− = − ==
m i N i m j nobuffersys
j
i
j
T
µ
π
Case B: 1 min{ , } (, ). (10b)
0 1 ,
∑∑
− = − = − =m i i N j buffersys j m i i j
5.3 The Mean Number of Calls Waiting at the Channels
It is defined as the average number of calls, in steady state, waiting at the channels due to channel failure. We derive it in Case A and Case B respectively as follows.
Case A: (, ). (11a) 1 0
,
∑∑
= −
=
= m
i i m
j nobuffer
wc i i j
N
π
Case B:
(11b)
. ) , (
1 0
,
∑∑
= −
=
= m
i i N
j buffer
wc i i j
N
π
5.4 The Mean Number of Calls Being Served
It is defined as the mean number of calls in service in steady state, given respectively in Case A and Case B by
Case A: 1 (, ). (12a) 0 1
,
∑∑
−
= −
=
=m
i i m
j nobuffer
bs j i j
N
π
Case B:
(12b)
. ) , ( } , min{
1
0 1
,
∑∑
−
= −
=
−
=m
i i N
j buffer
bs j m i i j
N
π
6.
Numerical Results
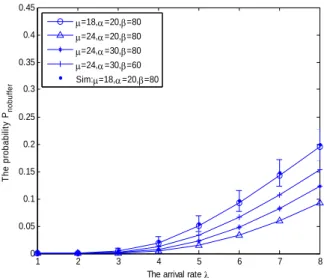
We present the numerical results for the performance comparison between Case A and Case B in the following configuration: N = 25, m = 10. The arrival rate λ changes from 1 to 8. The other parameters µ, α, and β are set separately with variable values in each figure. Note that all parameters are given in dimensionless units, which can be mapped to specific units of measurement.
To validate our analysis, we also developed a discrete-event simulator for the proposed model in both cases. The simulation was implemented in MATLAB. For convenient illustration, we only show one group of simulation results as a comparison. In the illustrated figures, an excellent match between the numerical and simulation results can be observed. Each simulated data point was averaged over 5,000 trials and the associated 95% confidence intervals were computed.
Fig. 2 (a) and Fig. 2 (b) show the comparison of the probabilities in Cases A and B. We observe that the probabilities Pbuffer and Pnobuffer increase with the increase of
call arrival rate λ or the service time 1/µ, and show different trends with respect to α and β. The increase of the channel failure rate α or the required recovery time 1/β delays the channel availability to the initiating call requests. We also see that, at the same condition, Pbuffer is greater than Pnobuffer. The
buffer contains waiting calls that are ready to enter the available channels, reducing the chance of the initiating calls to access the channels.
1 2 3 4 5 6 7 8
0 0.05 0.1 0.15 0.2 0.25 0.3 0.35 0.4 0.45
The arrival rate λ
T
h
e
p
rob
a
b
ilit
y
P
nobuf
fe
r
µ=18,α=20,β=80
µ=24,α=20,β=80
µ=24,α=30,β=80
µ=24,α=30,β=60 Sim:µ=18,α=20,β=80
Figure 2 (a). Comparison of the probability in Case A.
1 2 3 4 5 6 7 8
0 0.05 0.1 0.15 0.2 0.25 0.3 0.35 0.4 0.45
The arrival rate λ
T
h
e
p
rob
a
b
ilit
y
P
b
u
ffe
r
µ=18,α=20,β=80
µ=24,α=20,β=80
µ=24,α=30,β=80
µ=24,α=30,β=60 Sim:µ=18,α=20,β=80
Figure 2 (b). Comparison of the probability in Case B.
1 2 3 4 5 6 7 8
20 40 60 80 100 120 140
The arrival rate λ
T
he m
ean
syst
e
m
t
h
roughput
Tsys,
nobuf
fe
r
µ=18,α=20,β=80
µ=24,α=20,β=80
µ=24,α=30,β=80
µ=24,α=30,β=60 Sim:µ=18,α=20,β=80
1 2 3 4 5 6 7 8 20
40 60 80 100 120 140
The arrival rate λ
T
he m
ean
syst
e
m
t
h
roughput
Tsys,
b
u
ff
e
r
µ=18,α=20,β=80
µ=24,α=20,β=80
µ=24,α=30,β=80
µ=24,α=30,β=60 Sim:µ=18,α=20,β=80
Figure 3 (b). Comparison of the throughput in Case B.
1 2 3 4 5 6 7 8
0 0.5 1 1.5 2 2.5 3
The arrival rate λ
T
he m
ean num
ber
of
wait
ing c
a
lls
Nw
c
, nobuf
fe
r
µ=18,α=20,β=80
µ=24,α=20,β=80
µ=24,α=30,β=80
µ=24,α=30,β=60 Sim:µ=18,α=20,β=80
Figure 4 (a). Comparison of the mean number of waiting calls in Case A.
1 2 3 4 5 6 7 8
0 0.5 1 1.5 2 2.5 3
The arrival rate λ
T
he m
ean num
ber
of
wait
ing c
a
lls
Nw
c
, b
u
ffe
r
µ=18,α=20,β=80
µ=24,α=20,β=80
µ=24,α=30,β=80
µ=24,α=30,β=60 Sim:µ=18,α=20,β=80
Figure 4 (b). Comparison of the mean number of waiting calls in Case B.
Fig. 3 (a) and Fig. 3 (b) show the comparison of the mean system throughputs in Cases A and B. We observe that the throughput Tsys, buffer and Tsys, nobuffer increase with the increase
of λ, µ; and decrease with the increase of α or the required recovery time 1/β. As λ, or µ increases, the mean number of calls entering the system or the mean number of calls processed per unit time will be increased. On the other hand, a more frequent channel failure event or a longer required recovery time will negatively affect the performance of the system throughput. We also see that, at the same condition, Tsys, buffer is a little larger than Tsys, nobuffer. The reason can be
explained as follows. When a buffer is introduced, the calls have more chance to be served, leading to a higher throughput. Note that the HOL call of the queue in the buffer can immediately receive service once a channel becomes available.
1 2 3 4 5 6 7 8
0 1 2 3 4 5 6 7
The arrival rate λ
T
he m
ean num
ber
of
c
a
lls
being s
e
rv
ed,
Nbs
, nobuf
fe
r
µ=18,α=20,β=80
µ=24,α=20,β=80
µ=24,α=30,β=80
µ=24,α=30,β=60 Sim:µ=18,α=20,β=80
Figure 5 (a). Comparison of the mean number of calls in service in Case A.
1 2 3 4 5 6 7 8
0 1 2 3 4 5 6 7
The arrival rate λ
T
he m
ean num
ber
of
c
a
lls
bei
ng s
e
rv
ed,
Nb
s
, b
u
ffe
r
µ=18,α=20,β=80
µ=24,α=20,β=80
µ=24,α=30,β=80
µ=24,α=30,β=60 Sim:µ=18,α=20,β=80
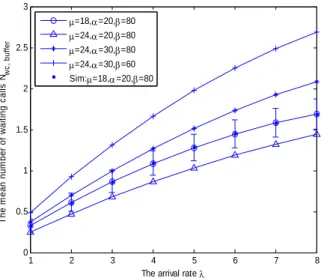
Fig. 4 (a) and Fig. 4 (b) show the comparison of the mean number of waiting calls at the channels in Cases A and B. We observe that Nwc, buffer and Nwc, nobuffer increase with the increase
of λ or decrease of µ, and Nwc, buffer and Nwc, nobuffer also increase
with the increase of α or the required recovery time 1/β. As λ increases, more calls occupy the channels per unit time, leading to more channels subject to failure and thus more calls waiting at the channels. Note that in our model, the channels are assumed to be subject to failure during service. The channel failure is not applicable to an idle status. The smaller the µ, the longer the processing time of a call in service, and thus more calls in service can be captured by a snapshot. On the other hand, when α increases, it is clearly that the number of waiting calls at the channels increases; when the recovery time increases, more calls in service can be captured by a snapshot. We also observe that Nwc, buffer is a little larger than
Nwc, nobuffer at the same condition. The reason is the same as that
in Fig. 2 (a) and Fig. 2 (b).
Fig. 5 (a) and Fig. 5 (b) show the comparison of the mean number of calls being served in Cases A and B. We observe that Nbs, buffer and Nbs, nobuffer increase with the increase of λ or
decrease of µ, as well as with the decrease of α or the increase of β. As λ increases, a snapshot in steady state will capture more calls being served. As µ decreases, the processing time of a call in service will be increased, and thus more calls in service will be captured by a snapshot. On the other hand, as α decreases or β increases, a snapshot in steady state will capture more calls in service. We also observe that Nbs, buffer is
larger than Nbs, nobuffer at the same condition. The buffer
provides additional chance for the calls to be served, leading the larger number of calls in service on average. Therefore, a snapshot can capture more calls that are in service.
7.
Conclusion
In this paper, we presented a comparative study on the call-level performance of PLC networks with and without buffer using queueing theory. The PLC network model consists of a BS and a number of subscriber stations that are interconnected with each other and with the BS via power lines. The power line transmission channels obtained through the OFDM technique are subject to failure during service due to disturbance. We consider the system performance in two cases corresponding to with buffer and without buffer conditions. We used a two-dimensional Markov process for the modeling in both Case A and Case B. We determine the steady-state solution of the proposed model in the two cases and derive several performance metrics of interest for each case, such as the probability that all channels are not available, the mean system throughput, the mean number of calls waiting at the channels, and the mean number of calls being served. Numerical and simulation results are presented to show the impact of system parameters on the derived performance metrics as well as the performance comparison between Case A and Case B. The proposed modeling method can be used for evaluation and design of future PLC networks.
References
[1] M. Stantcheva, K. Begain, H. Hrasnica, and R. Lehnert, “Suitable MAC protocols for an OFDM based PLC network,” 4th International Symposium on Power-Line Communications and its Applications (ISPLC2000), Apr. 2000.
[2] M. Zimmerman and K. Dostert, “The low voltage power distribution network as last mile access network – signal propagation and noise scenario in the HF-range,” International Journal of Electronics and Communications, vol. 54, no. 1, pp. 13–22, 2000.
[3] M. Zimmerman and K. Dostert, “Analysis and modeling of impulsive noise in broad-band powerline communications,” IEEE Trans. on Electromagnetic Compatibility, vol. 44, pp. 249–258, Feb. 2002.
[4] Y.H. Ma, P.L. So, and E. Gunawan, "Performance analysis of OFDM systems for broadband power line communications under impulsive noise and multipath effects," IEEE Transactions on Power Delivery, Vol 20, No. 2, pp. 674-682, 2005.
[5] J. Anatory, M.M. Kissaka, and N.H. Mvungi, “Powerline Communications: The effects of Branches in the network performance”, IEEE ISPLC 2006, Florida, USA, March, 2006.
[6] H. Meng, Y.L. Guan, and S. Chen, "Modeling and analysis of noise effects on broadband power-line communications," IEEE Transactions on Power Delivery, Vol 20, No. 2, pp. 674-682, 2005.
[7] S. Liewkang and C. Banjangkaprasert, "Performance Analysis of Power Line Communication Using DS-CDMA Technique with Adaptive Laguerre Filters," 2011 International Conference on Information and Electronics Engineering, May 28-29, 2011, Bangkok, Thailand.
[8] E. P. Guillen, J. J. López, and C. Y. Barahona, “Throughput Analysis over Power Line Communication Channel in an Electric Noisy Scenario,” International Journal of Mathematical, Physical and Engineering Sciences 3:3, pp. 182-188, 2009.
[9] I. H. Kim, B. Varadarajan, and A. Dabak, “Performance analysis and enhancements of narrowband OFDM powerline communication systems,” in Proc. IEEE International Conference on Smart Grid Communications, pp. 362–367, 2010.
[10]S. Tang, “Performance Analysis of Two Case Studies for a Power Line Communication Network”, International Journal of Communication Networks and Information Security, Vol. 3, No. 2, pp. 178-185, 2011.
[11]H. Hransica and A. Haidine, “Modelling MAC layer for powerline communication networks,” International symposium on voice, video and data communications, November 2000. SPIE’s symposium on Voice, Video and Data Communication, November 2000.
[13]S. Sundaresan, S. Anand, S. Srikanth, and C. N. Krishnan, “Performance of a Disgtributed MAC for OFDM based Power Line Communication Networks,” in Proc. of 8th National Conference on Communications, pp. 238-243, Jan. 2002, Bombay, India.
[14]M. Katayama, T. Yamazato, and H. Okada, "A Mathematical Model of Noise in Narrowband Power Line Communication Systems," IEEE Journal on Selected Areas in Communications, Vol. 24, No. 7, pp. 1267-1276, July 2006.
[15]D. Umehara, S. Hirata, S. Denno, and Y. Morihiro, “Modeling of Impulse Noise for Indoor Broadband Power Line Communications,” International Symposium on Information Theory and its Applications (ISITA 2006), Seoul, Korea, Oct. 29–Nov. 1, 2006.
[16]A. M. Tonello and F. Versolatto, “New Results on Top-down and Bottom-up Statistical PLC Channel Modeling,” Third Workshop on Power Line Communications, Oct. 1-2, 2009, Udine, Italy.
[17]M. Nassar, K. Gulati, Y. Mortazavi, and B. L. Evans, "Statistical Modeling of Asynchronous Impulsive Noise in Powerline Communication Networks", Proc. IEEE Global Communications Conference, Dec. 5-9, 2011, Houston, TX, USA.
[18]M. Karl and K. Dostert, “Selection of an optimal modulation scheme for digital communications over low voltage power lines,” IEEE 4th International Symposium on Spread Spectrum Techniques and Applications, vol.3, pp. 1087-1091, 1996.
[19]A.J.H. Vinck and J. Haring, “Coding and Modulation for Power-Line Communications,” Int’l Symposium on Power-Line Communications and its Applications (ISPLC2000), Apr. 2000.
[20]D. Umehara, M. Kawai, and Y. Morihiro, “Performance Analysis of Non-Coherent Coded Modulation for Power Line Communications,” International Symposium on Power-Line Communications and its Applications (ISPLC2001), Apr. 2001.
[21]T. Tsugi and M. Itami, “A study on adaptive modulation of OFDM under impulsive power line channel,” IEEE International Symposium on Power Line Communications and Its Applications (ISPLC2008), pp. 304-309, Apr. 2008.
[22]B. Kaplan-Guvenc, N. Coban and B. Elektronik, “A DSP Based DMT Modem For Power Line Communications,” International Symposium on Power-Line Communications and its Applications (ISPLC2001), Apr. 2001.
[23]J.L. Carmona, F.J. Canete, J.A. Cortes, and L. Diez, “A DMT Modem Prototype for Broadband PLC,” IEEE International Symposium on Power Line Communications and Its Applications (ISPLC2006), pp. pp. 56-61, 2006.
[24]N. Petrellis, M. Birbas, J. Kikidis, and A. Birbas, “A Very Low Area ADC Architecture Capable of Supporting the Analog Front End of Powerline Communication Systems,” Third Workshop on Power Line Communications, Oct. 1-2, 2009, Udine, Italy.
[25]P. Lucchini, M. Lutman, and M. Capobianco, “Gateways between Broadband and Narrowband Power Line Communication Systems Solutions for Multimedia Devices,” Third Workshop on Power Line Communications, Oct. 1-2, 2009, Udine, Italy.
[26]ITU Recommendation G.9960, Unified high-speed wire-line based home networking transceivers Foundation. Oct. 2009.