Design of the Human Assembly Strategy in a Self-Optimizing Assembly Cell:
A Case Study of Indonesians
Novie Susanto
*, Ratna Purwaningsih, and Kharisma Panca Kurniawati
Department of Industrial Engineering, Faculty of Engineering, Universitas Diponegoro, Semarang 50275, Indonesia
*e-mail: [email protected]
Abstract
This paper presents a continuing study of the human cognitive aspect application in the technical systems. The last studies design a human-centered design based on the German culture. The result shows a significant difference of human performance between Germans and Indonesians. Therefore, this study examines the human cognitive model based on Indonesian culture to investigate whether the different cognitive model based on the culture aspect can improve the human performance. The study was conducted on 60 people classified by age, young (16-34 years old) and old (older than 34 years old). Participants render predictions on an assembly activity for two interim states of two different types of products which are the Builderific brick and the Pulley Release based on four types of the assembly strategy model (Reference, Combination, Human Behavior 1, and Human Behavior 2). The dependent variables are prediction time, mental workload, and predictive accuracy. The results show that the models of human assembly strategies and the products have significant influences on mental workload and predictive capability. The age variable significantly influences mental workload, performance, and prediction capabilities.
Abstrak
Desain Strategi Perakitan Manusia pada Sel Perakitan Swatata: Studi Kasus Pekerja Indonesia. Tulisan ini membahas studi lanjut mengenai aplikasi aspek kognitif manusia dalam sistem teknik. Studi terakhir merancang desain sistem berbasis kepentingan manusia berdasarkan budaya pekerja Jerman. Hasil penelitian studi terakhir ini menunjukkan adanya perbedaan signifikan antara kinerja orang Jerman dan Indonesia. Oleh karena itu studi ini membahas model kognitif manusia berdasarkan budaya orang Indonesia untuk mengetahui apakah perbedaan model berdasarkan aspek budaya dapat meningkatkan kinerja pekerja. Studi ini dilaksanakan pada 60 orang Indonesia yang diklasifikasikan berdasarkan usia yaitu muda (16-34 tahun) dan tua (lebih tua dari 34 tahun). Partisipan dalam penelitian ini diminta untuk melakukan prediksi pada aktivitas perakitan untuk dua status interim pada dua jenis produk berbeda yaitu Builderific brick dan Pulley Release berdasarkan empat jenis model strategi perakitan (Referensi, Kombinasi, Perilaku Manusia 1, dan Perilaku Manusia 2). Variabel bebas pada studi ini adalah waktu prediksi, beban kerja mental, dan keakuratan prediksi. Hasil studi menunjukkan bahwa model strategi perakitan dan jenis produk berpengaruh secara signifikan pada beban kerja mental dan kemampuan prediksi. Variabel usia juga berpengaruh secara signifikan pada beban kerja mental, kinerja kerja, dan kemampuan prediksi.
Keywords: assembly, cognitive engineering, Indonesian, strategy
1.
Introduction
Automation is the use of mechanical and/or electronic equipment to replace the human role [1]. Automation using robot application is one of many ways to survive in the competition of the production system. Mayer et al. [2] explain that the human role in the automation work system cannot be replaced. Human is an important factor in the production system, especially to handle control and supervision tasks or to intervene when an error occurs.
Therefore, an integrated manufacturing system based on human ability in the production environment including problem solving and innovation should be taken into account. The robot application designers must not only be able to visualize the design, but also must be able to develop a solid understanding of the fundamental problems in Human-Robot Interaction (HRI) [5].
The design of the cognitive compatibility plays an important role in these complex systems working primarily to improve a balance performance and optimization between a man and a machine, or more specifically the interaction of humans and robots. Therefore, the issue raised in this research is the need for an analysis of the factors that affect the interaction of humans and robots to produce an ergonomic work system. For the purpose, a self-optimizing assembly cell is designed to represent the interaction between humans and robots as well as to model the human cognitive aspects of the technical systems in the production system based on the cognitive system of Indonesian workers [6]. This study examines the human cognitive model based on Indonesian culture to investigate whether the different cognitive model based on the culture aspect affects the human performance. The aims of this study are to identify the independent and dependent variables as factors in the assembly work
system on the human-robot interaction, to investigate and analyze the influence of the independent variables and the dependent variable, and to provide the recommended factors in the assembly work system based on the results of the research.
2.
Methods
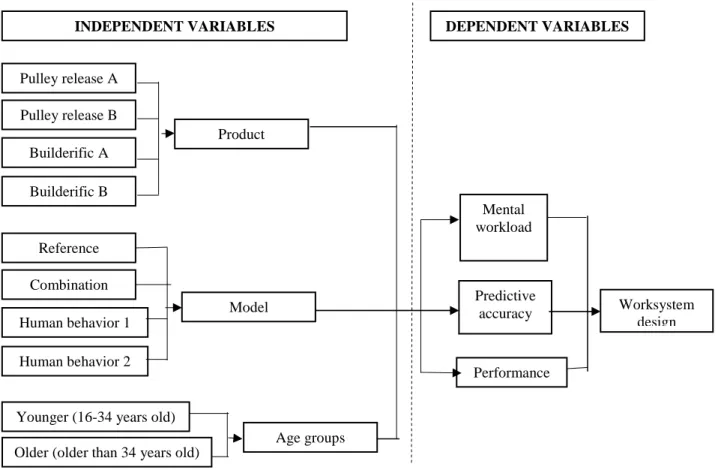
Procedure. This study begins with the encoding and selection of the human assembly strategy to be applied to technical systems. The research phase continued with the application of the human cognitive model as production rules for the different type of products. An empirical study and an environmental design of experiments were then taken into account. The conceptual model of this research can be seen in Figure 1. To achieve the objectives of this study, it is necessary to encode the human cognitive model represented in the stages of assembly work. This model was transferred into a virtual robot as the behavior of the robot. This also represents a kind of human assembly strategies. In this study, the virtual robot only visualizes as a series of assembly sequences. The results of the coding were then applied in the production rules (rule assembly) which were used in the research. The participant tasks were predicting the subsequent assembly sequence based on the interim state of the product and the production rules.
Figure 1. Conceptual Model of the Research
Mental workload
Predictive accuracy
Performance
Worksystem design Pulley release A
Pulley release B Builderific A Builderific B
Product
INDEPENDENT VARIABLES DEPENDENT VARIABLES
Reference Combination Human behavior 1
Model
Human behavior 2
Younger (16-34 years old)
The collection of personal data was conducted anonymously, including age, last education, work, and the level of assemble. The level of assemble ability was valued using a Likert scale of 1-5, where the value 1 stated that level assembly capabilities are very poor and 5 stated assembly capabilities very well.
Once the data were loaded, the participants were introduced to the equipment and research environment. In the data collection phase, the participants were shown a series of the sequence assembly process performed by the robot virtually. For each product (Builderific and Pulley Release), the participants were shown five assembly sequences. The participants were expected to remember the sequence assembly and to understand the work patterns of the model in order to determine the behavior of the robot when the robot was assembled. After that, the participants must predict the next location of the Builderific brick or subsequent product section (sixth assembly sequence), and they assembled them into products directly. After conducting assembling activities, participants fulfilled a questionnaire regarding the workload. During the assembly, the participants’ activity was recorded using a video recorder as the analysis requirements of the accuracy of the prediction time.
Research variables. The dependent variables in this study were the performance, the predictive ability, and mental workload of human operators. The independent variables included in this study were the different models of the robot behavior based on the used production rules, the different types of products (Brik Builderific and Pulley Release), and the age group of the participants. There were three models of the behavior of robots developed by Mayer et al. [2] i.e., reference models, combination, and human behavior in LEGO assembling. A reference model was represented on the order of assembly that was done freely and randomly. The combination of the model was a combination of a layered assembly model and neighborhood rules. In the human behavior I model, the sequence of the assembly was designed based on human behavior. To human behavior II models, the assembly sequences were designed based on the small-scale observations of seven respondents when assembling Pulley Release and Builderific.
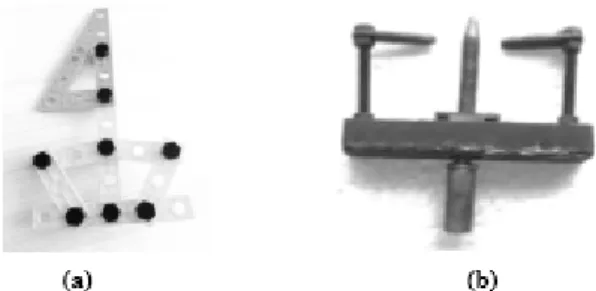
There were 2 products used in this research: Builderific and Pulley Release (see Figure 2). For each product, there were two interim states symbolized by A (interim state 1) and B (interim state 2). Length of the initial sequence (which is displayed on the virtual robot) was a five assembly sequence. Five sections are shown in a sequence known as Corsi Span of the research results Corsi (1972) [3], which are selected based on the human capacity limit short-term memory for processing visuo spatial information on the Corsi-Block Tapping Test.
Figure 2. (a) Builderific Brick (b) Pulley Release
The age group of the participants was divided into two groups, namely young age (16-34 years) and elderly (older than 34 years). There were 30 people for each group. The age classification is based on the study of [7] that states an assembly capability peak is at the age of 16-34 years.
The total number of participants in this study were 60 people with the age range of 16-55 years. This number was similar with the study Mayer et al. [2] when establishing the model based on German culture. The average value of the ability and experience to assemble amounted to 3.3 (SD = 0.79) for old age (older than 34 years) and 3.1 (SD = 0.63) for the younger age (16-34 years) with a scale of 1 (bad) - 5 (Very Good). The hypothesis (H0) used in this study are: a) Model (H01),
product type (H02), and age (H03) significantly affect
mental workload; b) Model (H01), product type (H02), and
age (H03) significantly affect the performance; c) Model
(H01), product type (H02), and age (H03) significantly
affect the predictive accuracy.
This study emphasizes the human cognitive system represented by the assembly strategy as the main point of human operator conformity during the work. Therefore, this study only considers model, product type, and age as the variables of the cognitive system. Working duration is not considered in this study because the conformity between a human operator and the technical system is only assessed by the prediction task.
3.
Results and Discussion
Performance (OP). Those three indicators were selected because the assignment of the operator was simply only predicting the next assembly sequence for each product. The study was also conducted in the short assembly time so it was not to cause physical fatigue (Physical Demand), excessive effort (effort), and frustration (frustration Level).
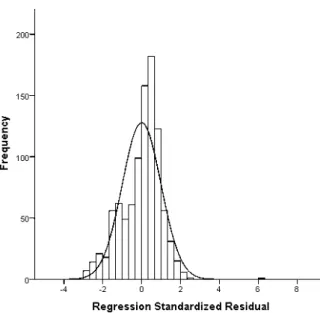
The normality test (using Kolmogorov Smirnov) and the homogeneity test (using Levene’s test) as the prerequisites of classical assumption were taken into account to determine the kind of an ANOVA test will be conducted. The results show that the data were not normally distributed (p ≤0.001) as seen in Figure 3 and not homogeneous (p = 0.003). Because the data performed unqualified assumptions for the analysis of variance (ANOVA), then the data were entered into the non-parametric category. Furthermore, the Kruskal-Wallis test was done to determine the influence of model, products, and the age variables. The results show that the three variables have a value Sig. <0.05, so they have significant influences on the mental workload. The analysis of the model variable was comparable with the results of Mayer et al. [2] which stated that there were significant differences in the chronologically structured workload data on the model of the robot behavior as the main variable. The test results of the Mann Whitney U as a post hoc test for mental load show that the comparison between the reference model and three other models (Reference-Combination, Reference-Human Behavior 1, and Reference-Human Behavior 2) show a significant effect on the mental workload (Sig. <0.05). It can be concluded that the model reference is a model that has the most significant influence on the mental workload. The result is that the
reference model has the highest mental load value (x ̅=31.3440, SD = 1.51830), and the combination model has the lowest value of the mental workload (x ̅=19.3935, SD = 0.64365).
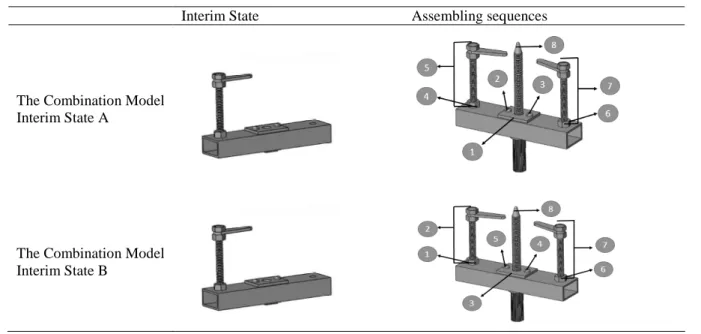
Combination models had the lowest value of mental workload among the other models for the Pulley product. This model had an identical form of the interim states of the sixth assembly sequence that was located on a similar place for the interim states A and B, which can be seen in Table 1. In such circumstances, the operators were performed the prediction task with the similar sequences for A and B and by doing so, the learning process was faster than other models.
Figure 3. Normality Graph for Mental Workload Data
Table 1. Interim State and the Assembling Sequences for Combination Model (Pulley)
Interim State Assembling sequences
The Combination Model Interim State A
In the Builderific product, the operator was helped by the design of the interim state. As seen in Table 2, the combination model in the Builderific product focused on the center of the product. This was as a clue to the operator for determining the predictions of subsequent assembly, thereby reducing the value of the mental demand of the operators. It was also based on the principle of a combination model that the assembly tends to complete the operation in one line or the first layer. The reference model had the highest value among the other models. This can be caused by the absences of the rules or a specific pattern. In contrast to other models that have predictable patterns or rules, a reference model required a higher mental demand and a temporal demand for predicting subsequent assembly sequences.
The results of the Mann Whitney U test as a post hoc test for mental load indicate that all the comparisons of products have significant influences on the mental workload (Sig. <0.05). To find out the most influential products, a post hoc test was conducted and as the result the Builderific product with an interim state A had the highest mental load value (x ̅=26.8555, SD = 0.99011), and the Pulley product with an interim status B had the lowest value of the mental burden (x ̅=18.7659, SD = 1.06406).
The general analysis shows that the average value of the mental workload in the Builderific product is higher than the Pulley product. This can happen because the Builderific product has a more complicated design and prediction task, a higher number of parts than the Pulley.
For the Builderific product, the expected prediction task of the operator in charge was to assemble the nuts and bolts, while for the Pulley, the next task was only one step assembly operation. Thus, operators require a higher mental and temporal demand to predict the order of Builderific assembling than the Pulley assembling. There were two classifications of age variables used in this research. They were the young (16-34 years) and old (older than 34 years) groups.
The results of the Mann Whitney U test as a post hoc test for mental load show that age has a significant influence on the mental workload (p ≤0.000). The old age group has a higher mental load (x ̅=25.9918, SD = 0.90576) compared with the younger age group (x ̅=20.4400, SD = 0.56037).
These results concurred with [1] state that the peak level of ability to assemble objects and to understand the arrangement of the image is in the age of 16-34 (a young age) and will decrease after the age of 34 years. Performance. In this research, the performance of an operator was measured by the length of time required to perform the prediction task. The duration of prediction time was obtained from a recorded video. Prediction time measurement started when the virtual robot displayed on the laptop screen was stopped and it finished when one of the operators handed back to the starting position. Prediction time was presented in seconds. The results show that the data are not normally distributed (p ≤0.001) as seen in Figure 4 and not homogeneous (p ≤0.001) as well.
Table 2. Interim State and the Assembling Sequences for Combination Model (Builderific)
Interim State Assembling sequences
The Combination Model Interim State A
Figure 4. Normality Graph for Performance Data
Because the data did not fulfill the classical assumption for the analysis of the variance (ANOVA) test, then the data were entered into a non-parametric test (Kruskal-Wallis). From the test results, it was shown that from the three variables only age variable had a significant difference on the performance (p ≤ 0.001). The results of the Mann Whitney U test as a post hoc test for performance show that the age variable had a significant influence on the performance (p ≤ 0.001). The result also shows that the elderly require a longer prediction time (x ̅ = 64.2808, SD = 0.67465) than the younger age (x ̅ = 59.4363, SD = 0.77900). Thus, it can be said that the performance of the younger age in the prediction task is higher than the older group of the operator. These results concurred with Desjardins and Warnke [7] which state that the peak level of ability to assemble objects and to understand the arrangement of the image is in the age of 16-34 (a young age) and will decrease after the age of 34 years.
Predictive accuracy. In this study, the predictive accuracy of an operator was measured by the deviation between the expected and observed position of the prediction location [3]. To complete a product assembly, the process has taken 8 sequences into account, and the assignment operator is only to predict the sixth position of the brick or product part. So in this study, an operator had a success prediction task if the expected and observed position is similar. The results show that the data are not normally distributed (p ≤ 0.001) as seen in Figure 5 and not homogeneous (p ≤ 0.001). The data were unqualified for the analysis of the variance (ANOVA) test, then the data were tested using the non-parametric category. Furthermore, the Kruskal-Wallis test was done to determine the influence of the model, products, and the age groups on the prediction
Figure 5. Normality Graph for Predictive Accuracy Data
capabilities. From the test results, it was found that the three variables had the value of Sig. <0.05, so that these three variables had influences on performance.
The results of the Mann Whitney U test as a post hoc test show that almost all models have significant influences on the predictive accuracy of the model except for the comparison between Human Behavior 1 and 2 (p = 0.781). Thus, among the models of Human Behavior 1 and 2 insignificantly, those affect the ability of prediction. The result also shows that the model that has the highest level of accuracy is the combination (x ̅ = 80.8333, SD = 2.54607), and the Human Behavior 1 model has the lowest levels of accuracy (x ̅ = 58.7500, SD = 3.18432). Thus, it can be said that the operator has a high predictive capability in the product assembly activity with the combination model and the most difficult model is the Human Behavior 1 model. This result has answered the question about a lower performance of Indonesians compared to Germans.
It can be said that Indonesians have a different behavior with Germans in assembly processes represented and models established in German culture that is not compatible with the cognitive system of Indonesians.
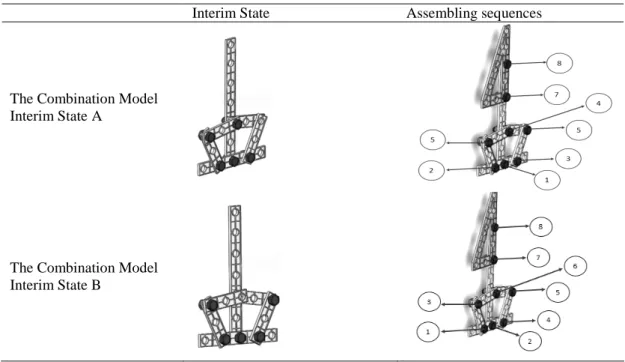
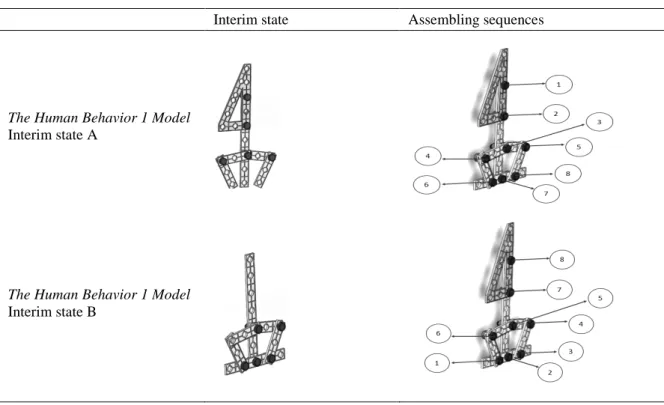
Table 3. Interim State and Assembly Sequences for the Human Behavior 1 Model (Builderific)
Interim state Assembling sequences
The Human Behavior 1 Model Interim state A
The Human Behavior 1 Model Interim state B
Whitney U test as a post hoc test for the comparison of the predictive ability shows that almost all types of products have significant influences on the predictive ability except for the comparison between Builderific B and Pulley B (p = 0.284). Thus, the Builderific B and Pulley B insignificantly affect the ability of prediction. The result also explains that the product that has the highest levels of accuracy is Pulley A (x ̅ = 92.9167, SD = 1.65946), while Builderific A has the lowest accuracy (x ̅ = 54.1667, SD = 3.22298). Thus, it can be said that the operator has a high predictive ability in a prediction task using Pulley with the interim state A, while the most difficult product to be predicted is the Bulderific with the interim state A.
The value of the predictive ability of the interim state A of the Builderific product is lower than that of most other types of products. This is due to the fact that no one of the participants from the younger group could predict the right next position when using the Human Behavior 1 model. 83.3% of them chose the seventh position and 16.7% chose the eighth position. From the result, it can be generalized that there is a tendency of the operators to finish the assembly in a straight line (one line) to then move to the other side. Similarly, the operators of the older age group als rendered a lot of prediction errors when using the Human Behavior 1 model. Only 6.7% successfully predicted precisely. Within the Human Behavior 2 model, the older age group render too many mistakes of predictions as well. Only 16.7% successfully predicted the assembly sequence in the sixth position.
The results of the Mann Whitney U test as a post hoc test for the ability of prediction show that age has a significant influence on the predictive capability (p ≤ 0.001). The results also reveal that the young age group has a higher level of predictive accuracy (x ̅ = 80.2083, SD = 1.82047) compared to operators who are included in the classification of the older age group (x ̅ = 69.5833, SD = 2.10204). Thus, it can be said that the young operators have a better predictive ability compared to the operators in the older age group. These results concurred with Desjardins and Warnke [7] which state that the peak level of ability to assemble objects and to understand the arrangement of the image is in the age of 16-34 (a young age) and will decrease after the age of 34 years.
Based on the model of the robot behavior, there are three possibilities of predicting the position of the assembly. The results of each model allow different positions and by doing so each position has the same opportunity. For example, the assembly sequences of the reference model were randomly designed, so the operator had freedom to fill the next position anywhere. Human Behavior 1 and 2 as the human-oriented models expected only one right position on the prediction task. Therefore, in this study it can be evaluated which model can be responded effectively and efficiently by the operator as represented in the high accuracy valued. In the combination model,
was defined to represent the difference between the expected position (Expected) and observations (Observed). Each position reference model had the same probability; therefore, the proportion of the value of this model is expected to 0.33 for each position. As for the other models, the proportion of the expected position was 1 (for the sixth position), 0 (for the seventh position), and 0 (for the eighth position). This arrangement was performed based on the production rules of the assembly pattern that only expected one predicted and right position. After knowing the difference of the prediction proportion, then the calculation of predictive accuracy can be taken into account. The results show the highest level of predictive accuracy in Builderific product belongs to the Human Behavior 2 model (0.76). These results mean that Indonesians have the highest predictive accuracy when using the model that is established based on the pattern of the Indonesian cognitive model. It can also mean that Indonesians may perform a lower performance than Germans [9] because there are different patterns or models of the cognitive system that configure the production rules in the assembly task. As for the Pulley product, the model that has the highest level of accuracy is the model of Human Behavior 1 which is 0.85. Additionally, the predictive accuracy can also be seen based on the interim state and the model of robot behavior for each of the products. For Builderific, the combination model with the interim state B has the highest value (0.80). As for the Pulley, Human Behavior 2 models with the interim state B has the highest value (0.97). Despite the high level of predictive accuracy in the reference model, it cannot be further analyzed because all predicted positions are true. Based on these results, there are different levels of prediction accuracy because of different patterns of cognitive systems between Indonesians (as represented in the Human Behavior 2 model) and Germans (as represented in the Human Behavior 1 model). Besides, the design of the assembled product also influences the prediction capability as aforementioned. The combination model partially adopts human assembly strategies. By doing so, the predictive accuracy was not optimally generated when the operators used this model.
4.
Conclusions
Based on the results of data collecting, processing, and data analysis, it can be concluded that the model of the human assembly strategy and producthas influences on the mental workload and the predictive ability. The age variable has an effect against the mental workload, performance, and the predictive ability. It can also be
concluded that Indonesians prefer to work with the model of Human Behavior 2 that is established from the cognitive system of Indonesians themselves. Thus, it means that Indonesians have a different pattern of the cognitive system compared to Germans. The further studies should analyze in detail the assembly strategy of Indonesian workers regarding the combination model because some high performances are also obtained when they work with this model. Another topic of a further study can consider working duration in order to assess the mental workload during the work using a different model, product, age or other variables.
References
[1] E. Herjanto, Manjemen Operasi, Ed. 3, Grasindo, Jakarta, 2008, p.484. [In Indonesian]
[2] M. Mayer, B. Odenthal, M. Faber, C. Winkelholz, C. Schlick, Cognitive Engineering of Automated Assembly Processes, Human Factors and Ergonomics in Manufacturing and Service Industries, Wiley Periodical, Inc., 2012, p. 21.
[3] N. Susanto, M. Mayer, R. Djaloeis, J. Bützler, C. Schlick, Proceedings of the 5th International Conference on Applied Human Factors and Ergonomics AHFE 2014, Kraków, Poland, 2014, p.294.
[4] G.B. Reid, S.S. Potter, J.R. Bressler, Subjective Beban Mental assessment technique (SWAT): a user’s guide. Wright Patterson Air Force Base, OH: Harry G. Armstrong Aerospace Medical Research Laboratory, 1989.
[5] M. Kim, J. Oh, J. Choi, Y. Kim, In: X. Wang (Eds.), User-centered HRI: HRI Research Methodology for Designers. Mixed Reality and Human-Robot Interaction, Springer, London New York, 2011, p.33.
[6] M.P. Mayer, C. Schlick, Conference Proceeding of the 4th International Conference on Applied Human Factors and Ergonomics (AHFE), USA Publishing, 2012, p.1272.
[7] R. Desjardins, A. Warnke, Ageing and Skills: A Review and Analysis of Skill Gain and Skill Loss Over the Lifespan and Over Time, OECD Education Working Papers, No. 72, OECD Publishing, 2012. [8] N. Meshkati, P.A. Hancock, M. Rahimi, S.M.
Dawes, Evaluation of Human Work: A Practical Ergonomics Methodology, 2nd ed., Taylor & Francis, London, 1995, p.782.