[Preliminary]
Do Class Size Effects
Differ Across Grades?
Anne Brink Nandrup
Department of Economics and Business, Aarhus University, [email protected]
This version: January, 2014
Abstract
Class size eects on pupil outcomes have been intensely analyzed in economics of education. The contribution of this paper is to study whether short-run class size eects are constant across grade levels in compulsory school. Results are based on administrative data on all pupils enrolled in the Danish public school system. By exploiting exogenous variation in class sizes created by a government imposed maximum class size rule, I am able to evaluate the eects of class size separately across both lower and upper primary school as well as lower secondary school. Signicant (albeit modest in size) positive eects of class size reductions are found for children in primary school. Also, the eects are statistically dierent across primary and secondary school.
Keywords: Class size, regression discontinuity, literacy, test scores JEL codes: I21, I28, C31
Acknowledgments. I gratefully acknowledge comments from Nina Smith, Maria Knoth Humlum and Helena Skyt Nielsen.
1 Introduction
This paper evaluates the short-run eects of class sizes on pupil performance across dierent grade levels of the Danish public school system1. More speci-cally, I estimate class size eects on pupil abilities within both mathematics and reading for children attending lower and upper primary school as well as lower secondary school, separately.
1I have chosen to denote the public primary and lower secondary school (or in Danish terms 'folkeskolen') as the public school system. Of course there are many other components of the public school system in Denmark, e.g. upper secondary schools and technical colleges. These are self-governing institutions in contrast to the public primary and lower secondary schools owned by the municipalities.
While there exists a vast literature estimating short- and medium-run class size eects in primary and secondary school, previous studies are often con-cerned with only one or a few close grades in the same setup (e.g. Heinesen and Browning (2007) on8thgraders, Finn and Achilles (1999)on kindergarten
through grade3, Angrist and Lavy (1999) on4thand5thgraders, and
Fredriks-son et al. (2013) on 4th−6th graders). Thus, there is little empirical insight
into the mechanisms of class size eects across the years of schooling.
There is a number of reasons why class size eects potentially dier across grade levels2. Pupils in their early school years may be more dependent on adult supervision and help, for example, peer-tutoring or group work may be more ef-fective in later grades (Blatchford and Mortimore1994). Teaching methods may
vary depending on the diculty level of the material taught. The self-control of pupils may increase with age as well as a number of other psychological factors presumably change as pupils mature. Also, parents may be more qualied to assist their children, e.g. with homework, supplementary reading etc., in the early school years. This potentially has large implications for the optimal class composition across compulsory schooling. Particularly, for certain institutional settings, such as the current Danish one, where pupils typically attend the same class throughout primary and lower secondary school.
The quality of the public primary and secondary schools have increasingly been at the center of attention in many countries over the course of the last decades. This follows partly from the recognition that the formation of human capital has important implications for both the individual and the society as well. As such, early test score measures of pupils' academic achievement are possibly strongly related to measures of sustained success in adulthood such as wages and length of education (Todd and Wolpin,2003). Additionally, public
school programs in numerous countries are faced with substantial budget cuts or periods of no growth in consequence of the global nancial crisis. Thus, school administrators and politicians on both national and local levels are preoccupied with creating the best school systems within a tight budget.
When considering schemes to improve the quality of school systems class and school sizes are a recurrent issue. They are readily measured and are in general considered easier to manipulate than other school inputs. Furthermore, class size reductions seem to be popular with (almost) every party interested in schools such as parents, teachers, school administrators etc. However, reducing class sizes are expensive; In Denmark, teachers' salaries alone constitute80pct.
of compulsory schooling expenditure. Thus, class size increments comprises large potential monetary gains in terms of budget savings - if there are little or no adverse eects of increasing the number of pupils in a class room.
Exploiting test results from the unique Danish national test system in com-bination with detailed register-based data, I am able to identify the eects of changes in class size on contemporaneous cognitive ability estimates for at least three dierent levels of compulsory schooling. Following in the footsteps of
An-2The same arguments apply to possible dierences in class size eects across subjects such as reading and math, as these are generally perceived to be based on very dierent mindsets.
grist and Lavy (1999), I employ a fuzzy regression discontinuity design arising
from a mandatory maximum class size rule of 28 pupils. I apply this
identi-cation strategy to data covering pupils enrolled in the 2nd/3rd, 6th and 8th
grade in the Danish public school system between 2009/2010 and 2011/2012.
Furthermore, in order to gain insight into the dynamics of class size eects, I estimate the eect of class size on reading and math test results, respectively.
I nd that signicant (albeit modest) positive eects of class size reductions are present in the Danish public school system where the average class size is
21with a modal value of 23. Most eects of a class size increment in primary
school are signicantly negative, whereas none of the 8th grade estimates are
signicant. More importantly, under certain circumstances I am able to reject that the results do not dier across grades levels. Furthermore, I employ a wide range of robustness checks to underpin the validity of my results.
The remainder of the paper is organized as follows. Section 2 reviews
rele-vant literature and places the contribution of this study within that. Section3
summarizes the institutional setting of the Danish public school system and the national test system while Section4 presents the available data as well as the
identifying variation of the IV estimates. The identication strategy is described in Section5 where empirical results are presented and discussed in Section 6.
Finally, Section7summarizes and concludes.
2 Literature Review
In accordance with the importance of the topic, the literature in the area of schooling inputs is extensive. In the following, I highlight selected contributions that are of particular relevance to this paper, thus, focusing on the estimation of causal eects of class size.
A primary goal of the education production function literature is to under-stand the technology of schooling inputs such as class size in the creation of cognitive achievement outcomes. The analogy between education production and rm production should be interpreted with caution, however (Hoxby2000).
The production function of a rm is the result of maximizing an objective func-tion given a set of producfunc-tion possibilities, but such maximizafunc-tion objectives are not imposed on schools. Even though a reduction in class size necessarily increases the opportunity of investment in the ability formation of the child, it is not obvious that these opportunities are seized depending on the incentives faced by the respective schools. For example, teachers, who suddenly experience a class size reduction, may not adapt his/her teaching methods accordingly.
Lazear (2001) proposes the 'Disruption model' to explain the eect of class
size on pupil outcome. Here, class room learning is considered a public good. Thus, congestion eects, where one pupil impedes the learning of all others, are increasing with class size assuming the probability of a pupil interrupting is constant across individuals. Because teaching is temporarily suspended during an interruption, the negative externality to everyone else in class is increasing
with class size. Consequently, optimal class size is larger with more well-behaved pupils or if particularly dicult children are selected into smaller classes by school administrators. While not incorporating all (dis)advantages of class sizes, this model proposes a specic functional form for the educational production function. Using the framework of Lazear (2001), class size eects likely dier
across grade levels if one is willing to entertain the notion that the probability of a given child behaving disruptively is not constant across age and grade level. On the empirical front, class sizes are rather dicult to study because the majority of class size variations is likely the result of choices made by parents, school administrators, teachers and politicians on a local or national level. Thus, the variation of class size is potentially correlated with other determinants of pupil achievement (Hoxby2000), and OLS estimates do not have causal
inter-pretation. Parents focused on the education of their children may choose to locate close to schools with more resources per pupil (corresponding to a lower class size) or otherwise self-select into such schools. Furthermore, as proposed by Lazear (2001) school administrators may chose to allocate pupils with
learn-ing disabilities or from disadvantaged backgrounds to smaller classes, hoplearn-ing that they will not be left (further) behind. And also, larger classes may be assigned extra teaching hours assuming that it is not the class size itself deter-mining pupils' test results but rather teacher resources per pupil. All of which causes upward-biased estimates of class size eect on pupil achievement. On the other hand, parents may choose to invest less in their children when per pupil school resources are high, resulting in a downwards bias of the estimated direct eect of class size. Datar and Mason (2008) nd evidence that class size and
parental investment are complements for certain parental inputs while they are substitutes for others. Along this line, the estimated eects should in general be interpreted as 'total policy eects' because of limited data on other school inputs (Todd and Wolpin 2003). I.e. the total eect of an exogenous change
in class size that include both the ceteris paribus eect of class size as well as an indirect eect through responses of other inputs to the formation of human capital. Although one is usually most interested in the total policy eect, these estimates provide little insight into the nature of the human capital production function.
Tennessee's STAR experiment, where pupils are randomly assigned to classes of varying size, has given rise to a number of studies focusing on the rst four years of compulsory schooling, e.g. Krueger (1999), and Finn and Achilles (1990)
nd that attending a class of13−17pupils improves test scores by0.15−0.28
standard deviations compared to a 'regular' class size of22−25pupils in
kinder-garten trough grade 3. Equally important, this eect seem to be lessened for
pupils entering the small classes at a later point. By comparing IV estimates of class size eects in the regular classes to those obtained between large and small classes, Krueger (1999) does not nd evidence in favor of the Hawthorne
phenomenon, where individuals, knowing they are being evaluated, act to in-crease their productivity. In order to be eligible for participation in the STAR project, schools had to be large enough to accommodate at least three classes
in each grade implying that at least57pupils should be enrolled in each grade.
This is somewhat larger than the average Danish public school (see Table 2). Also the eects of class sizes in upper primary school have been heavily estimated. The identication method presented in this paper is similar to that of Angrist and Lavy (1999). They were the rst to propose an instrument based
on fuzzy discontinuities in class size triggered by administrative maximum class size rules. Applying this strategy to Israeli3rd, 4th and 5th graders they nd
evidence of signicant negative eects of a one-pupil class size increment on the distribution of class test score means for Israeli 4th and 5th graders3. These
results are not directly comparable to those of the STAR project, but after recalculating, the authors estimate them to be in the lower end of the ndings from the Tennessee STAR project. On an individual level the class size eects of 3rd graders are numerically smaller and all insignicant4. Unfortunately,
the only control included in addition to functions of enrollment is an index of the fraction of pupils from disadvantaged backgrounds; based on a function of the father's education, continent of birth, and family size. Fredriksson et al. (2013)5slightly alter the identication method and nd signicant negative
eects of increasing the average class size in the4th−6thgrade largely in line the
Tennessee STAR ndings. Moreover, the authors are able to identify signicant benecial long-term eects e.g. on adult wages. Thus, recent evidence suggest that short-run class size eects of at least upper primary school are potentially highly persistent.
Trying a dierent approach, Hoxby (2000) uses both an instrument based on
cohort size arising from natural variation in the timing of births as well as one based on maximum class size rules on 4th and 6th graders from Connecticut.
Because the two identication strategies are independent, she argues that the two methods can be used as checks on each other. Nevertheless, she nds only insignicant eects (of varying sign) of a class size reduction on pupil test scores for the two grade levels. Bingley et al. (2007) question the validity of the
birth-rate instrument because parents very likely have better information than the researcher concerning the forecast of local cohort size, and may take action accordingly.
Using the same approach, Heinesen and Browning (2007) nd modest and
marginally signicant negative eects of larger class size on years of education for Danish 8th graders. While Heinesen (2010) nds signicant and
substan-tial positive eects on 9th grade examination marks in French from reducing
class sizes using within-school variation over time in the subject-specic French classes.
Summing up, there is more or less convincing evidence that class size
reduc-3The authors only has access to micro-level data on3rdgraders.
4The authors argue that this is likely caused by dierent test conditions. 3rd graders were tested the year after the other pupils and consequently teachers had the opportunity to prepare the pupils for the test.
5The authors use a representative sample of approximately5−10pct. of Swedish cohorts born in1967,1972,1977, and1982that is further reduced by restricting the sample to pupils residing in single-school school districts.
tions are benecial for pupils across most grade levels in compulsory schooling. Unfortunately, comparison of these eects are complicated by the varying insti-tutional settings across countries as well as the outcome measures seldom being comparable. In this paper, I will attempt to remedy this by employing the same identication method across grade levels in the Danish public school sys-tem while using directly comparable measures of pupil ability as the outcomes of interest.
3 Institutional Setting
In this section, I will provide an overview on the institutional setting pertaining to the grade levels and school years in the scope of this paper. In 2009 the
Danish legislation was changed from nine to ten years of compulsory schooling. In eect this means that children must now receive teaching from the calendar year they turn six years old, beginning with preschool.6 In contrast, preschool was optional before2009with compulsory schooling beginning with1stgrade in
the year of the pupil's seventh birthday. However, schools were still obliged to provide a preschooling scheme which was already chosen by the vast majority of parents (Nikolajsen and Molsgaard2012). The amendment seems to only have
motivated a more 'timely' commencement of schooling, in the sense that fewer pupils are being held back a year before entering the school system. The2nd
graders of the school year2011/2012are the only ones in the sample inuenced
by the sparse eects of the amendment.
Public schools are free, run and nanced by local municipalities through mu-nicipality income tax in combination with a complex between-mumu-nicipality re-distribution scheme subsidizing expenditures in low-income municipalities, and subject to a maximum class size rule of 28 pupils per class7. In reality, class
sizes vary considerably across schools and cohorts. This is partially caused by some municipalities adopting an even lower suggested maximum class size rule, both to ensure a better learning environment for the pupils from the perspective of potential negative eects of larger class size as well as further minimizing the risks of having to split up already existing classes, with the increased costs that follow. In eect, this means that the28 pupil rule may not be binding for a
(unknown) subset of municipalities. To accommodate this potential pitfall, I will identify the empirical maximum class size rules of the specic municipali-ties and present results based on this along side with the primary specication results in Section 6 .
There are98 municipalities in Denmark. Each municipality is divided into
one or more school districts, where the aliation of the pupil is determined by his/her ocial residential address.8
6Homeschooling satisfying ocial standards is a valid substitute but this is rarely practiced in Denmark.
7Admission of up to30pupils per class during the school year is accepted in order to counteract potential class divisions outside of the summer break.
Approximately 14−15percent of Danish children are enrolled into private
schools in the school years of 2009/2010−2011/2012. Various types of
inde-pendent private schools exist, such as religious or ideology based, while others simply constitute an alternative to the public school system. In Denmark, pri-vate schooling is heavily subsidized with almost 85 pct. of the expenditures
covered by the local municipalities. Still, Bingley et al. (2007) note that Danish
private schools are disproportionally attended by the children of highly educated parents. Private schools are mostly found in urban areas and in general they have a lower mean class size.
Generally, pupils are divided into classes when they enroll in preschool and follow the same class throughout the years of compulsory schooling with few exceptions, for example elective third language (most commonly German or French). These are usually not introduced until7th grade and onwards.
The Danish public school system is built on the principle that pupils should not be divided according to ability or social background (Wandall 2010). In
fact, this is prohibited by law. This means that dierential treatment is only justiable when it oers each pupil the opportunity to achieve as much as possi-ble regardless of his/her background. Consequently, there are no elite schools or classes in the public system. There is, however, considerable variation in ability within classes.
Since the school year of2009/2010 pupils enrolled into Danish public schools
have been subject to ten mandatory tests within dierent subjects across com-pulsory schooling. Acknowledging that learning processes may dier across lin-guistic and logical subjects this paper primarily studies test results in reading (2nd,6th, and8thgrade), math (3rdand6thgrade), and physics/chemistry (8th
grade). In order to be able to analyze the eects of class size across lower and upper primary as well as lower secondary school this last substitution is neces-sary as pupils are not tested in math after the6thgrade. Furthermore, physics
and math are often considered to be based on a somewhat similar mindset. The tests are conducted in January through April in each year, they are compulsory9, IT based, adaptive, and self-scoring, thus, the teacher is only presented with the test scores and is accordingly not able to bias the results.
The adaptiveness of the tests should ensure that ability of the pupils are very precisely evaluated including the top and bottom ability pupils, see Beuchert-Pedersen and Nandrup (2014). Also, the nature of the tests make them qualied for comparison both across and within individuals.
Even though there is no formal division between the dierent grades of the
area. The decision-making authority is the municipality and some school districts have more than one school. Also, since2006 pupils are not required to attend the district school but they are entitled to.
9Dispensation of pupils can be granted if the school, in agreement with the parents, esti-mates that a pupil is unable to nish the test while obtaining a test score that is useful in the evaluation of the child's teaching plan. Thus, one has reason to suspect than mainly inferior pupils are exempt from taking the tests.
Danish compulsory schools, I choose, in accordance with the institutional set-tings of other countries, to divide the grades in three groups: lower primary school, consisting of preschool and1stthrough3rdgrade; upper primary school,
containing 4th, 5th and 6th grade; and lower secondary school with grades 7
through9. Thus, I am able to examine and compare the eects of class size
in each of the three school levels. Additionally, it is municipalities rather than schools independently that nance the incurred expenditures associated with the maximum class size rule. This means that class size eects in the Danish setting are found without holding school budgets xed; the costs of assignment according to the rule are met across all schools in the municipality (Bingley et. al. 2007).
4 Data and Identication
4.1 Data sources and sample selection
School enrollment into the Danish schools is registered in the beginning of each school year (early September). As such, this registry contains yearly class and school information of all individuals admitted in the Danish school system and from this it is possible to construct beginning of the school-year class sizes and enrollment counts of each grade in each school.
To this data, I match register-based information linking pupils to parents, along with a rich set of pupil and parent characteristics. The added data include information of parents' educational level, age, and yearly earnings in the year the child turns six years old, civil status of the mother, ethnicity, date of birth, birth weight and gestation length, as well as degree of urbanization of the school municipality, and the number of siblings etc. Pupil academic performance is measured by the national test scheme. This outcome is standardized to mean 0 and standard deviation 1 in accordance with Beuchert-Pedersen and Nandrup (2014). School information and test data are reported to UNI-C, an agency under The Danish Ministry of Children and Education, while data on annual earnings come from the Income Tax Register. Both registers are maintained by Statistics Denmark.
Using beginning of the school-year enrollment is of course not accurate seeing as pupil performance is measured in January through April. However, beginning of the school-year enrollment is less likely to be aected by the behavior of parents or school administrators (Angrist and Lavy 1999). Also, it is likely that class size during the school year is what matters for education attainment rather than just the class size at the time of the tests. This naturally implies that there is a slight chance that some pupils have changed school in the intervening time and thus, do not take the test in the class they are registered to. However, unless extraordinary circumstances are present, it is not unreasonable to assume that parents generally choose to time the school changes of their children during the summer period, where there is a natural break in the lessons.
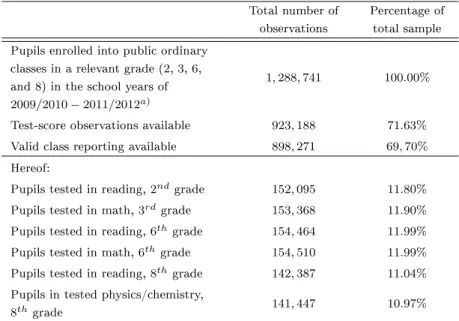
Total number of observations
Percentage of total sample Pupils enrolled into public ordinary
classes in a relevant grade (2,3,6, and8) in the school years of 2009/2010−2011/2012a)
1,288,741 100.00%
Test-score observations available 923,188 71.63% Valid class reporting available 898,271 69,70% Hereof:
Pupils tested in reading,2ndgrade 152,095 11.80% Pupils tested in math,3rdgrade 153,368 11.90% Pupils tested in reading,6thgrade 154,464 11.99% Pupils tested in math,6thgrade 154,510 11.99% Pupils tested in reading,8thgrade 142,387 11.04% Pupils in tested physics/chemistry,
8thgrade 141,447 10.97%
Notes. a)indicates that pupils in the6thand8thgrade are are included twice, as they are tested
twice at this level.
Table 1: Sample selection procedure of the estimation samples in all relevant grades subject to reading, math, and physics/chemistry tests
2nd, 3rd, 4th, 6th, and8thand who have completed these tests in the school
years of 2009/2010 through 2011/201210. Nearly all pupils appear multiple
times as they have completed multiple tests in this three year period. Only very few pupils have erroneously completed the same test twice or completed a test of a dierent grade level. Hence, I follow ve cohorts of pupils for a maximum of three subsequent school years. Table 1 summarizes the sampling procedure.11
4.2 Descriptives and Identifying Variation
Table 2 summarizes the descriptives of the six relevant subsamples by test infor-mation along side with the within pupil subsamples. Average enrollment count in the relevant grades is50−61with an average class size of approximately21
pupils, however, on average0.5pupils in each class do not take the test. Across
the subsamples, enrollment counts are approximately 10 individuals larger in 10This scope is chosen as test results are not available before2009/2010. Moreover, in October2012the Danish Ministry of Children and Education launched a large experiment including two teachers in the daily teaching covering public school in18Danish municipalities. 11A relatively large fraction of the missing test scores is due to technical problems in the implementation process (Wandall, 2010). In particular in2010 the test system was shut down for two weeks and all test bookings in this period was lost. Unfortunately, not all schools managed to rebook the lost test slots, thus, not all pupils managed to complete the compulsory test. The 2013 evaluation report (Rambøll (2013)) establishes that the missing test results in connection to the break down are randomly distributed across pupils.
Estimation sample
Variable Mean S.d. Min Max Mean S.d. Min Max
Reading,2ndgrade Math, 3rd grade
152,095obs.,8,028classes 153,368obs.,8,279classes Enrollment 50.57 22.38 1 145 49.98 21.77 1 135 Class size 21.19 4.08 1 61 21.17 4.05 1 54 Test class size 20.54 4.29 1 59 20.48 4.27 1 54
Reading,6thgrade Math, 6th grade
154,464obs.,8,259classes 154,510obs.,8,282classes Enrollment 50.14 21.29 1 159 50.23 21.33 1 159 Class size 21.36 3.93 1 68 21.34 3.89 1 68 Test class size 20.90 4.12 1 51 20.88 4.09 1 47
Reading,8thgrade Physics/chemistry,8th grade
142,387obs.,7,757classes 141,447obs.,7,737classes Enrollment 60.79 22.56 1 182 60.73 22.62 1 183 Class size 21.85 3.61 1 60 21.84 3.60 1 60 Test class size 21.12 3.90 1 54 21.13 3.89 1 54 Notes. Data is based on pupils enrolled in normal classes of the Danish public school system in the school years of2009/2010to2011/2012and tested through the national test scheme.
Table 2: Introductory descriptive statistics of supsamples of the full estimation sample
the8thgrade while mean class size is increased with around0.5pupils. This is
most likely caused by schools admitting pupils from other schools that only teach lower and upper primary school. Finally, note that descriptives of subsamples of dierent tests performed in the same grades are very similar.
Figure 1 illustrates the distributions of class sizes in the full estimation sam-ple. A few (3.93 pct.) of the classes in the sample are very small (below 14
pupils) while0.4 pct. are larger than28pupils, and of these only95exceed the
ocial maximum of 30. These are mostly results of experimental classes with
for example both a teacher and a pedagogue/teacher aid assigned to the class, or they could potentially be results of erroneous reportings of class names. I have chosen not to exclude these, because I am hesitant to condition on the potentially endogenous variable. Furthermore, all result in Section6are robust
to the exclusion of 'too' large classes. The modal value of class size is23.
As originally carried out by Angrist and Lavy (1999), I use the exogenous
variation in class sizes created by the maximum class size rule of 28 pupils
as instrument for the potential endogeneity bias of class size. Following the authors, the predicted class size function, assuming cohorts are divided into classes of equal size of gradegin school sin yeart12, is given by (1):
fgst=egst/(f loor((egst−1)/28) + 1) (1)
12For simplicity, thetsubscript is omitted in the remainder of this paper, but all instruments are based on the enrollment count of grades in the relevant years.
The gure shows the distribution of the pooled class sizes in grades2,3,6,and8of the Danish
public school system in the school years of2009/2010−2011/2012.
Figure 1: Distribution of class sizes, the full estimation sample
whereegstdenotes the enrollment count of the grade, and28is the maximum
number of pupils in one class. The functionf loor(n)returns the largest integer
less than or equal to n, for any number n. (1) reects that according to the maximum class size-rule enrollments of up to28pupils are assigned to one class
while enrollments between 29 and 56 are divided into two classes of 14.5−28
pupils each, etc.
Figure 2 illustrates the relationship between school enrollment on the grade level on the horizontal axis and predicted as well as mean observed class sizes on the vertical axis in the full estimation sample. The line captures predicted class size while the dots mark observed mean class size of each enrollment count. Even though predicted class size based on at most28 pupils per class is presumably
not the only factor explaining class size, it clearly has large explanatory power over observed class size - at least below enrollment counts of 100.13 Figure 2
shows how the probability of treatment (being assigned to a small class) in a fuzzy regression discontinuity context should be higher to the right of the cuto rather than to the left. But treatment is not guaranteed (thus, 'fuzzy').
As identication only arises when the rule binds, I am disregarding useful variation by including all municipalities. However, obtaining information of suggested class size rules on a municipality level would require substantial re-sources. Furthermore, these suggested guidelines are, as previously mentioned, not mandatory and the school is still obliged to enroll pupils moving into the school district.
13See Figure A.1 of the Appendix for a more detailed grade-level overview of the relation between predicted and mean observed class size. The strong pattern is largely consistent across grades with a somewhat poorer t for the eighth grade.
The gure shows predicted and mean observed class size for pupils in grades2, 3, 6, and 8in
Danish public schools for the school years of2009/2010-2011/2012. The predicted class size function
indicated by the blue line is based on administrative rules ensuring a maximum of28pupil per class.
Figure 2: Predicted and mean observed class size by enrollment, the full estimation sample
4.2.1 Inclusion of Controls
The detailed register-based information of the Danish population allows me to include rich set of controls in the regressions. Specically, I incorporate controls regarding birth information, the parents' socioeconomic status, school characteristics and class characteristics of the child.
Birth information of the child includes indicator variables for quarter of birth, birth order of the child by the mother, multiple born (e.g. twin), gen-der, and age as well as birth weight and length of gestation. Previous studies have found severe long-term eects of being born prematurely or with low birth weight. For example, Black et al. (2007) show that higher birth weight
signi-cantly increases IQ scores of18−20-year-old Norwegian males as well as
edu-cation attainment and adult earnings, while Clark et al. (2008) nd evidence of
lower cognitive abilities as well as poorer self-regulation for prematurely born children.
Socioeconomic status of the family includes indicator variables of the highest attained educational level of each parent in the child's sixth year, the marital status of the mother and the ethnicity of the child (both western and non-western immigrant and descendant hereof), as well as the logarithm of each parent's yearly earnings, the age of the child's parents and the number of siblings based on the births of the mother at the year the child turns six years old.
School characteristics include indicator variables for degree of urbanization of the school municipality and school year as well as functions of enrollment into the dierent grades of the school.
Furthermore, I add class characteristics, such as mean academic perfor-mance, mean education and log-earnings of the parents, share of girls and non-western immigrants among the other pupils in the class (excluding pupili), to certain model specications. A number of studies have suggested both negative disruption eects and positive spill-over eects on readings and math scores of (especially classroom) peers in both primary and secondary school (e.g. Burke and Sass2013).
A complete list of controls including descriptive statistics hereof is found in the Appendix (Table A.1).
4.2.2 Is the Regression Discontinuity Design Valid at School Level? In a regression discontinuity context, random assignment of treatment intensities may be undone by parent/administrator sorting when the treatment is public knowledge (McCrary2008). Thus, validity of the instrument relies heavily on
the absence of discontinuities in the distribution of grade enrollments at the thresholds created by the28-pupil rule as this indicates sorting by municipality
administrators.
Because of discontinuities in the enrollment count of Swedish schools Fredriks-son et al. (2013) are compelled to disregard enrollment on a school level and
focus on school-district enrollment instead. The problem arises as Swedish leg-islation encourages adjustment of school catchment areas within school districts such that the needs of the pupils as well as resources at the public schools are utilized optimally. Urquiola and Verhoogen (2009) documents an extreme case
of bunching on the basis of the maximum class size rule in Chilean subsidized private schools. The number of schools to the right of the cuto points are approximately ve times larger than to the left.
In Denmark, the decision-making authority regarding school districts and school catchment areas lies with the municipality. Thus, municipalities are entitled to change the school catchment areas and school districts if deemed necessary. In practice this entitlement is implemented very dierently across Danish municipalities, and I have only been able to nd very few examples of a municipal council revising school districts yearly in order to utilize school capacities. Furthermore, a liberal choice of schools should at least partly oset this.
Figure 3 illustrates the distribution of enrollments on school level for 1st
graders in the school year of 2009/2010. As municipalities can only adjust
school catchment areas before cohorts enroll into schools and kindergarten was not made mandatory until2009, 1st grade enrollment is the most relevant
dis-tribution to examine. By visual inspection one cannot reject the presence of a slight drop in the fraction of schools with enrollments into grade1around the
rst cuto, while around the subsequent thresholds there is no clear evidence of discontinuities. In short, I do not nd clear indications of bunching below the cuto points in the distribution of grade enrollment, but I cannot reject the existence of a small (albeit important) potential problem of manipulation of enrollment counts around the rst cuto. Schools are not able to manipulate
The gure shows the distribution of school enrollment into the1stgrade of Danish public schools
in the school year of2009/2010. Vertical lines indicate the cuto points created by multiples of the 28-pupil rule.
Figure 3: Distribution of enrollment in grade1,2009/2010
enrollment, however. This can only happen at the municipality level.
It is highly probable that better schools face increased demand, because parents caring about schooling inputs would selectively choose schools based on school quality. This is, however, likely to be a smooth function process and not reecting the up-and-down pattern created by the28pupils rule (Angrist and
Lavy1999). Nonetheless, enrollment is likely to be related to pupil performance
for reasons other than changing class sizes. A necessary assumption for identi-cation, the independence assumption, requires that there is no direct eect of the instrument (or its underlying assigning variable, enrollment) on pupil per-formance, except through its impact on class size, thus, the need for including sucient controls for enrollment eects is apparent. A natural implication of this assumption is that parents and administrators do not selectively exploit the administrative rules. However, the liberal Danish legislation regarding choice of schools reduces the costs of the parents of manipulating enrollment and class size for at least two reasons:
Since2006pupils have been entitled but not obliged to enroll in the district
school. This means that parents can apply for enrollment in the other schools of the residential municipality - or even of other municipalities. These schools are then required to accept the pupil provided that they have available places (i.e. they do not have to introduce a new class based on the maximum class size rule) (Undervisningsministeriet, 2010). If the popularity of the school is
larger than the number of free seats, the pupils are selected according to a list of criteria including traveling distance and the presence of siblings at the school. Also, parents can choose to enroll their children in heavily subsidized private
schools (see Section 3).
The low costs of changing schools is potentially problematic as parents may be more likely to exploit the maximum class size rule and undo the random as-signment of class sizes. But to the extend that parents are not able to precisely manipulate the assignment variable the variation in treatment near the cuto points should be randomized (Lee and Lemieux2010). Intuitively, parents may
be able to predict class size crudely based on maximum28pupils in each class,
but as treatment depends on the enrollment of all other children in the class, it would be very risky to actively choose schools based on enrollments just above the cutos. This becomes increasingly riskier in larger schools, but is seems unlikely that parents would select their children into very small public schools, usually located in the country side, to be certain of a small class size as it would commonly imply large transportation costs and potentially poorer family char-acteristics of the classmates. Additionally, there may be other costs related to small schools such as less specialization and diversity of the teacher sta and less exibility of the school day. To some extend, this applies to the municipality administrators as well. They are able to estimate the number of children in each school district based on the previous year, but they cannot completely predict the number of children moving in to the municipality nor where they will live or their school preferences. Hence, there is reason to believe that the instrument has greater validity in small intervals around the enrollment thresholds14. Unfortunately, data on school resources are not available, and consequently I am unable to examine whether schools compensate pupils in larger classes e.g. by use of remedial training or extra supervision.
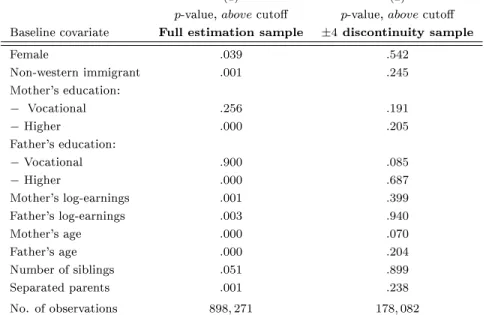
In order to assess the validity of the instrument based on potential parent manipulation, Table 3 shows the results of regressing the pooled indicator for being above an administrative threshold on selected baseline variables (the cor-responding estimates of the remaining predetermined characteristics are found in Table A.2 of the Appendix). For simplicity I have chosen to pool the in-struments such that the abovecuto equals unity when grade enrollment in a school supersedes one of the cutos. Column (1) shows regression results of
the full estimation sample for grades2, 3, 6 and 8. Here, only a few baseline
characteristics are unrelated with the pooled instrument. However, based on the correspondingp−values of the±4discontinuity sample in column(2), none
of the predetermined characteristics, except the age of the mother, the indicator of father's education being vocational and length of gestation, are related to the instrument.15
14In the following, the±4discontinuity sample refers to a sample including pupils enrolled in schools with a grade enrollment of±4 pupils around the three lower thresholds (28,56, and 84). The sample is restricted to these threshold based on the aforementioned greater predictive power of the instruments here (see Figure 2). Descriptives of the±4discontinuity sample are found in Table A.3 of the Appendix.
15Performing an OLS regression of theabovedummies on all baseline covariates simulta-neously in the±4 discontinuity sample yield similar results. Only the coecients of birth weight and length of gestation are statistically signicant, however, because of the small num-ber of clusters in the discontinuity sample anF-statistic cannot be calculated. Adjusting the
(1) (2)
p-value,abovecuto p-value,abovecuto
Baseline covariate Full estimation sample ±4discontinuity sample
Female .039 .542
Non-western immigrant .001 .245
Mother's education:
− Vocational .256 .191
−Higher .000 .205
Father's education:
−Vocational .900 .085
−Higher .000 .687
Mother's log-earnings .001 .399
Father's log-earnings .003 .940
Mother's age .000 .070
Father's age .000 .204
Number of siblings .051 .899
Separated parents .001 .238
No. of observations 898,271 178,082
Notes. The above cuto indicator equals1if the school enrollment at grade level exceeds a
thresh-olds created by the28pupil rule up to+14pupils (+4pupils in the discontinuity sample). Columns
report thep-values fort-tests of the signicance of the pooled class size instrument by separate OLS
regressions on the variables listed in each row. The following controls are also included in the re-gressions: Year and enrollment segment xed eects, indicator variables of degree of urbanization of the school municipality and linear and square controls for grade enrollment interacted with separate thresholds (only for the full sample). Standard errors adjusted for clustering by enrollment count are in parenthesis.
Table 3: Balancing of covariates
5 Estimation Strategy
Because of nonrandom selection of pupils into classes, class sizes are potentially endogenous and hence simple OLS estimates of eects on test scores may be biased and without causal interpretation. However, by exploiting the exogenous variation in class size induced by administrative rules, it is possible to interpret the eects of class size on pupil achievement causally (Angrist and Lavy1999),
given validity of the instrument.
The class size eects of pupil test scores are assumed to be explained by a standard reduced-form education production function:
θicgsτ =Xicgsα2+α1CScgsτ+ϕτ+gkτ(egs) +εicgsτ (2)
where θicgst denotes the standardized test score of individual i in class c
of gradeg at school s at enrollment segment τ. Xicgs is a vector of controls
standard errors for clusters by schools instead yields aF-statistic of approximately67, thus rejecting that the covariates are jointly unrelated to the instrument. This is not surprising seeing as the number observations in the regression is quite large.
including characteristics of pupil i (family information, gender, birth weight etc.), degree of urbanization of the school municipality and characteristics of class c16 etc. See Table A.1 for a complete list of controls. CScgs denotes
the observed class size and the residualεicgsτ is pupil specic. I have included
segment xed eects,ϕτ, to accommodate dierent patterns around the separate
enrollment thresholds17. Also, I have allowed the coecients of the enrollment functions,gk
τ(egs), wherekis the order of the polynomial, to vary by segment.
The preferred specication of this paper does not include the expected class size as a function of enrollment from (1). Rather I exploit a dummy variables ap-proach taking on the value1if grade enrollment is above the threshold and zero
otherwise. This highlights the quasi-experimental identication strategy of the RD design and excludes the smooth variation in the predicted class size between thresholds. More specically: indicator variables, above28 = 1(28< e≤42),
above56 =1(56< e≤60)etc.18, act as instruments, thus wheneis to the right of the cuto point the probability of treatment (small expected class size) is high, otherwise there is low probability of treatment. Heinesen and Browning (2003) argue that this is the most appropriate specication because only
varia-tion in the instrument around the cuto points is used, while Fredriksson et al. (2013) is concerned that this specication results in a potential eciency loss as
the variation of treatment intensities, as a result of varying jumps in predicted class size, are not utilized. The authors conclude that the eciency loss appears limited. Given the binary instruments class size is assumed to be explained by CScgsτ =Xicgsγ2+γ1abovegs+φτ+qkτ(egs) +υicgsτ (3)
whereabovegsdenotes the vector of dummy instruments,φτare the segment
xed eects,qk
τ(egs)the enrollment polynomial of the kth order, and υicgsτ is
the residual from the regression ofCS onX, the instrument indicators, along
with segment xed eects, φτ, and functions of enrollment, qkτ. It captures
the remaining factors that are correlated with enrollment that are very likely also correlated with the test achievements of pupils. By allowing the enrollment polynomials to vary by segment, I follow Fredriksson et al. (2013) and eectively
consider each threshold as a dierent experiment.
The model (2)-(3) is estimated using two stage least squares (2SLS), where the estimates ofα1is of primary interest.
In subsection 4.2.2 I have already touched upon the identifying assumptions for causality of the IV estimand. Additional to the independence assumption (also known as the non-parametric version of the exclusion restriction), neces-sary assumptions include the stable unit treatment value assumption (SUTVA)
16Class characteristics are not included in all specications.
17Each segment consists of grades with enrollments in an interval±14pupils around thresh-oldτ: ϕτ =1(egs∈eτ±14), whereeτ ={56,84,112,140,168} . The rst segment also include enrollments below15pupils: ϕ28=1(egs≤42).
18Note that based on the pattern of Figure 2, it is questionable whetheraboveindicators of the fourth, fth and sixth cuto points are valid instruments. This applies forfgsas well and motivates a thorough analysis of subsamples.
and monotonicity. SUTVA is a common although, not a trivial assumption in the literature on causality. Monotonicity in this setting requires that for each child attending a school with a grade enrollment count above the administrative thresholds, the class size is at most as large as it would have been if the grade enrollment of the school was below the cuto. As the independence assump-tion the monotonicity assumpassump-tion is non-veriable because of the counterfactual nature of the observations19. In both cases it applies that the stronger the in-strument the less sensitive the IV estimand is to violations of the assumption (Angrist and Imbens1995).
I refer to the parameterα1 as the average causal response (also known as the
local average treatment eect (LATE) for binary treatments). It captures a weighted average treatment eect to a unit change in class size for the unidenti-ed subpopulation of pupils whose treatment status is aectunidenti-ed by the instrument (see Angrist and Imbens (1995) for theoretical derivation). The weight attached
to the average eect of a unit change in treatment is proportional to the num-ber of pupils who, because of the administrative rules, are induced to attend a class withnor fewer pupils instead of one with more thann. These pupils are commonly known as the group of compliers. The group of compliers need not be representative of the entire population of pupils nor is it possible to identify because one naturally only observes a single counterfactual treatment status. Furthermore, membership of this group varies with the choice of instrument (Wooldridge2002).
6 Empirical Results
This section quanties the eect of class size on math and reading scores using the empirical approach outlined in Section 5. All reported standard errors are clustered to account for group structures within grade enrollment of the resid-uals.20 Because of the fuzzy RD design and the discreteness of the assignment variable, the conventional IV sampling errors ignore this structure and may overstate the precision of the IV estimators.
6.1 Specication Analysis
Table 4 shows the 2SLS estimates of the eect of class size on reading and math scores using a selection of enrollment controls. For the sake of clarity, the specication analysis is presented only with the pooled test score information for reading (the 2th, 6th, and 8th grade) and math/physics (grades 3, 6, and
8), respectively. In addition, I provide information of the rst-stage F-test of 19It does, however, have testable implications for multivalued treatment intensities. See Appendix B for an analysis.
20Clustering on the grade enrollment level in IV estimations is suggested by Lee and Card (2008) and performed in Fredriksson et al. (2013). This yields146clusters in the full estima-tion sample, a considerably higher level compared to clustering on school grade level where my instrument varies. Thus, standard errors are slightly larger but the dierence is modest.
Model (1) (2) (3) (4) (5) (6) Reading test scores, grades2,6, and8 (N= 448,946)
PartialR2 .1409 .1935 .0618 .0742 .2017 .1879
F-test for instruments 10.01 21.82 16.45 15.84 20.29 31.72
Class size −.0045∗ −.0055∗∗∗ −.0070∗ −.0043 −.0052∗∗∗ −.0052∗∗∗ (.0024) (.0020) (.0039) (.0031) (.0018) (.0019)
Math/physics test scores, grades3,6, and8 (N= 449,325)
PartialR2 .1438 .1955 .0640 .0725 .2031 .1910
F-test for instruments 10.14 19.00 13.89 12.47 17.74 26.75
Class size −.0072∗∗∗ −.0063∗∗∗ −.0060 −.0002 −.0059∗∗∗ −.0055∗∗∗ (.0027) (.0021) (.0040) (.0034) (.0019) (.0020)
Enrollment controls:
1st-order polynomials Yes Yes Yes
2nd-order polynomials Yes Yes Yes
Interaction w/ threshold (combined)
Yes Yes
Interaction w/ thresholds (separately)
Yes Yes
Class characteristics No No No No No No
Notes. The estimates are based on pupils enrolled in normal classes in the Danish public school system in the school years of2009/2010to2011/2012and tested through the national test system.
All test score measures are standardized. Class size controls are contemporaneous. In addition to the control variables listed in the table, all specications include xed eects for enrollment segment and the remaining controls from Table A.1. Standard errors adjusted for clustering by enrollment count are in parentheses. Asterisks indicate statistical signicance at the∗∗∗1%,∗∗5%, and∗10% level, respectively.
Table 4: Instrumental variables estimates of the effect of contem-poraneous class size, different enrollment controls
(3). Table 4 includes estimates of six enrollment specications. Columns (1)
and (2) restrict the enrollment polynomials to be the same across segments,
while columns(3) and(4) allow the polynomials to dier above and below all
thresholds combined. The remaining columns (5) and (6) are the fully
exi-ble specications. Intuitively, I favor these specications because they account for the dierence in the slopes of the predicted class size function across each threshold, separately.
Overall the results of Table 4 suggests quite stable eects, only the specica-tions with enrollment polynomials interacted with combined thresholds seems out of line. Also, the partial R2 drops considerably in these specications. The remaining IV estimates on math scores suggest a class size eect ranging between−0.006 and −0.007 of a standard deviation and between −0.005 and
−0.007of a standard deviation for reading scores. All eects are signicant on
the10percent level.
Following Staiger and Stock (1997), I can clearly reject that the instruments
do not enter the rst stage regression, however only marginally for the speci-cation of column(1). Moreover, the fraction of the variation in the endogenous
Model (1) (2) (3) (4) (5) (6) 2thgrade reading scores 3rdgrade math scores Class size −.0041 −.0094∗∗∗ −.0033∗∗∗ −.0032 −.0047 −.0014
(.0036) (.0029) (.0008) (.0037) (.0031) (.0009)
No. of observations 152,095 153,368
6thgrade reading scores 6thgrade math scores Class size −.0010 −.0046∗ −.0024∗∗∗ −.0054 −.0090∗∗∗ −.0090∗∗∗
(.0035) (.0026) (.0009) (.0039) (.0031) (.0027)
No. of observations 154,464 154,510
8thgrade reading scores 8thgrade physics scores
Class size .0062 .0028 0.0015 .0047 .0009 −.0011
(.0050) (.0041) (.0026) (.0042) (.0039) (.0036)
No. of observations 142,387 141,447
Baseline covariates No Yes Yes No Yes Yes
Class characteristics No No Yes No No Yes
Notes. The estimates are based on pupils enrolled in regular classes in the Danish public school system in the school years of2009/2010to2011/2012and tested via the national test system. All
test score measures are standardized. Class size controls are contemporaneous. In addition to the control variables listed in the table, all specications include xed eects for enrollment segments and linear and squared controls for grade enrollment into schools interacted with separate thresholds. Baseline covariates include the remaining controls from Table A.1. Standard errors adjusted for clustering by enrollment count are in parentheses. Asterisks indicate statistical signicance at the ∗∗∗1%,∗∗5%, and∗10%level, respectively.
Table 5: Estimates of class size effects in the second−eighth
grade.
R2, is reasonable in the preferred specications ranging from18%to20%. Thus,
it seems that the enrollment specications displayed in column(2),(5)and(6)
are all quite appropriate. I favor the fully exible specication in column(6)for
later analyses, which also seem to yield slightly more conservative estimates.21
6.2 Main Results
Table 5 presents IV estimates of the impact of class size on pupil academic achievement in grades2through8 using the fully exible enrollment
specica-tion from column (6) of Table 4. Compared to this, the 2SLS regressions in
column(3)and(6)include class controls, while specications in column(1)and (4)only include segment xed eects and linear and square enrollment controls
interacted with segments and thresholds.22
The point estimates of Table 5 are remarkably similar across columns. If the maximum class size rule in fact do produce experimental variation in class size, the 2SLS estimates of class size eects should be robust to the inclusion
21On the grade level, the specications in columns(2),(5), and(6) of Table 4 practically only dier by a signicant negative class size eect on3rdgrade math scores in specication
(2)and(5).
22F-statistics for instruments are omitted from the table. They vary in between24and35, thus, the presence of weak instruments are clearly rejected.
of control variables, they should only improve the precision of the estimates. Only the class size eects on physics scores in the8thgrade change signs while
remaining insignicant. The maximum class size rule is likely to have less bite in the8thgrade because an accumulating fraction of pupils have transferred to
private school while the mobility of pupils drops as graduation approaches. All standard errors are reduced as the level of controls increases conrming that the precision of estimates are enhanced. Also, controlling for the characteristics of classmates seems to slightly decrease the class size eect for reading.
Moreover, Table 5 reveals a noteworthy consistency in the main estimates across the various outcomes. Although modest, all coecients of column (2)
and (5) are negative apart from the 2SLS estimates on8th grade physics and
reading scores. Placement in a small class seem to improve test scores in pri-mary school. Compared to this, results of the OLS specication (Table A.4 of the Appendix) suggest an upward bias of the OLS estimates. This indicates a compensatory allocation of class size. I.e. children with poorer skills are typically placed in smaller classes and vice versa. The OLS estimates of class size on reading scores vary between signicant−.0012and signicant .0075of
a standard deviation (on2nd and8th grade reading scores, respectively). Only
the3rd grade point estimate is signicantly negative where the corresponding
2SLS estimate remains insignicant.
Column(2)and(5)of Table 5 indicate a more adverse eect of
contempora-neous class size on reading scores in the lower primary school of0.9percent of a
standard deviation compared to half of that in the upper primary. On the other hand, the class size eects on math scores appear larger in the upper primary school. The 2SLS estimates of class size eects on 3rd grade math scores are
insignicantly negative. The corresponding eects on6thgrade math scores are
twice as large and suggest that a one-pupil increase in class size would reduce math scores with0.9percent of a standard deviation. To examine the statistical
signicance of these dierentials, Table 6 presents results of the preferred spec-ication where class size is interacted with grade levels. The main eects thus pertain to pupils in the upper primary school (6th grade). Specically, grade
indicators are interacted with class size and instrument as well as enrollment control functions and segment in order to allow enrollment polynomials to dier across grade levels. Thus, adequately controlling for enrollment eects on the academic achievement of pupils.
In all specications the main eect is signicantly negative on at least the
10%signicance level. While the dierences between lower and upper primary
school are all statistically insignicant, in all specications except column(4)
re-sults suggest that8thgrade test performance is signicantly less adverse aected
by a class size increment, more or less osetting the negative main eect. While I nd signicant, albeit modest, evidence that reducing class size im-proves the academic achievements in subjects such as reading and math/physics of pupils in the Danish public school system, I cannot reject that these eects are constant across primary school. Furthermore, the estimates suggest that class size eects of8thgraders are negligible. Results are robust to both the
(1) (2) (3) (4) Independent variable 2SLS, reading scores 2SLS, math scores
Interaction −.0048 −.0019 .0038 .0045
(lower primary school) (.0038) (.0013) (.0045) (.0030) Main eect −.0044∗ −.0020∗∗ −.0086∗∗∗ −.0075∗∗∗
(.0026) (.0008) (.0032) (.0025)
Interaction .0078∗ .0040∗ .0099∗∗ .0064
(lower secondary school) (.0044) (.0021) (.0045) (.0040)
No. of observations 448,946 449,325
Class characteristics No Yes No Yes
Notes. The estimates are based on pupils enrolled in regular classes in the Danish public school system in the school years of2009/2010 to2011/2012and tested via the national test system.
All test score measures are standardized. Class size controls are contemporaneous. The lower primary school interaction term pertains to the2nd grade in column(1)-(2)and the 3rd grade
in column(3)-(4). The main eect pertains to the6th grade while the lower secondary school
interaction term denotes the8th grade. In addition to the control variables listed in the table, all
specications include xed eects for enrollment segments interacted with school level and linear and squared controls for grade enrollment into schools interacted with both separate thresholds and school level. Baseline covariates include the remaining controls from Table A.1. The instruments of column(1)−(4)are interacted with school levels as well. Standard errors adjusted for clustering by
enrollment count are in parentheses. Asterisks indicate statistical signicance at the∗∗∗1%,∗∗5%, and∗10%level, respectively.
Table 6: Estimates of class size effects in the second−eighth
grade, interaction specifications
schools.
6.2.1 Reducing the Bandwidth
What happens if the choice of bandwidth is narrowed and the model specication focuses explicitly on the variation around the cutos? As the instruments are valid only when the maximum class size rule triggers a change in class size, I would only expect cross sectional IV estimates to be unbiased in a small interval around the cutos.23 Table 7 presents 2SLS estimation results of the
±4 discontinuity the three lower segments (see footnote 14). Intuitively, when
the sample is adequately narrow around the cutos, segment xed eects should be sucient controls of enrollment.
The interpretation of the estimates in general and the discontinuity esti-mates in particular should be carefully conducted. Restricting the discontinuity sample to the three lower segments of enrollment obviously causes the corre-sponding estimates to be driven by the smaller schools. But even if higher enrollment segments were included in the analysis the weights of the 2SLS esti-mate on the weighted average causal eect is still larger for observations where the instrument aects the endogenous class size more (Angrist et al. 1996).
The evidence of Table 7 still suggests adverse eects of increasing class size.
23Furthermore, the likelihood of parents being able to undo the random assignment of treatment intensity are smaller just around the thresholds (Lee and Lemieux2010).
Model (1) (2) (4) (5)
2SLS regression ±4discontinuity sample
2thgrade reading scores 3rdgrade math scores
Class size −.0190∗∗ −.0060∗∗∗ .0038 .0040
(.0081) (.0019) (.0196) (.0058)
No. of observations 31,495 33,554
6thgrade reading scores 6thgrade math scores Class size −.0216∗∗∗ −.0090∗∗∗ −.0258∗∗∗ −.0167∗∗
(.0082) (.0031) (.0093) (.0082)
No. of observations 31,977 32,006
8thgrade reading scores 8thgrade physics scores
Class size .0065 .0050 −.0100 −.0126
(.0121) (.0058) (.0107) (.0109)
No. of observations 30,186 29,864
Class characteristics No Yes No Yes
Notes. The estimates are based on pupils enrolled in regular classes in the Danish public school system in the school years of2009/2010 to2011/2012, that have been tested via the national
test system, and, for the discontinuity samples, are enrolled in schools with a grade count of±4
around the three lower cutos: 28, 56, and84. Test scores are standardized. Class size controls
are contemporaneous. In addition to the control variables listed in the table, all specications include xed eects for enrollment segments and the remaining controls from Table A.1. Standard errors adjusted for clustering by enrollment count are in parentheses. Asterisks indicate statistical signicance at the∗∗∗1%,∗∗5%, and∗10%level, respectively.
.
Table 7: Estimates of class size effects in the second−eighth
grade, discontinuity sample
In particular, discontinuity estimates imply that the 'true' eect of class size on the group of compliers may be considerably larger compared to the 2SLS estimates of the full sample. Coecients of class size are as large as.02 of a
standard deviation on primary school reading scores, as well as.03of a standard
deviation on6th grade math scores. Once again the inclusion of class
charac-teristics considerably reduces the eect of a class size increment on primary level reading scores. Consequently, full-sample estimates are likely conservative estimates of the class size eect.
An interaction analysis analogous to the one from Table 6 reveals signicant
6th grade class size eects once again. However, due to imprecisely estimated
coecients, none of the class size eects in the lower primary and secondary school of the±4 discontinuity sample are signicantly dierent from this main
eect.
6.2.2 Robustness Tests
Is it probable that only contemporaneous class size inputs aect the test achieve-ments of pupils? In general the answer is no. On the other hand the class sizes of pupils are highly correlated with previous class size observations, thus in-cluding for example class size lagged one year is likely to cause problems with
(1) (2) (3) (4)
Independent variable 2SLS regression
2thgrade reading scores 3rdgrade math scores Class size (2-year avg.) −.0123∗∗∗ −.0041∗∗∗ −.0076∗∗ −.0022∗∗ (.0035) (.0010) (.0036) (.0009)
No. of observations 143,889 147,515
6thgrade reading scores 6thgrade math scores Class size (2-year avg.) −.0060∗ −.0028∗∗ −.0121∗∗∗ −.0117∗∗∗
(.0031) (.0011) (.0036) (.0030)
No. of observations 150,232 150,248
8thgrade reading scores 8thgrade physics scores Class size (2-year avg.) .0007 −.0015 −.0006 −.0033
(.0072) (.0037) (.0069) (.0062)
No. of observations 138,699 137,781
Class characteristics No Yes No Yes
Notes. The estimates are based on pupils enrolled in regular classes in the Danish public school system in the school years of2009/2010to2011/2012and tested via the national test system. All
test score measures are standardized. Class size controls are three-year averages. In addition to the control variables listed in the table, all specications include xed eects for twice lagged enrollment segments and linear and squared controls for twice lagged grade enrollment into schools interacted with separate thresholds as well as the remaining controls from Table A.1. Standard errors adjusted for clustering by twice lagged enrollment count are in parentheses. Asterisks indicate statistical signicance at the∗∗∗1%,∗∗5%, and∗10%level, respectively.
Table 8: Estimates of class size effects, three-year average class size measure
multicollinearity in the data24. Rather, an average class size measure, corre-sponding to the one of Fredriksson et al. (2013), is sensible to employ. Class
information are available from the school year of2007/2008, thus, providing me
with the opportunity of incorporating class sizes two years previous to the test observation for almost every pupil in the sample.
Results of Table 8 are obtained by using the average of the pupils' class sizes over the course of three years as the endogenous class size measure. For example, for pupils tested in literacy in the2ndgrade the average class size that the pupil
experienced during kindergarten,1st and2ndgrade is used. The interpretation
of the 2SLS estimates is then the eect of a one-pupil increase during these past three years. The instrument is based on enrollment two the school years prior to that of the test for the simple reason that enrollments in the test year are potentially endogenous to class sizes in the previous year etc. Hence, I cannot validly treat enrollment in the test year as exogenous (Fredriksson2013). Also,
the included enrollment controls are also based on two school years prior to the test observation.
Compared to Table 5 the inclusion of earlier class sizes does not alter the results on reading scores as well as6thgrade math scores, while class size eects
on3rd grade math scores becomes signicantly negatively aected by a change
24The correlation between the two class size measures are as high as.73for pupils in the 2ndgrade.