Optimizing Contact Center
Performance with Operational Reports
Document Version: 1.0
October 2015
Introduction
LiveEngage is designed to help you attain operational excellence. Agent managers can use LiveEngage data to optimize their contact center activities and meet performance goals. You can use this data to identify problems and take preventive and/or corrective actions.
This document includes:
Operational KPIs
Use Real-Time Data to Reach Your Daily Goals
Use Historical Data to Evaluate the Performance of your Contact CenterOperational KPIs
This table defines operational KPIs presented on the LiveEngage Agent Data Bar and in the Dashboard.
Operational KPI Definition
Average Time to Answer / Average Wait Time
The average time from the moment that a visitor enters the queue to the moment they connect with an agent.
Abandon Rate The percentage of visitors who leave the chat queue before an agent accepts their chat (out of all visitors who enter the queue).
Average Engagement Length / Average Handle Time
Average length of time from when visitors are connected to agents until the Engagement Window is closed.
Engaged Rate / Utilization
Percentage of time agents are engaged in chats out of the total time agents are logged in.
Concurrent Engagements
Average number of simultaneous engagements handled by agents.
Use Real-Time Data to Reach Your Daily Goals
By monitoring performance spikes and/or other issues in real time, you can identify and fix problems on the fly, and even eliminate potential problems.
Identify where you stand
On the Agent Manager data bar (at the top of the Visitor list), you will find data related to queue health. Closely monitor these dashboard metrics:
Investigate Further
If your queue health is not satisfactory (high abandon rate, high average time to answer, etc.), open the Agent Manager Dashboard to investigate further.
From the visitor list, click the arrow
The Agent Manager Dashboard is displayed.
1. Check if any skills are problematic:
a. Sort the Skill table (on the lower half of the screen) using the small arrows at the top of each column.
b. Sort by Abandon rate / Avg. time to answer to find any skill(s) that may have caused a problem, and/or any skills with a higher abandon rate or long time to answer.
c. Once you identify the problematic skill(s), filter the Dashboard by those skills.
d. Change the Time Frame to 24 hours, and then to 30 minutes to identify trends. For example, you might find that certain hours in your shift are too busy.
2. Check staffing issues:
a. Filter the Agent list by any of the skills that are problematic.
b. Check agent status. How many agents are currently onlineand how many are
away / back soon?
c. Calculate your available slot (the number of additional chats that can be
handled at the current time)using the dataon your Agent Manager Data Bar as follows:
available slot = chat capacity - current chats
For example, if your chat capacity is 85 and currently 76 chats are being handled, then your available slot is 9 chats.
d. Fix the problems you identify, using solutions suggested in the Queue Health Suggested Solutions table below.
3. Check chat length status by examining data in the History list: a. Filter the History list by the current date.
c. Sort the History list by Length in descending order.
d. Fix problems you detect, using suggested solutions from the Queue Health Suggested Solutions tablebelow.
4. Check chat volume trends:
a. In order to explore the chat volume, open the Agent Manager BI Dashboard. b. Focus on the Eng. volume widget (top left).
c. Compare the current Engagement volume to that of previous days (use the time filter).
d. Check if there are large gaps between Requested (chats) and Interactive (chats).
e. Fix problems you detect, using suggested solutions from the Queue Health Suggested Solutions tablebelow.
Queue Health Suggested Solutions
Identify the Problem
Possible Cause Solution(s) The skill has a
very small available slot.
There are not enough available agents with the relevant skill online
- Ask more agents or agent managers to log in and take chats.
- Ask agents to come back from their breaks / offline activities.
- Increase the maximum concurrency for experienced agents.
- Ask agents from your Voice Call Center to take chats.
Chats are too long.
Specific agents have long chats and may need coaching.
Read a sample of the especially long chat transcripts to figure out how to assist the agents that are
overextended. All of the agents’ chats are
longer than usual.
Go briefly over the transcripts to identify recurring problematic issues.
Compare the engagement volume of previous days.
If the volume of chat requests is higher than usual, it is possible that visitors want to chat as a result of a “hot issue”.
Using the History tab, go briefly over the shift transcripts to identify
recurring problematic issues.
Use Historical Data to Evaluate the Performance of your Contact
Center
With LiveEngage BI Dashboards, you can access historical data, learn from it and improve the performance of your contact center. You can analyze both visitor experience and agent efficiency, using the data presented on these BI Dashboard tabs:
Engagement Activity tab - The data on this tab reflects visitor experience by providing information about engagement volume, handling time, and wait time.
Agent Activity tab - The data on this tab reflects contact center efficiency byCompare your BI Dashboard Data to that of an Optimized Call Center
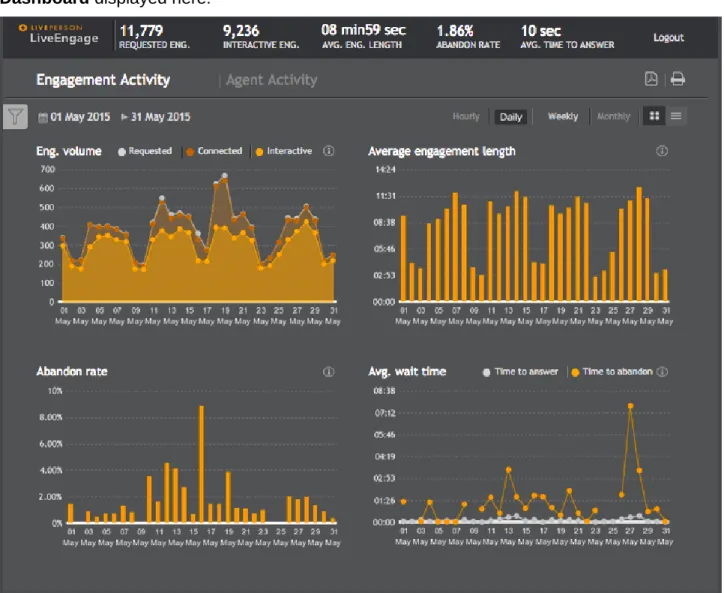
Evaluate your BI Dashboard data and compare it to the data of the optimized call center BI Dashboard displayed here:
Figure 1: Sample BI Dashboard - Engagement Activity tab
1. Check your Engagement Activity tab data:
a. Is there a large gap between requested chats and connected chats? A small gapis normal. This gap reflects a low, yet stable abandon rate. Most of the connected chats in the example are interactive, meaning that agents aren’t spending time on “ghost” chats (chats that no line was sent from the visitor side).
b. What is your average engagement length? It should be stable over time.
2. Check Agent Efficiency on the Agent Activity tab:
a. Does the agent online rate and engagement rate indicate that your agents are logged in and engaged as much as you expect them to be?
Take in consideration their entire tasks and decide how much time you expect from your agents to be online and engaged.
b. Do the Engagements per hour and Concurrent engagements meet your chat performance benchmark? Are Engagements per hour stable over time?
Tip: You can check the maximum concurrency of agents, and compare it to their actual
Sample Call Center that Requires Further Investigation
To get an idea of BI data that requires further investigation, let’s examine a sample call center’s BI Dashboard (shown below):
The abandon rate between 28-Dec and 4-Jan was extremely high.
December 31st looks like a problematic day.Next, we can drill down to this day specifically across all widgets, to examine the metrics more closely.
Visitor Experience - Engagement Activity Tab
Here’s what we find on the Engagement Activity tab when drilling down to December 31st:
The Requested chat volume increased, the Avg. wait time increased, and theAbandon rate soared.
Agent Efficiency - Agent Activity Tab
Here’s what we find on the Agent Efficiency tab when drilling down to December 31st:
The online rate indicates that most of the time, logged in agents were not available.
Those who were logged in have higher engagement rate at the problematic time, andhigher concurrent engagements.
The low engagement rate is also reflected in the small number of Concurrent engagements and Engagements per hour.Suggestions for Improving the Call Center’s Performance
The statistics above indicate that this call center must optimize their workforce. This can be achieved by one or more of the following: