European Journal of Physical Education and Sport Science
ISSN: 2501 - 1235 ISSN-L: 2501 - 1235 Available on-line at: www.oapub.org/eduCopyright © The Author(s). All Rights Reserved.
doi: 10.5281/zenodo.1295662 Volume 4 │ Issue 8 │ 2018
A COMPARISON STUDY IN BODYBUILDERS
BY AGE FOR SINGLE TWO LEG JUMP PARAMETERS
Kukeli, R., Skenderi, Dh.
Sports University of Tirana, Tirana, Albania
Abstract:
Introduction: The goal of this study was to investigate the difference between three age
groups of bodybuilders for jump parameters using single two leg jump test. Methods:
In this study, three groups of randomly selected subjects were included. 28 participants took part in the study (9 participants 18.5 years SD 2.1; 8 participants 22.7 years SD 2.4; 11 participants 29 years SD 2.9). The participants were regularly bodybuilder that took part in national championship in Albania. Single two leg jump test were used measuring jump parameters. Results: The data from the study for comparison between age groups for maximum rate of action do not show significant changes (sig = 0.2), the jump height / min has significant changes (sig = 0.04), the height of the jump did not show significant changes (sig = 0.1), the efficiency of the jump (the power applied to the applied force) does not show significant changes (sig = 0.7), the total of maximum force does not show significant changes (sig = 0.2), the maximum left foot force does not show significant changes (sig = 0.2), the force difference _p_t1_t3 (sig = 0.3), the total of maximum power does not show significant changes (sig = 0.6), the maximum left foot power does not show significant changes (sig = 0.8), the maximum right foot power does not show significant changes (sig = 0.4). Discussion: The study results show that the maximum right foot force has significant changes (sig = 0.04), the maximum force difference between left and right legs is significant (sig = 0.03), the maximum relative strength has significant changes (sig = 0.03).
Keywords: jump, strength, bodybuilder
1. Introduction
a previous cardiovascular session, though it does not impede performance, still appeared to change the fiber recruitment response for up to 32 hours. In particular, it appears that at least in trained individuals there is greater plasma concentrations of ammonia which is generally thought to increase in formation as a result of a greater reliance on fast twitch fibers, though it may also indicate greater protein degradation. Data from Widrick et al (1993) show that the second window bodybuilders should be weary of is after exercise. Following training protein synthesis rises within the first hour. In untrained individuals, it peaks at 16 hours but can be maintained for up to 72 hours. The goal of this study was to investigate the difference between three age groups of bodybuilders for jump parameters using single two leg jump test.
2. Methods
In this study, three groups of randomly selected subjects were included. 28 participants took part in the study (9 participants 18.5 years SD 2.1; 8 participants 22.7 years SD 2.4; 11 participants 29 years SD 2.9). The participants were regularly bodybuilder that took part in national championship in Albania. Single two leg jump test were used measuring jump parameters, Leonardo mechanography test (Single Two Leg Jump).
2.1 Statistical analysis
All variables evaluated in this study were tested for normality. The ANOVA (one way) test followed by the LSD (post hoc) test was used to compare the difference between the groups. Level p <0.05 (Significant Change) was accepted in this study. All statistical analyzes were performed using SPSS 20.0 software.
3. Results
Table 1: Descriptive statistics for test performed on single two leg jump for age -20 yrs
Age_Range Mean Std. Deviation
-20 yrs Single_two_leg_jump_EFI 100.8889 13.58717
Single_two_leg_jump_V_max 2.6111 .19310
Single_two_leg_jump_Height_min -.1767 .04690
Single_two_leg_jump_Jump_Height .4622 .06016
Single_two_leg_jump_Efficensy 80.5556 11.21507
Single_two_leg_jump_Force_max_total 2.4644 .40050
Single_two_leg_jump_Force_max_L 1.2367 .21915
Single_two_leg_jump_Force_max_R 1.2389 .19141
Single_two_leg_jump_diff_F_max 6.4444 5.87859
Single_two_leg_jump_Force_max_rel 3.0444 .40057
Single_two_leg_jump_Force_Diff_p_t1_t3 6.6000 4.15090 Single_two_leg_jump_Power_max_total 4.7200 .99662
Single_two_leg_jump_Power_max_L 2.3500 .53068
Single_two_leg_jump_Power_max_R 2.3811 .47593
Single_two_leg_jump_Power_diff_P_max 6.0000 4.74368 Single_two_leg_jump_Power_max_kg 56.7900 8.13498 Single_two_leg_jump_Power_h_max_h_min 280.4222 95.16862
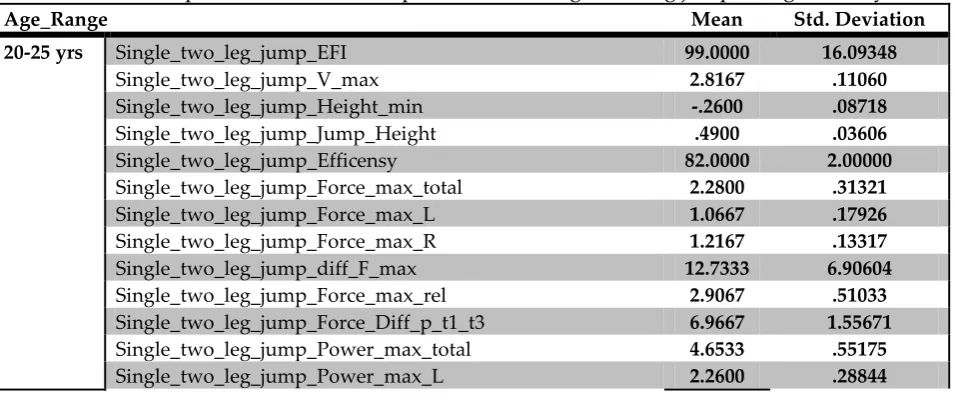
Table 2 gives data for the age group 20-25 years; performance indicator by weight, (mean = 99) (SD = 16.1), maximum action speed (mean = 2.8) (SD = 0.1), jump height / min (average = 0.3) (SD = 0.09), jump height (mean = 0.5) (SD = 0.04), the efficiency of the jump (the power applied to the applied force) (mean = 82) (SD = 2), total maximum force (mean = 2.3) (SD = 0.3), maximum left foot force (mean = 1.1) (SD = 0.2), maximum right foot force (mean = 1.2) (SD = 0.1), the maximum force difference between left and right legs (mean = 12.7) (SD = 6.9), maximum relative strength (mean = 2.9) (SD = 0.5), the force difference _p_t1_t3 (mean = 6.9) (SD = 1.6), maximum total power (mean = 4.7) (SD = 0.5), maximum left foot power. (mean = 2.3) (SD = 0.3), maximum right foot power (mean = 2.4) (SD = 0.3), the power difference between left and right legs (mean = 8.5) (SD = 5.1), maximum power per kg (mean = 58.3) (SD = 8.9), the ratio between maximum jump and spin (average = 203.1) (SD = 70.6).
Table 2: Descriptive statistics for test performed on single two leg jump for age 20- 25 yrs
Age_Range Mean Std. Deviation
20-25 yrs Single_two_leg_jump_EFI 99.0000 16.09348
Single_two_leg_jump_V_max 2.8167 .11060
Single_two_leg_jump_Height_min -.2600 .08718
Single_two_leg_jump_Jump_Height .4900 .03606
Single_two_leg_jump_Efficensy 82.0000 2.00000
Single_two_leg_jump_Force_max_total 2.2800 .31321
Single_two_leg_jump_Force_max_L 1.0667 .17926
Single_two_leg_jump_Force_max_R 1.2167 .13317
Single_two_leg_jump_diff_F_max 12.7333 6.90604
Single_two_leg_jump_Force_max_rel 2.9067 .51033
Single_two_leg_jump_Force_Diff_p_t1_t3 6.9667 1.55671
Single_two_leg_jump_Power_max_total 4.6533 .55175
Single_two_leg_jump_Power_max_R 2.4133 .29501
Single_two_leg_jump_Power_diff_P_max 8.5333 5.10816
Single_two_leg_jump_Power_max_kg 58.2967 8.96663
Single_two_leg_jump_Power_h_max_h_min 203.1333 70.60611
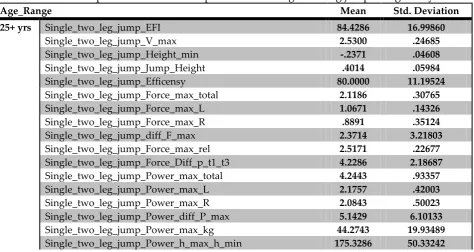
Table 3 gives data for the age category +25 years; performance indicator by weight, (average 84 = 4) (SD = 17), maximum action speed (mean = 2.5) (SD = 0.2), jump height / min (average = 0.2) (SD = 0.04), jump height (mean = 0.4) (SD = 0.05), the efficiency of the jump (the power gained for the applied force) (average = 80) (SD = 11.2), total maximum force (average = 2.1) (SD = 0.3), maximum left foot force (mean = 1.1) (SD = 0.1), maximum right foot force (mean = 0.9) (SD = 0.4), the maximum force difference between left and right legs (mean = 2.4) (SD = 3.2), maximum relative strength (mean = 2.5) (SD = 0.2), the force difference _p_t1_t3 (mean = 4.2) (SD = 2.9), maximum total power (mean = 4.2) (SD = 0.9), maximum left foot power. (mean = 2.2) (SD = 0.4), maximum right foot power (mean = 2) (SD = 0.5), the power difference between left and right legs (mean = 5.1) (SD = 6.1), maximum power per kg (mean = 44.2) (SD = 19.9), the ratio between maximum jump and spin (mean = 175.3) (SD = 50.3).
Table 3: Descriptive statistics for test performed on single two leg jump for age 25+ yrs
Age_Range Mean Std. Deviation
25+ yrs Single_two_leg_jump_EFI 84.4286 16.99860
Single_two_leg_jump_V_max 2.5300 .24685
Single_two_leg_jump_Height_min -.2371 .04608
Single_two_leg_jump_Jump_Height .4014 .05984
Single_two_leg_jump_Efficensy 80.0000 11.19524
Single_two_leg_jump_Force_max_total 2.1186 .30765
Single_two_leg_jump_Force_max_L 1.0671 .14326
Single_two_leg_jump_Force_max_R .8891 .35124
Single_two_leg_jump_diff_F_max 2.3714 3.21803
Single_two_leg_jump_Force_max_rel 2.5171 .22677
Single_two_leg_jump_Force_Diff_p_t1_t3 4.2286 2.18687
Single_two_leg_jump_Power_max_total 4.2443 .93357
Single_two_leg_jump_Power_max_L 2.1757 .42003
Single_two_leg_jump_Power_max_R 2.0843 .50023
Single_two_leg_jump_Power_diff_P_max 5.1429 6.10133
Single_two_leg_jump_Power_max_kg 44.2743 19.93489
Single_two_leg_jump_Power_h_max_h_min 175.3286 50.33242
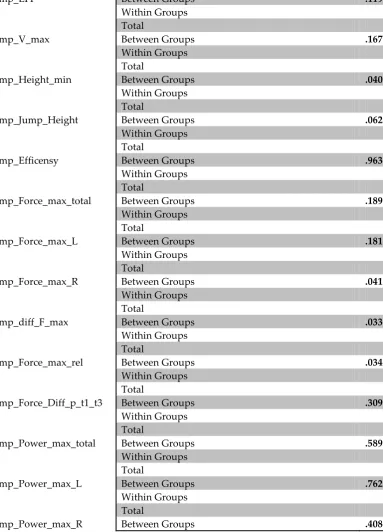
Table 4: Comparison data by age category
ANOVA Sig.
Single_two_leg_jump_EFI Between Groups .119
Within Groups Total
Single_two_leg_jump_V_max Between Groups .167
Within Groups Total
Single_two_leg_jump_Height_min Between Groups .040
Within Groups Total
Single_two_leg_jump_Jump_Height Between Groups .062
Within Groups Total
Single_two_leg_jump_Efficensy Between Groups .963
Within Groups Total
Single_two_leg_jump_Force_max_total Between Groups .189
Within Groups Total
Single_two_leg_jump_Force_max_L Between Groups .181
Within Groups Total
Single_two_leg_jump_Force_max_R Between Groups .041
Within Groups Total
Single_two_leg_jump_diff_F_max Between Groups .033
Within Groups Total
Single_two_leg_jump_Force_max_rel Between Groups .034
Within Groups Total
Single_two_leg_jump_Force_Diff_p_t1_t3 Between Groups .309
Within Groups Total
Single_two_leg_jump_Power_max_total Between Groups .589
Within Groups Total
Single_two_leg_jump_Power_max_L Between Groups .762
Within Groups Total
Single_two_leg_jump_Power_max_R Between Groups .408
4. Discussion
In conclusion of this study results show that the maximum right foot force has significant changes (sig = 0.04), the maximum force difference between left and right legs is significant (sig = 0.03), the maximum relative strength has significant changes (sig = 0.03).
References
1. Astrand P. O., Rodahl K. Textbook of work physiology. New York: McGraw-Hill Book Company, 1986
2. Lambert C. P., Frank L. L., Evans WJ. Macronutrient considerations for the sport of bodybuilding. Sports Med. 2004;34(5):317–327. PubMed doi:10.2165/00007256- 200434050-00004
3. Heyward V. H., Sandoval W. M., Colville B. C. Anthropometric, body composition and nutritional profiles of bodybuilders during training. J Appl Sport Sci Res. 1989;3(2):22–29.
4. Walberg-Rankin J., Edmonds C. E., Gwazdauskas F. C. Diet and weight changes of female bodybuilders before and after competition. Int J Sport Nutr. 1993;3(1):87–102. PubMed Natural Bodybuilding Case Study 591
5. Brill J. B., Keane M. W. Supplementation patterns of competitive male and female bodybuilders. Int J Sport Nutr. 1994;4(4):398–412. PubMed
6. Steen S. N. Precontest strategies of a male bodybuilder. Int J Sport Nutr. 1991;1(1):69–78. PubMed
7. Faude O., Meyer T., Urhausen A., et al. Recovery training in cyclists: ergometric, hormonal and psychometric findings. Scand J Med Sci Sports. 2009;19(3):433–441. PubMed doi:10.1111/j.1600-0838.2008.00795.x
8. Leveritt M., Abernethy P. Acute effects of high-intensity endurance exercise on subsequent resistance activity. . 1999;13:47-51.
9. Maestu J., Eliakim A., Jurimae J., et al. Anabolic and catabolic hormones and energy balance of the male bodybuilders during the preparation for the competition. J Strength Cond Res. 2010;24(4):1074–1081. PubMed doi:10.1519/ JSC.0b013e3181cb6fd3
10.Maestu J., Jurimae J., Valter I., et al. Increases in ghrelin and decreases in leptin without altering adiponectin during extreme weight loss in male competitive bodybuilders. Metabolism. 2008;57(2):221–225. PubMed doi:10.1016/j. metabol.2007.09.004
11.Maughan R. J. Marathon running. In: Reilly T., Snell P., Williams C., et al., editors. Physiology of sports. London: Spon, 1969: 121-52
13.Thorsteinsdottir B., Grande J. P., Garovic V. D.. Acute renal failure in a young weight lifter taking multiple food supplements, including creatine monohydrate. J Ren Nutr. 2006;16(4):341–345. PubMed doi:10.1053/j. jrn.2006.04.025
14.Koopman M., Richter C., Parren R. J., et al. Bodybuilding, sesame oil and vasculitis. Rheumatology (Oxford). 2005;44(9):1135. PubMed doi:10.1093/rheumatology/ keh712
15.Voelcker V., Sticherling M., Bauerschmitz J. Severe ulcerated ‘bodybuilding acne’ caused by anabolic steroid use and exacerbated by isotretinoin. Int Wound J. 2010;7(3):199–201. PubMed doi:10.1111/j.1742- 481X.2010.00676.x
16.Schafer C. N., Guldager H, Jorgensen HL. Multi-organ dysfunction in bodybuilding possibly caused by prolonged hypercalcemia due to multi-substance abuse: case report and review of literature. Int J Sports Med. 2011;32(1):60– 65. PubMed doi:10.1055/s-0030-1267200
17.Mayr F. B., Domanovits H, Laggner AN. Hypokalemic paralysis in a professional bodybuilder. Am J Emerg Med. 2012;30(7):1324.e5–1324.e 8. PubMed doi:10.1016/j. ajem.2011.06.029
18.Banke I. J., Prodinger P. M., Waldt S., et al. Irreversible muscle damage in bodybuilding due to long-term intramuscular oil injection. Int J Sports Med. 2012;33(10):829–834. PubMed doi:10.1055/s-0032-1311582
19.Miura A., Sato H., Whipp B. J., et al. The effect of glycogen depletion on the curvature constant parameter of the power-duration curve for cycle ergometry. Ergonomics. 2000;43(1):133–141. PubMed doi:10.1080/001401300184693
20.Marttinen R. H., Judelson D. A., Wiersma L. D., et al. Effects of self-selected mass loss on performance and mood in collegiate wrestlers. J Strength Cond Res. 2011;25(4):1010– 1015. PubMed
21.Sporer B. C., Wenger H. A. Effects of aerobic exercise on strength performance following various periods of recovery. J Strength Cond Res. Nov 2003;17(4):638-644.
Creative Commons licensing terms