1.BRIDGE INTRODUCTION
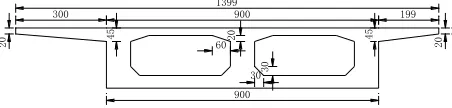
This bridge adopts the continuous box girder structure, with span arrangement (26+38+36) + (36+38+26) =200m. The division-framing design is used, 2cm-wide break-joint in the middle, and each segment is constructed with single-box double-cell. Besides, other related parameters include: top surface width of box girder 13.99m, bottom surface width 9m, exterior cantilever 3m, interior cantilever 1.99m, mid-span web thickness 0.45m, support web thickness 0.8m, top slab thickness 0.25m and base slab thickness 0.22m. Refer to Fig. 1 for cross section diagram. Except that in the first and sixth spans, the high beam is 1.4m and mid-beam is 2m, the other are all 2m high. This bridge is located in the urban secondary trunk road at the designed driving speed 40km/s, with the bridge design safety Class I and A-level urban load standard.
900 1399
20
300 900 199
45
20
45
60 20
30
30
Figure 1. Cross section diagram (mm)
2. TEST CONTENT
The bridge load carrying capacity could be evaluated by applying the static imposed load similar to design load into
the bridge structure, testing the mechanical effects such as deflection, strain, possible cracks, load transverse distribution under the different loads of control positions and sections, and then making comparison with the calculated values and related specified values under the same loads[1-3]; based on the bridge engineering characteristics, the first and second section have the same bridge type structure, and the left and right segment have the symmetrical structure with the same design load and capacity, but the right segment is slightly unfavourably loaded, therefore, the right segment of the first section was selected for static load test, and the results are still equivalent to that of the left segment of the first section and the left and right segments of the second section. In the static test, three principles should be followed: (1) test position highlights the key stress for structural system; (2) test content reflects the structural bearing capacity index; (3) the actual test should be controlled from damaging the structure.
2.1 Loading scheme
Midas civil 2015 finite element program was applied to calculate and analyse the bridge design load and test conditions. In the calculation, take the max sagging moment at mid-span and max hogging moment at support as thecontrol load, and design the test loading scheme according to design load standard values. For this bridge with pre-stressed concrete continuous box beam structure,based on thestructure loading features and theoretical analysis results, select the max cross section for bending moment and every support cross section of the right segment in section 1 as the test object, make test loading at the most unfavourable
ENVIRONMENTAL AND EARTH
SCIENCES
RESEARCH JOURNAL
ISSN: 2369-5668 (Print), 2369-5676 (Online) Vol. 4, No. 4, December 2017, pp. 87-92 DOI: 10.18280/eesrj.040401
Licensed under CC BY-NC 4.0
A publication of IIETA
http://www.iieta.org/Journals/EESRJ
A
s
tatic
l
oad
t
est
s
tudy for
o
ne
c
ontinuous
b
eam bridge
Wei Liu, Yanjie Xue*
Jilin University of College of Construction Engineering, Changchun 130010, China
Email: [email protected]
ABSTRACT
In the bridge construction process, the external environment changes and parameter errors might lead to the deviation of finished bridge state from the theoretical value, therefore a static load test should be conducted at the completion of construction. Static load test of bridge is one key part of new bridge completion acceptance and old bridge detection, and the related test results are the important basis to judge whether the bridge load carrying capacity and stiffness satisfy the specified requirements. With the continuous beam bridge (CBB) as one of the widely-used bridge structural forms, it is of great significance to study the static load test of CBB. This paper, by analysing the practical test of one CBB in Baiyun city, mainly elaborates on the content, principle and result analysis of structural static load test, and emphasizes on the study of the loading scheme design and working conditions plan in static load test of this bridge, which could provide experiences and references for the same type of bridge static tests.
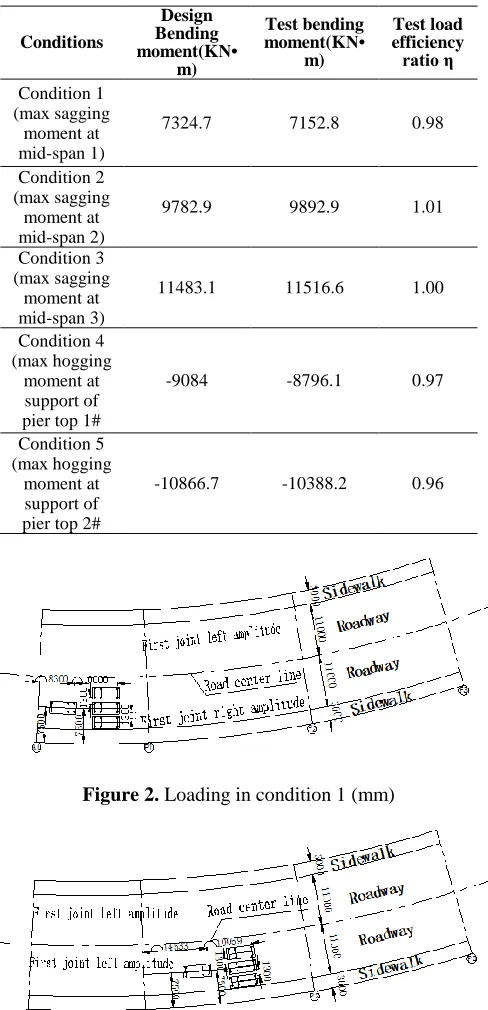
loading of influence line, and arrange five loading conditions [4]; refer to Fig 2-6 for loading conditions, and Table 1 for the control cross section bending moment and test load efficiency ratio in five difference conditions:
Table 1. Bending moment and test load-efficiency ratio
Conditions
Design Bending moment(KN•
m)
Test bending moment(KN•
m)
Test load efficiency ratio η
Condition 1 (max sagging
moment at mid-span 1)
7324.7 7152.8 0.98
Condition 2 (max sagging
moment at mid-span 2)
9782.9 9892.9 1.01
Condition 3 (max sagging
moment at mid-span 3)
11483.1 11516.6 1.00
Condition 4 (max hogging
moment at support of pier top 1#
-9084 -8796.1 0.97
Condition 5 (max hogging
moment at support of pier top 2#
-10866.7 -10388.2 0.96
Figure 2. Loading in condition 1 (mm)
Figure 3. Loading in condition 2 (mm)
According to Load Test Methods for Highway Bridge (JTG/T J21-01-2015), static test load efficiency ηq is the ratio of the computation effect of one certain control cross-section under the test load and the designed control effect corresponding to this cross-section. To ensure full reflection of the structure loading feature in the load test, generally the higher load test efficiency ratio is required; for the load test in acceptance, the load efficiency ratio ηq should be in the range 0.85-1.05 [5]. The finally-selected ηq value in this test satisfied the requirements above, so the mechanical effect
produced by the test load should also be capable of meeting the requirements for bridge usage conditions inspection.
Figure 4. Loading in condition 3 (mm)
Figure 5. Loading in condition 4 (mm)
Figure 6. Loading in condition 5 (mm) 2.2 Loading vehicle
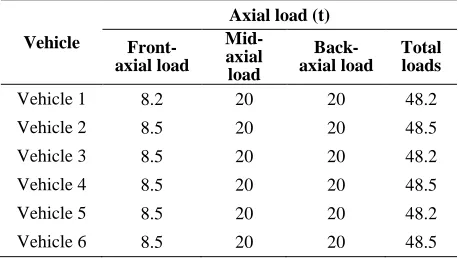
In the load test, 6 tri-axial heavy-duty vehicles were adopted for loading: 4 vehicles for working condition 1, 2 and 3; 6 for working condition 4 and 5. Refer to Fig. 7 for vehicle loading, and Table 2-3 for vehicle parameters.
Table 2. Wheel parameters of loading vehicle
Vehicle A (m) B (m) D (m)
Vehicle 1 1.4 3.8 1.8
Vehicle 2 1.4 3.8 1.8
Vehicle 3 1.4 3.8 1.8
Vehicle 4 1.4 3.8 1.8
Vehicle 5 1.4 3.8 1.8
Vehicle 6 1.4 3.8 1.8
Table 3. Loading vehicle parameters
Vehicle
Axial load (t)
Front-axial load
Mid-axial load
Back-axial load
Total loads
Vehicle 1 8.2 20 20 48.2
Vehicle 2 8.5 20 20 48.5
Vehicle 3 8.5 20 20 48.2
Vehicle 4 8.5 20 20 48.5
Vehicle 5 8.5 20 20 48.2
Vehicle 6 8.5 20 20 48.5
3. TEST ONSITE ORGANIZATION
The following steps should be followed in every specific working condition [6,7]:
(1) According to the instruction of test centre, every test group takes the initial readings of bridge before loading;
(2) After taking initial readings, every test group reports back to test centre. With all initial data reading completed, the test centre gives an instruction to start loading (batch-by-batch, and slow loading);
(3) In the loading process, every test group should make real-time data monitoring; if abnormal data occurs, report to the test centre in time, and stop loading;
(4) When loading is ready, the dispatcher reports back to test centre; the test centre starts timing, until reaching stable state; then it gives an instruction of test, so every test group shall start to take readings simultaneously;
(5) After completing the test, every test group reports to the test centre; with all test data collected, the test centre gives unloading instruction to make unloading (batch-by-batch, and slow loading);
(6) Some key test data is collected; only if the data is judged errorless by test centre, the loading in the next working condition can start.
In addition, if the structural effect is over the allowable value or anything abnormal in the test process, the loading should be terminated.
4. TEST RESULTS ANALYSIS 4.1 Test data collection
In different working conditions, based on the test purpose
and evaluation demands for usage function, the mid-span section deflection, strain and strain at the support section were mainly tested, and also the beam cracks were observed [8-11].
(1) Collect the deflection data with one 0-50mm dial indicator. To make deflection test, 3 dial indicators were placed at every rib slab of midspan beam respectively. Refer to Fig 8 for the dial indicator layout.
Figure 8. Layout of dial indicators (mm)
(2) Vibrating wire transducer is used to make strain test and data collection. Five transducers were placed on the cross sections of midspan support, where 3 were placed atbeam bottom, 2 under the slab with haunched ribs. Refer to Fig. 9 for the layout of vibrating wire transducers.
Figure 9. Layout of vibrating wire transducers (mm) 4.2 Calculation of static test results
Under the test load, make tests of the deflection and strain at different measuring points, and then calculate the test data in the methods as follows [13-15]:
1) Calculate the actual deflection of mid-span section by deducting the influence of support settlement. Considering the support settlement influence on test section deflection, the measured section deflection should be corrected when calculating the test data. The corrected value is calculated as:
l x x
C a b
l l
where, C-is correction influenced by support settlement; l-is the distance between two supports; x the distance between deflection measuring point and starting support; a-is the settlement of starting support; b-is the settlement of end support.
2) Deflection and strain calculation at each measuring point: Total strain:St SL Si
Elastic strain:Se SL Su
Residue strain:Sp St Se SuSi
where, Si is the initial value of every point before loading (initial loading); SLis the measured value when the loading in stable state (loading value); Su is the measured value when unloading in stable state (unloading value).
S e q
S S
where, Seis the measured elastic deflection (or strain) value under test load; Ss is the theoretical deflection (or strain) value under the test load.
4) Relative residual deformation is an index to evaluate the elastic working performance of the structural member under loads; the less relative residual deformation of mid-span deflection means the structure elastic operating condition is better. The relative residual deformation
S
p
is calculated as:
p t
100%
p
S
S
S
where Spis theresidual deformation of midspan deflection; St
the total deformation of midspan deflection.
According to the specified computation requirements above, the relative residual deformation of the structure should be lower than 20%, and the verification coefficient be below 1, which means that the structure meets the requirement; the less the verification coefficient, the better the structure safety capacity shall be [18-20].
4.3 Deflection test analysis in five conditions
The most unfavourable loading test was made in these five working conditions. Data collection was made at every measuring point when loading step by step in every condition. Refer to Table 4-5 for the deflection test results.
Table 4. Deflection test results in working condition 1, 2, 3, 4 and 5
condition Measurin
g point
Initial reading
(mm)
50% loading reading
(mm)
100% Loading reading (mm)
Unload reading (mm)
Total deformation
(mm)
Condition 1 Mid-span
1 0 1.19 2.40 0.08 2.40
Condition 2 Mid-span
2 16.35 18.69 20.86 16.84 4.51
Condition 3 Mid-span
3 38.20 39.33 42.09 38.25 3.89
Condition 4
Mid-span
1 0 0.59 1.17 1.69 0.20 Mid-span
2 15.19 16.08 17.04 17.94 15.33
Condition 5
Mid-span
2 18.55 19.01 19.73 20.91 18.88 Mid-span
3 48.01 48.98 49.95 51.52 48.25
Table 5. Deflection test results in working condition 1, 2, 3, 4 and 5
condition Measuring
point
Elastic deformation
(mm)
Residual deformation
(mm)
Relative residual deformation (%)
Theoretical deflection
(mm)
Verification coefficient
q
Condition1 Mid-span 1 2.32 0.08 3.4 3.97 0.58 Condition
2 Mid-span 2 4.02 0.49 12.2 6.87 0.58 Condition
3 Mid-span 3 3.84 0.05 1.3 7.60 0.51 Condition
4
Mid-span 1 1.69 1.49 0.20 13.4 1.81 Mid-span 2 2.75 2.61 0.14 5.4 3.09
Condition 5
Mid-span 2 2.36 2.03 0.33 14.0 2.84 Mid-span 3 3.51 3.27 0.24 7.3 5.73
4.4 Deflection and strain analysis of midspan and support section
The most unfavourable loading test was made in these five working conditions. Data collection was made at
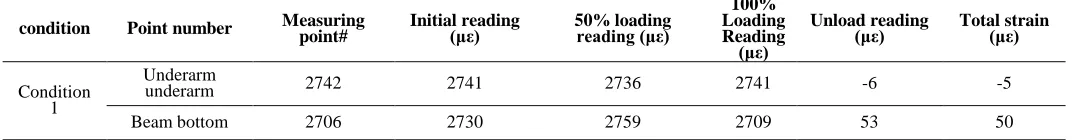
everymeasuring point when loading step by step in every working condition. Refer to Table 6-7 for the strain test results.
Table 6. Strain test results in working condition 1, 2, 3, 4 and 5
condition Point number Measuring point# Initial reading (με) 50% loading reading (με)
100% Loading Reading (με)
Unload reading
(με) Total strain (με)
Condition 1
Underarm
underarm 2742 2741 2736 2741 -6 -5
Condition 2
Underarm
underarm 3306 3300 3299 3305 -7 -6
Beam bottom 3367 3393 3428 3372 61 56
Condition 3
Underarm
underarm 3412 3403 3406 3411 -6 -5
Beam bottom 3121 3150 3173 3126 52 47
Condition 4
Underarm
underarm 3181 3185 3189 3191 3182 10
Beam bottom 3341 3336 3331 3321 3338 -20
Condition 5
Underarm
underarm 3022 3024 3026 3029 3022 7
Beam bottom 3344 3337 3329 3319 3342 -25
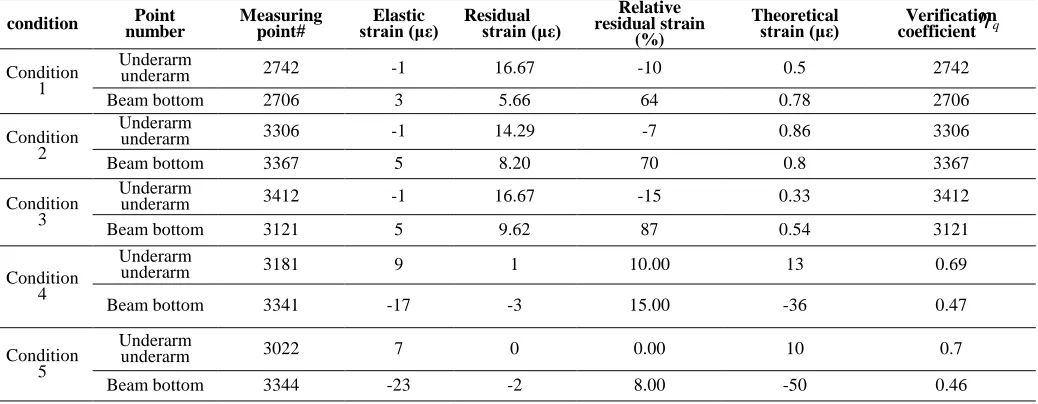
Table 7. Strain test results in working condition 1, 2, 3, 4 and 5
condition number Point Measuring point# strain (με) Elastic Residual strain (με) residual strain Relative
(%)
Theoretical
strain (με) coefficientVerification
qCondition 1
Underarm
underarm 2742 -1 16.67 -10 0.5 2742 Beam bottom 2706 3 5.66 64 0.78 2706
Condition 2
Underarm
underarm 3306 -1 14.29 -7 0.86 3306 Beam bottom 3367 5 8.20 70 0.8 3367
Condition 3
Underarm
underarm 3412 -1 16.67 -15 0.33 3412 Beam bottom 3121 5 9.62 87 0.54 3121
Condition 4
Underarm
underarm 3181 9 1 10.00 13 0.69
Beam bottom 3341 -17 -3 15.00 -36 0.47
Condition 5
Underarm
underarm 3022 7 0 0.00 10 0.7
Beam bottom 3344 -23 -2 8.00 -50 0.46
5. CONCLUSION
(1) The load test mainly includes the control index such as strain and deflection etc, which reflects the safety capacity of bridge structure in the most unfavourable conditions [21]. The carrying capacity index is the physical mechanics index of structural carrying capacity influenced by different factors. In the five working conditions, the calculation for measured deflection values has been made to obtain the verification coefficient between 0.57-0.84, relative residual deformation 1.3%-14%; with the verification coefficient below 1 and relation residual deformation lower than 20%, itmeans the structural stiffness meets the design requirements. In the calculation of actual measured strain values, the verification coefficient 0.33-0.86 is below 1 and relative residual strain 0-16.67% below 20% [22], which indicates the structural carrying capacity also meets the design requirements.
(2) The bridge load test aims to understand the actual load carrying capacity, ensuring safe passage, therefore, the load test cannot damage the bridge in any way, and the loading tonnage should be designed properly to avoid damaging the bridge. In the loading process, no cracks found in the main beam indicates the good structural stiffness.
6. REFERENCES
[1] Chen H., Li Z.P. (2008). Study on Load Test of Inclined Beam Bridge. Heilongjiang Transportation Technology Press, Vol. 31, No. 6, pp. 50-51.
[2] Zhou L., Guan G.D., Xie Y.P. (2007). study on static load test of skew bridge, Journal of Highway and Transportation, No. 4, pp. 154-156.
[3] Wang D.N., Wang L., Li M., Sun Y.L. (2014). Study on the static and dynamic load test of Nicky Bridge,
Applied Mechanics and Materials, Vol. 2974, No. 501,
pp. 501-504, 1194-1198
[4] Peng J.J., Zhang H., Li X.J. (2014). Study on the loading scheme of bridge static load test, Chinese and foreign highways, Vol. 34, No. 06, pp. 188-190.
[5] Wang L.B., Jiang P.W., Ma Y.P., Zhao Y. (2015). Research on the calibration coefficient and optimization evaluation method of static load test, Highway traffic science and technology, Vol. 32, No. 06, pp. 62-68. [6] Wu J.J., Chen and Zhang Q.W., Yuan W.C. (2004).
Field static load test of bridge evaluation and analysis,
Highway, No. 12), pp. 62-65.
[7] Huang J., Zhang Z. (2009). The static load test and analysis of the bridge, traffic in the North, No. 08, pp. 69-71.
[9] Liu Z.G., Zhang Y.H. (2007). Dynamic and static load analysis of bridge reinforcement effect, Western Communications Technology, No. 03, pp. 56-60. [10] Wang B., Chen Zh.Zh. (2006). Tsai minimum static load
test and analogue analysis of reinforced concrete arch bridge, Engineering and Construction, No. 03, pp. 181-182.
[11] Han H.B., Wang L., Li Z.X., Long H. (2014). Study on the static and dynamic load test of Skew Bridge,
Advanced Materials Research, Vol. 2920, No. 859, pp. 127-130.
[12] Chen N., Cai Sh.H., Li N., Liu Sh.K. (2015). Research on static load tests of damaged bridge strengthened with pre-stressed HFRP, Advanced Materials Research, Vol. 3716, No. 1079,pp.258-265.
[13] Fan L.X., Hong H. (2014). Study on the static load test of bridge inspection, Advanced Materials Research, Vol. 2920, No. 859, pp. 149-152.
[14] Zhang H., Wang S., Zhou T., An Q.P., Bao K.H. (2014). Study on bridge static test based on close-range photogrammetry, Advanced Materials Research, Vol. 2837, No. 838, pp. 838-841+1054-1057.
[15] Fang T., Guang M.X. (2014). Study on the static load
test of bridge inspection, Advanced Materials Research, Vol. 3255, No. 971, pp. 149-152.
[16] Wang W., Wang L. (2014). Study on static and dynamic load test of Huaronggou Bridge, Applied Mechanics and Materials, Vol. 3308, No. 587, pp.587-589+1500-1506. [17] De C.F., Yu H.W., Wang L. (2014). Static and dynamic testing study on mechanical behavior of Longtan Bridge,
Applied Mechanics and Materials, Vol. 3615, No. 684, pp. 100-104.
[18] Huang J., Zhang Z. (2009). Static load test and analysis of bridge, North Traffic, No. 08, pp. 69-71.
[19] Yu Z.F. (2013). Analysis of an example of a bridge static load test, Anhui Architecture, No. 05, pp. 127-129. [20] Zhang W.H., Liu X.F., Hu T.B., Chen B. (2012). The bridge static load test case analysis, Journal of Wuhan Polytechnic University, Vol. 31, No. 01, pp. 80-82+92. [21] Wang W.,Wang L. (2014). Study on static and dynamic
load test of Huaronggou Bridge, Applied Mechanics &
Materials, pp. 587-589+1500-1506.
[22] Yu S., Zhang T., Zhao Q. (2013). Study on the static and dynamic load test of continuous girder bridge,