FACTORS AFFECTING DEMAND BASED FORECASTING
ON INVENTORY MANAGEMENT IN KERIO VALLEY
DEVELOPMENT AUTHORITY AT ELDORET, KENYA
Jepchirchir Kibet Lorna
Department of Business Management, University of Eldoret, P.O. Box 1125-30100, Eldoret,
Kenya.
Email: lonna.kibet @gmail.com
ABSTRACT
Inventory management is a precursor for cost minimization and a prerequisite for break even analysis. Demand based forecasting is influences by a number of factors. The main objective of this study was to find out the factors that affect demand based forecasting on inventory management. The study employed an explanatory research design. The target population was 70 respondents. The sampling techniques used were stratified random sampling, purposive sampling and simple random sampling. The data collection instruments were questionnaires and interview schedules. Validity of the research instrument was tested using expert opinion and piloting approach while cronbach alpha for reliability. The data was analyzed using descriptive statistics. SPSS version 24.0 aided in Analysis. The factors that affect demand based forecasting were; shortening of product life cycles, wrong information in the market place, shrinkage of the business and lack of capacity to use customer information to predict the future demand. The study concluded that Retailers want to grow sales, realize profits and satisfy customers. There is a realistic assessment of the likely accuracy of forecasts level in the organization and consideration of other strategies that can be used in conjunction with forecasting to best solve the challenges affecting demand based forecasting and inventory management. The study recommends that organizations’ should screen any information they come across before choosing which demand based forecasting method to use. Organizations should ensure at all times they have the right personnel competent enough to use customer information to predict future demand.
Key Words
: Forecast, Inventory Management, Delphi, Kenya1.
INTRODUCTION
Demand forecasting is the activity of estimating the quantity of a product or service that consumers will purchase (Armstrong, Morwitz, & Kumar, 2000). It is used to predict the future demand of company's product and services, with the aim to be able to fulfill the customer desires over a specified time period which is done by using the historical data, usually based on demand data (Heizer et al., 2017). Having a good forecast is crucial for having an efficient service and for manufacturing operations Accurate forecasts are important for businesses and other organizations in making plans to meet demand for their goods and services. Demand forecasting is a very important factor for a business to do in the proper way.
forecasted. If the competitors increases the price then the demand for an item will likely rise. Regardless of the stimuli, these forces need to be factored into planning and managed within the demand forecast (Meade & Islam, 2001).
Qualitative, time-series, causal, and simulation are the various types of demand based forecasting. A forecast based on the instinct, emotions, background, and value system is known as qualitative forecast. Time-series forecast is a method that relies on historical data and assumes that the historical data is the good indicator to forecast the future. Causal forecast is a method that assumes if the demand will be influence by the current condition in environment such as the state of the economy and interest rate. Simulation forecast is a method by combining the time-series and causal method.
Forecast errors tend to be large when the causal forces are contrary to the trend in the historical series. The effects of such problems are serious even though they occur only in a small percentage of cases. To apply Rule Based Forecasting, organizations must first identify features of the series using statistical analysis, inspection, and domain knowledge. The rules are then used to adjust data, and to estimate short- and long-range models. Rule Based Forecasting, forecasts are a blend of the short- and long-range model forecasts. Rule Based Forecasting is most useful when substantive domain knowledge is available, patterns are discernable in the series, trends are strong, and forecasts are needed for long horizons. Errors for rule-based forecasts are substantially less than those for combined forecasts under such conditions (Armstrong, Adya, & Collopy, 2001).
The choose of the best forecasting method is not a simple task; it sometimes involves more than one method which may be appropriate. Since 1960s significant gains have been made in forecasting for marketing. There has been the development of forecasting methods based on judgment, such as simulated interactions, Delphi, opinions surveys, intentions studies, bootstrapping, and combining. Methods based on statistical data have been developed, such as econometric methods, extrapolation and rule-based forecasting. Most recently, gains have come from the integration of statistical and judgmental forecasts (Grisffith & Wellman, 2009).
The researchers posit that once a new product is on the market, it is possible to use extrapolation methods. Extrapolation is often preferred when many demand forecasts are needed. Relatively simple methods suffice. Sophistication beyond a modest level increases costs and reduce understanding and it does not improve accuracy. Decomposition is appropriate when component series can be forecast more accurately than the aggregate (Meade & Islam, 2001). This study sought to find out the factors that affect demand based forecasting on inventory management in Kerio Valley Development Authority at Eldoret, Kenya. Section 2 covers review of past studies and defines the main hypothesis. Section 3 covers materials and methods. Section 4 covers the results and discussion. Section 5 presents the conclusion and section 6 covers the recommendations.
2.
LITERATURE REVIEW
2.1 Factors Affecting Demand Based Forecasting and Inventory Management
There are several challenges in demand based forecasting however, only seven are described in this chapter.
2.1.1 Forecasting and Revenue Optimization
Revenue optimizations systems are designed to optimize objectives such as margin maximization, maximization of revenue and inventory minimization. It helps the retail planner make better decisions on regular product pricing, promotional activity and markdown pricing. They succeed to the extent that they drive actions that improve financial results (Grisffith & Wellman, 2009). Optimization decisions are based, to a large extent, on the forecasted impact of various possible scenarios. For example, to determine whether it is better to price an item at $1.99 or $1.79, these systems must estimate the sales of product at these price points. These "forecasts" might be based on prior sales history for this item at various price points, or based on the pooled history of other items that have incurred price changes (Bechet & Maki, 2007).
2.1.2 Forecasting and Replenishment
2.1.3
Shrinkage
A policy that takes into account the uncertainties of supply and demand, and makes store-level inventory less dependent on a highly accurate forecast is known a good replenishment policy. Accurate forecasting at the store/item level is inherently difficult due to the amount of volatility and randomness in demand at this level of granularity. Sporadic or intermittent demand can also be a major problem, as illustrated by one "top 40" retailer that reported sales of less than one unit per week for half of its 30 million store/item combinations (Zikpin, 2000). Generating forecasts at a region and pooling demand across stores or warehouse level can help solve this problem. Forecasts will be more accurate at the aggregated level, and attention can be focused on maintaining the appropriate level of inventory at the warehouse. Good replenishment policy and execution will allow stores to maintain appropriate stock levels, without overdependence on store- or item-specific forecasts (Bechet & Maki, 2007).
2.1.4 Forecast Ability of Retail Demand
Forecasts sometimes may not be very good and will never be perfect. The goal of forecasting in retail should be to generate forecasts that are as accurate and unbiased as we can reasonably expect them to be, and to do this as efficiently as possible and not be a foolish pursuit of perfection (Slack et al., 2003). The problem of generating forecasts at granular levels of detail can be solved by use of large-scale automation. There should be a consideration of other strategies that can be used in conjunction with forecasting to best solve the business problem and a realistic assessment of the likely accuracy of forecasts at that level.
2.1.5 Information on Product Life Cycle
One of the serious challenges facing a demand forecaster in the e-business environment is ever shortening product life cycles. A product can be expected to have a life of at most one year in many industries. As is customary, it can inherit older history from its predecessor product, which can in turn inherit history from its own predecessor and so on. For ease of product management, most, if not all, organizations use a product hierarchy (Tobino, 2000). The hierarchy is organized by a set of attributes of the products, such as marketing attributes. Because individual products are phased out and new products come in constantly over time, and the fact that the hierarchy might be reorganized fairly frequently to reflect the fast changing business environment (e.g. gaining or losing major customers or markets), the product hierarchy is dynamic (Bechet & Maki, 2007).
2.1.6 Information on the Marketplace
Many streams of information from which a forecast can be made include demand history. There are at least two key opportunities on forecast information presented by e-business environment. First, high level indicators of economic activities such as total production output of an industry are more up-to-date than previously possible (Orme, 2005). Data regarding electronic transactions is collected automatically and continuously as it should be less error prone. This will be increasingly so as more and more business-to-business as well as business-to-business-to-consumer transactions are performed electronically. Note that this comment applies to retail store transactions as well, where the transaction is performed electronically at the point-of-sale and will be recorded into some central database. Second, economic data are available that is more detailed on those by product types within an industry. Our experience shows that detailed data are more useful as a predictor of the demand of a single product of an individual organization (Lapide, 2007).
2.1.7 Information on Consumers
The only piece of information coming directly from past consumers is no longer the demand history consisting of the selling price and the quantity sold. Customer database covers regular products such as children's products and end-user software packages (Kaleker, 2004). End users have very different incentives to register with the manufacturer for example, for future product updates in the form of product recalls or software downloads. More products include elements of software that will go through a typical life cycle of updates and customers are likely to register with the product manufacturer. The existing customer base comprises information at the manufacturer's own request as it is no longer characterized only by a total sales number (Nahmias, 2005).
3.
MATERIALS AND METHODS
the validity of the research instrument. Reliability of the research instrument was tested cronbach alpha. The data was analyzed using descriptive statistics. SPSS version 24.0 aided in Analysis.
4.
RESULTS & DISCUSSIONS
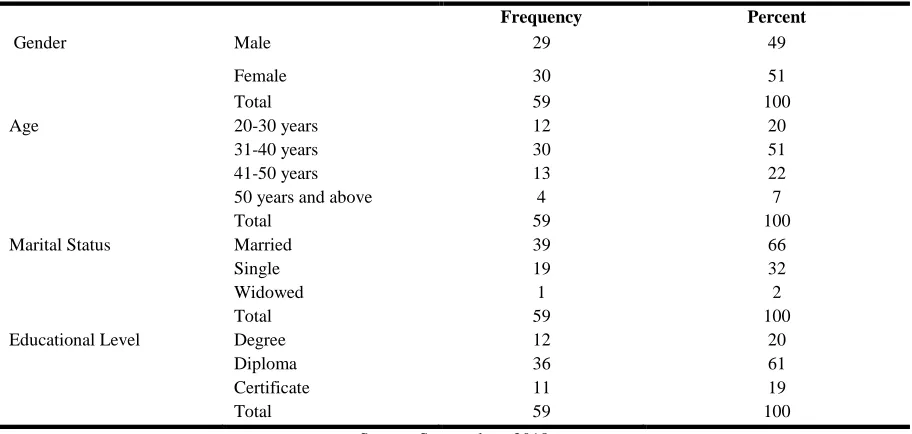
The researcher assessed the sex composition of the respondents and the results from the study indicated that the majority of the respondents were female 30 (51%) and male respondents were represented by 29 (49%). The age composition of respondents varied. The majority (51%) of the respondents belonged to 31-40 years age class whereas 50years and above age class had the least (7%) percentage representation. The majority of the respondents were married (66%), thirty two percent were single whereas 2% were widows. The respondents who had attained diploma (61%) had the highest percentage whereas those with certificates had the least (19%) percentage representation. The results also revealed that 20% of the respondents had degrees as shown in Table 4.1:
Table 4.1: Gender, Age, Marital Status and Educational Level Demographic Information
Frequency Percent
Gender Male 29 49
Female 30 51
Total 59 100
Age 20-30 years 12 20
31-40 years 30 51
41-50 years 13 22
50 years and above 4 7
Total 59 100
Marital Status Married 39 66
Single 19 32
Widowed 1 2
Total 59 100
Educational Level Degree 12 20
Diploma 36 61
Certificate 11 19
Total 59 100
Source: Survey data, 2018
The working experience of the respondents varied (Figure 4.1). The results from the study indicated that 30% of the respondents worked for the organization between 0- 5 years whereas 14% worked for 5-10 years, 44% of the respondents worked for 15-20 years, and those who worked for above 20 years represented 12% of the population. The highest number of respondents had a good working experience in the organization as they have stayed and worked for the organization for about fifteen years which shows that they are well versed with the organization requirements
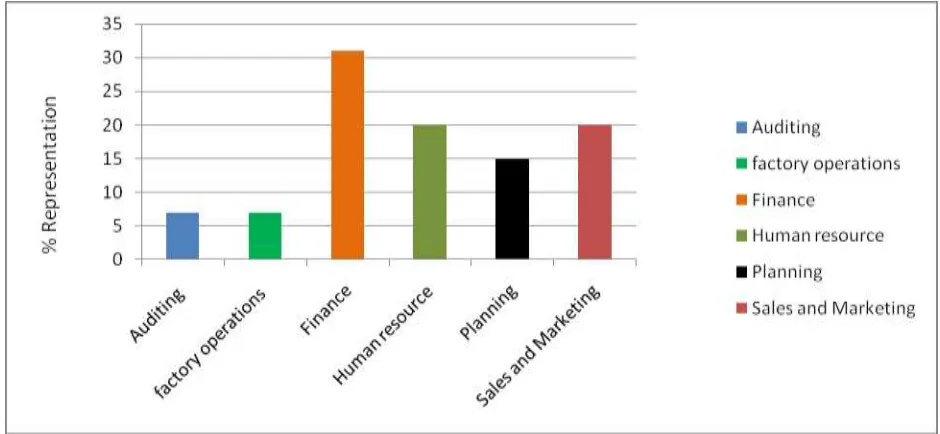
In a bid to establish the respondents department, the distribution of the respondents in the departments varied (Figure 4.2). Thirty one percent of the respondents were from the finance department whereas 15% of the respondents were from the planning department. The auditing and factory operations department had equal (7%) percentage representation. The results also indicated that Human Resource and Sales and Marketing departments had equal (20%) percentage representation.
Fig 4.2: Percentage representations of respondents in the different departments
4.1Factors Affecting Demand Based Forecasting
The opinion of the respondents towards the challenges of demand based forecasting was investigating and recorded. In regards to making use of consumer information to predict the future demand more reliably. The results revealed that 78% of the respondents agreed (12 strongly agreed and 66 agreed), both were in agreement with the opinion that one of the challenge of demand based forecasting is making use of consumer information to predict the future demand more reliably. Those who were not sure whether making use of consumer information to predict the future demand more reliably is a challenge were represented by 3% whereas 10% disagreed and 9% strongly disagreed. The results from the study revealed that, of the total respondents seventy nine percent of the respondents agreed that shortening product life cycle was a challenge to demand based forecasting. Respondents who strongly agreed and those who strongly disagreed and those who strongly agreed had equal (7%) percentage representation as tabulated below:
Table 4.2: Challenges of Demand Based Forecasting
Challenges SA A N D SD Total
Making use of consumers information to predict the future demand more reliably
Percentage 12 66 3 10 9 100
Shortening product lifecycles Percentage 7 79 9 0 7 100
Poor forecasting and replacement Percentage
7
36 34 17 7 100
Shrinkage Percentage 0 54 17 15 14 100
Wrong information on the market place Percentage 3 59 20 9 9 100
Forty two percent (7% strongly agreed and 36% agreed) of the respondents were in agreement with the opinion that one of the challenge of demand based forecasting is poor forecasting and replacement, Thirty four percent of the respondents were not sure with the opinion that the challenge is poor forecasting and replacement whereas 24% of the respondents were in disagreement (17% disagreed and 7% strongly disagreed) with the opinion.
The opinion of the respondents towards the fact that the challenge of demand based forecasting is shrinkage was varied. Fifty four of the respondents agreed with the opinion that shrinkage is one of the challenges of demand based forecasting, 17% of the respondents were not certain. The results also revealed that the opinion towards wrong information on the market place varied. Three percent of the respondents strongly agreed and 59% agreed with the opinion that wrong information on the market place is one of the challenges of demand forecasting. Respondents who were not certain whether wrong information in the market place was a challenge of demand based forecasting or not were represented by 20% whereas those who disagreed and those who strongly disagreed with the opinion had equal percentage(9%) representation. The study agrees with the findings of Bechet and Maki (2007) that detailed data are more useful as a predictor of the demand of a single product of an individual organization. It further agrees with the findings of Armstrong, Adya, and Collopy (2001) that mitigation of challenges facing demand based forecasting buffers a firm against possible losses imposes by myriad challenges that accrues as a result of demand based forecasting methods.
5.
CONCLUSIONS
The study realized that shortening of product life cycles, wrong information in the market place, and shrinkage of the business and lack of capacity to use customer information to predict the future demand were the challenges in Kerio Valley District Authority. Retailers want to grow sales, realize profits and satisfy customers. Revenue optimization systems help the retail planner make better decisions on regular product pricing, promotional activity and markdown pricing. There is a realistic assessment of the likely accuracy of forecasts level in the organization and consideration of other strategies that can be used in conjunction with forecasting to best solve the challenges affecting demand based forecasting and inventory management.
6.
RECOMMENDATIONS
In light of the findings and conclusion of the study, the study recommends that organizations’ should screen any information they come across before using it to effect changes in demand based forecasting and subsequently inventory management. Organizations should ensure at all times they have the right personnel competent enough to use customer information to predict future demand. Factors that causes shortening of product life cycles should be identified and assessed to weigh its meritocracy on the overall object of inventory management. More research is needed in this subject area to fully establish other factors that affect demand based forecasting and inventory management besides shortening of product life cycles, wrong information in the market place, shrinkage of the business and lack of capacity to use customer information to predict the future demand.
References
[1] Armstrong, J. S., Adya, M., & Collopy, F. (2001). “Rule-based forecasting: Using judgment in time-series extrapolation,” in J. S. Armstrong (Ed.) Principles of Forecasting. Norwell, MA: Kluwer Academic Publishers, 259-282.
[2] Armstrong, J. S., & Collopy, F. (2003). Identification of asymmetric prediction intervals through causal forces, Journal of Forecasting, 20, 273-283.
[3] Armstrong, J. S., Morwitz, V., & Kumar, V. (2000). “Sales forecasts for existing consumer products and services: Do purchase intentions contribute to accuracy?” International Journal of Forecasting, 16, 383-397.
[4] Bechet, T P., & Maki, W. R. (2007). Modeling and forecasting: Focusing on people as a strategic resource. Human Resource Planning, 10, 209-219.
[5] Cachon, G. P., & Fisher, M. (2000). Supply chain inventory management and the value of shared information. Management
science, 46(8), 1032-1048.
[6] Griffith, J. R., & Wellman, B. T. (2009), “Forecasting bed needs and recommending facilities plans for community hospitals: A review of past performance,” Medical Care, 17, 293-303.
[7] Heizer, J., Render, B., Munson, C., & Sachan, A. (2017). Operations management: sustainability and supply chain management,
12/e. Pearson Education.
[8] Kalaoglu, Ö. İ., Akyuz, E. Ş., Ecemiş, S., Eryuruk, S. H., Sümen, H., & Kalaoglu, F. (2015). Retail demand forecasting in
[9] Kalekar, P. S. (2004). Time series forecasting using holt-winters exponential smoothing. Kanwal Rekhi School of Information Technology, 4329008, 1-13.
[10]Lapide, L. (2007). Sales and operations planning (S&OP) mindsets. The Journal of Business Forecasting, 26(1), 21.
[11]Meade, N., & Islam, T. (2001). “Forecasting the diffusion of innovations: Implications for time series extrapolation, “in J. S. Armstrong (Ed.) Principles of Forecasting. Norwell, MA: Kluwer Academic Publishers, 4577- 4595.
[12]Nahmias, S. (2005). “Production and Operations Analysis”, McGraw-Hill Irwin.