International Journal Advances in Social Science and Humanities
Available online at: www.ijassh.com
RESEARCH ARTICLE
Implementation of the Basic Education Assistance Module (Beam)
Programme: The case of Zaka North District in Masvingo Province
Mangwaya Ezron*
Midlands State University, PB 9055, Senga Road Gweru, Zimbabwe.
*Corresponding Author: Email: [email protected]
Abstract
Poor and vulnerable learners are on the increase in developing countries. This has been a result of, among other factors, low gross domestic product, economic down turn and the emergence and spread of the HIV/AIDS pandemic. The latter has resulted in child headed families which can barely fend for their needs. This study investigates how an intervention programme called Basic Education Assistance programme has been implemented in the Zaka North district of Masvingo province in Zimbabwe. The programme was meant to ensure that poor and vulnerable primary school learners benefit with respect to tuition fees, school levies and examination fees. A descriptive survey was used in the study. Findings indicate that not all students identified as needy end up getting assistance. This is due to insufficient resources as well as factors related to the composition of the selection committee. The study proposes interventions which could be used to enhance transparency and an equitable distribution of available resources.
Introduction
Education is regarded as a human right by such legal frameworks like the United Nations Convention on the Rights of the Child and the African Charter on the Rights and Welfare of the Child. The United Nations [1] Convention on the Rights of the Child Article 28 (a) encourages state parties to make primary education compulsory and available to all. Article 28 (e) of this same
statute encourages countries which are
signatories to this international convention to take measures to encourage regular school attendance and the reduction of drop-outs rates. On the same note, The African Charter on the Rights and Welfare of the Child which entered into force on November 29, 1999, Article 11 part 1 also states that every child shall have the right to an education.
In response to these legal instruments, Zimbabwe as a signatory to these conventions also made provision for free and compulsory basic education for children. (Constitution of Zimbabwe Article 27 (1).
Background to the Study
When Zimbabwe attained independence in 1980, the government adopted the policy of education for all in an effort to redress the colonial educational injustices. This is supported by
Zvobgo [2] who posits that, „the colonial education system was divided into two systems: an elite system for whites and a very much inferior system for blacks‟. The adoption of the policy of education for all was in line with the provisions of the United Nations Convention on the Rights of the Child and the African Charter on the Rights and Welfare of the Child as has already been alluded to in the introduction. It was only in 1987 that Zimbabwe came up with its first Education Act. Some provisions enshrined in the 1987 Education Act which are relevant to this study are:
Education was declared a human right which implied that before its enactment, education especially for the African child was a privilege. Primary education for every school going age
was made compulsory. This meant that before the institutionalization of the 1987 Education Act, education for blacks was optional.
Under the 1987 Education Act, primary
education became free.
that, „The result was that the first decade of
independence experienced revolutionary
expansion of education‟.
However, in the early 1990s, the government of Zimbabwe adopted a cost sharing approach by steadily increasing the charges attached to school enrolment. This meant that parents had to pay part of their children‟s education.
The introduction of the Economic Structural Adjustment Programme (ESAP) left many parents out of employment resulting in their failure to pay fees for their children. This was aggravated by the 1992 drought which had a negative impact in the education system. This resulted in many children dropping out of schools because no parent was prepared to let his/her child go to school on an empty stomach [2]. Parents found it better to spend the little money they could get on basic needs like food rather than paying for their children‟s education. This resulted in a reversal of the achievements that had been made just after the attainment of independence.
The increase of school drop-outs was further compounded by the advent of the HIV/AIDS which left many children orphaned and vulnerable. With the advent of HIV/AIDS in Zimbabwe in 1985, when the first AIDS case was detected, Zimbabwe was forced to make a turnaround in order to address the pandemic at hand. In subsequent years the HIV/AIDS pandemic escalated and claimed many lives. Tarantola asserts that, „this led to school dropouts because of poverty, illnesses related to HIV/AIDS and some children were left with the responsibility of looking after their ill parents or relatives‟. This HIV/AIDS pandemic can also be attributed to the emergence of another type of family which was not common prior to the prevalence of this epidemic, namely, the Child Headed Household (CHH) Thirumurthy [3].This type of family becomes a dependency burden not only to the relatives of the surviving children but to the government. Such a situation shifted the burden to very old people in society who cannot work for themselves resulting in the guardians failing to send these vulnerable children to school. Along with Aids related illnesses and deaths, household assets are sold and medical costs increase. Due to these financial constraints caused by the pandemic, many children have been pulled out of schools to assist with the household activities in violation of children‟s rights to education. This is supported by a survey conducted by the Central Statistics Office in 1998
which revealed that children from poor households had their enrolment at school delayed or if they enrolled at all, they would eventually drop out. The survey further revealed that many children faced with starvation simply dropped out of school when resources became scarce, parents normally send boys to school while girls remain at home carrying out domestic chores.
In view of the plight of the vulnerable children in society, the Zimbabwean government then introduced the Basic Education Assistance Module (BEAM) programme in 2001 as a compliment of its Enhanced Social Protection Programme (ESPP) focusing on access to education as a social protection intervention [4]. The Basic Education Assistance Module was designed to facilitate enrolment and retention of orphaned and vulnerable children in society by providing them with tuition fees, school levies and examination fees among others. This is in accordance with the provisions of the 1987 Education Act which categorically declared education as a human right and the United Nations Convention on the Rights and Welfare of the Child Article 28 (e) which emphatically states that, „state parties should take measures to encourage regular attendance at schools and the retention of drop-out rates‟.
The Basic Education Assistance Module (BEAM) is a national programme which is being implemented in the country‟s sixty-one districts in both urban and rural areas including ZakaNorth District in Masvingo Province, where this research was conducted. However, in an attempt to implement this programme, it became evident that to some extent, some legitimate beneficiaries are being left out of this programme thereby violating these children‟s educational rights as enshrined in the aforesaid legal frameworks. This is supported by the chairperson of the Council of Social Workers, Manyanye [5] who posits that, „Not every child is accessing (BEAM) and this means that a considerable number of children are being denied their right to education‟.
process they were not consulted. In some cases teachers asked the status of those pupils who were selected by the Community Selection Committee only to find out that they had both parents alive and at times either of them being gainfully employed.
According to Manyanye [5] parents were also of the view that the selection process was not done in a transparent manner. They accused the BEAM Selection Committee of selecting their own children, and children of members of the School Development Committees (SDCs) on the pretext that they came to school regularly for meetings, hence they considered this as a way of compensating for their services, yet this should be done on voluntary basis. Parents also pointed an accusing finger to the Selection Committees of selecting children of influential people of society for example children of village heads, headsmen and chiefs (local government authorities). Furthermore, parents said the selection can be based on political grounds favouring children of prominent political figures for fear of being victimized if they did not select their children into the BEAM Programme.
On the other hand, the BEAM Selection Committee members defended themselves by arguing that since they were selected from the communities which formed the catchment areas of
respective schools, they had first-hand
information about the selected beneficiaries. They also argued that since they were regularly called for meetings at school, this disturbed their normal home chores therefore were justified to include their children in the BEAM Programme as compensation for their services at school.
Community leaders had concern over the welfare of the vulnerable children since they are within their areas of jurisdiction. They feel the programme is not able to sustain the ever-increasing large number of vulnerable children due to economic hardships, erratic rain patterns and the prevalence of the HIV/AIDS pandemic. The Chronicle of February 6, 2014 revealed mixed feelings about BEAM funding. It reported that Chief Shana of Hwange in Matebeleland North Province bemoaned the reduction of BEAM Allocation saying it was likely to worsen the already over-burdened communities and increase the number of school dropouts in the drought prone rural areas. „This is going to worsen the plight of the already overburdened communities. A lot of elderly people were left in custody of orphans with no other source of income to raise school fees. The government should quickly find
some alternative assistance for these vulnerable communities‟, said Chief Shana.
The same Chronicle of February 6, 2014, interviewed a BEAM Committee member in Lobengula Ward 14, Gwazaza who had this to say, „If a number of children drop out of school, most of them are likely to engage in prostitution, thieving and some become notorious street gangsters, thereby increasing the high level of criminal activities and social misfits. Government should take this issue seriously for it will have long term disastrous repercussions in society‟.
The print media had been very vocal on the implementation of the BEAM programme countrywide. For instance the Chronicle of 6 February revealed that lack of funding for BEAM would mean government‟s vision and commitment to protect the rights of children to education and efforts to attain the Millennium Development Goals (MDGs) goal number two which seeks for unimpeded universal primary education by 2015 might become impossible to attain if government fails to source other funds for the programme (BEAM). According to the News Day Zimbabwe of 28 January 2014, the former Minister of the then Ministry of Education Sport Arts and Culture, Coltart, said, „The government is allocating insufficient funds to education and if we are to ensure that the children at least get primary education, this has to improve significantly. BEAM is a symptom of a bigger problem‟.
According to the 2012 UNICEF Beam Evaluation and Assessment Report, Zimbabwe has more than 1,3 million orphans and about 10 000 of these are from child headed families. These are some of the poorest and most vulnerable children of society who need support from such schemes as BEAM.
The current situation in Zimbabwe is that free education will never be realized. Although the Education Act clearly stipulates that no child shall be sent home over non-payment of levies and tuition fees, school authorities (SDCs and Heads) still disregard the law by sending the vulnerable children home for the same reason. It is against this background that the researcher took interest to investigate how the BEAM programme which was meant to offset challenges faced by vulnerable children was being implemented in some schools in Zaka North District of Masvingo Province.
Statement of the Problem
provision in Zimbabwe resulted in many parents failing to pay fees for their children thereby denying them their educational rights. This led the government to come up with an intervention strategy in the form of Basic Education Assistance Module (BEAM). Various stakeholders have expressed concern about the manner in which this programme is implemented in schools. This study therefore investigates how the BEAM programmeis being implemented inprimary schools in the Zaka North District ofMasvingo Province in Zimbabwe.
Research Questions
The following questions guided this study:
To what extent was the BEAM Programme
being implemented?
Who were the eligible beneficiaries of this programme?
Who were the key players involved in the
selection process of BEAM beneficiaries?
What influence did these key players have in the selection process?
Research Design
This study adopted the descriptive research design. According to Key [6] the descriptive research method is used to obtain information concerning the current status of the phenomena, that is, to describe „what exists‟ with respect to variables or conditions in a situation. The data generation tools used was questionnaires and interviews. The descriptive surveywas suitable for this research because it would enable the researcher to collect data from a fairly large population.
Data Presentation
Responses by Head
Part 1 of Section A of the Head‟s questionnaires sought to find the enrolments of the four schools which formed the researcher‟s population. The enrolment figures are given in the table below.
Table 1: Enrolment figures of schools by sex and percentages
School Boys Girls Total Percentage
A 254 224 478 17,1%
B 73 73 146 5,2%
C 700 682 1 382 49,3%
D 438 356 794 28,4%
Grand Totals 1 465 1 335 2 800 100%
The above table shows that School C had the largest enrolment of 1 382 which constituted
49,3% of the total enrolment of the four schools. School C is a primary school situated near a growth point and near the district hospital. This could have attributed to the large enrolment. On
the other hand, school B has the lowest enrolment of 146, constituting 5,2% of the total enrolment. School B is a satellite school hence this could have contributed to the low enrolment. The enrolments of the four schools are also illustrated on the pie chart below.
Pie chart showing enrolment by school
Question 2 of Section A of the Head‟s questionnaire sought to find out whether the BEAM Selection process was conducted every year in the four schools, question 3 sought to find
out whether all eligible children were benefiting and question 4 sought to establish whether there was gender balance in selecting BEAM beneficiaries.
Table 2: Responses by school heads
Question Yes No Expected
2. Are BEAM beneficiaries selected every year? 4 0 4
3. Do all eligible children benefit from the programme? 0 4 4
4. Is there gender balance in selecting BEAM beneficiaries? 2 2 4
The above table shows that 100% of schools conducted the BEAM Selection process every year as is stipulated in the Handbook for School Development Committee.
Question 3 of the Head‟s questionnaire sought to establish whether all eligible children benefited from the BEAM programme. The responses from all the four heads shown above indicated that not all eligible children were benefiting from the BEAM programme. This is supported by the chairperson of the Council of Social Workers, Manyanye [5] who posits that; “Not every child is accessing (BEAM) and this means that a
considerable number of children are being denied their right to education.”
Question 4 of the Head‟s questionnaire sought to establish whether there was gender balance in the Selection of BEAM beneficiaries. From the information given in the table, 50% indicated that there was gender balance in the selection of BEAM beneficiaries while the other 50% indicated that there was gender imbalance in the whole selection process.
Section B of the Head‟s questionnaire sought to find information on BEAM beneficiaries for the years 2012 to 2014 in the four schools.
Table 3.0: Number of nominees and selected beneficiaries at school A
Year Total nominees Selected beneficiaries
2012 90 23
2013 100 41
2014 110 44
Table 3.0 shows that there was a steady increase in both the number of nominees and the number of selected beneficiaries from 2012 to 2014. In 2012, only 23 out of 90 nominees were assisted under the BEAM programme. This shows that only 25,6% of the nominees were assisted, the remaining 74,4% although they were eligible, did not benefit from the programme. In 2013, of the
100 nominees selected by the Community Selection Committee, only 41 children benefited. This shows that only 41% benefited, the remaining 59% were not assisted although they were eligible. Finally in 2014 of the 110 nominees, only 44 children got assistance from this programme. That shows that only 40% benefited from the programme and the remaining 60% were not assisted.
Table 3.1: Comparison of nominees against selected beneficiaries for school B.
Year Total Nominees Selected Beneficiaries
2012 46 19
2013 43 17
2014 47 16
Table 3.1 shows that there was a fluctuation in the number of both nominees and selected beneficiaries. For example in 2012, nominees were 46 and the selected beneficiaries were 19, but in 2013 the number of nominees fell down to 43 resulting in the number of selected beneficiaries decreasing to 17. In 2014 the number of nominees rose again to 47 but the number of selected beneficiaries dropped to 16. In 2012, 19 children out of the 46 nominees were assisted. These shows
Table 3.2: Comparison of nominees against selected beneficiaries at school C
Year Total Nominees Selected beneficiaries
2012 250 226
2013 200 178
2014 230 160
Table 3.2 shows a fall and a rise in both the
number of nominees and the selected
beneficiaries. The number of nominees fell from 250 to 200 from 2012 to 2013 resulting in the number of beneficiaries also decreasing from 226 to 178. However, although the number of nominees increased from 200 to 230 from 2013 to 2014 the number of beneficiaries decreased from 178 to 160. This shows that the number of vulnerable children increased from 2013 to 2014.
From the above table in 2012 about 90% of the nominees got assistance from the BEAM programme therefore only 10% were not assisted. In 2013, of the 200 nominees, 178 benefited from the BEAM programme. This shows that 89% benefited while 11% were not assisted. Finally, in 2014, of the 230 nominees, 160 pupils benefitted from the BEAM programme. This shows that about 70% were assisted and about 30% were laid off from the programme.
Table 3.3: Comparison of nominees against selected beneficiaries at school D
Year Total Nominees Selected Beneficiaries
2012 100 30
2013 120 35
2014 100 40
Table 3.3 above shows a fluctuation in both the nominees and the selected beneficiaries. From 2012 to 2013 the number of nominees rose from 100 to 120 resulting in the rise of selected beneficiaries from 30 to 35. However, from 2013 to 2014, the number of nominees dropped from 120 to 100 but the selected beneficiaries rose from 35 to 40. In 2012, 30 children out of 100 nominees benefited, showing that only 30% got assistance
from the BEAM programme. This reflects that 70% were not assisted although they were eligible. In 2013, 35 pupils, out of 120 nominees were assisted under the BEAM programme which shows that about 29% were assisted therefore 71% were not assisted. In 2014, 40 children out of a possible of 100 nominees got assistance from the BEAM programme. This shows that 40% were assisted by BEAM while the remaining 60% got no assistance.
Table 3.4: Summary of nominees against selected beneficiaries for the 4 schools from 2012-2014
Year Total nominees Selected beneficiaries Selected beneficiaries as percentage
2012 486 298 61,3%
2013 463 271 58,5%
2014 487 260 53,35
Grand Total 1 436 829 57,7%
Table 3.4 above shows that during the three consecutive years the BEAM programme was not able to accommodate all the eligible vulnerable children. From the table, out of the 1 436 possible nominees, 829 benefited from the BEAM programme. This represents 57,7% which shows
that 42,3% of the children who were entitled or were eligible for assistance did not benefit from the BEAM Programme. Section C of the Head‟s questionnaire sought to find the information on BEAM beneficiaries by category and by sex for the year 2014 for the four schools.
Table 3.5: BEAM beneficiaries by category and sex for school A
Category Boys Girls Total
Both parents deceased 10 13 23
One parent deceased 9 8 17
Has previous record of failure to pay fees 1 1 2
Disabled and poor 1 1 2
21 23 44
From the above table, a total of 44 children were assisted by the BEAM programme in 2014. Twenty one (21) boys out of a total of 44 children were assisted giving 47,7%. Twenty three (23) girls out of 44 children were assisted making 52,3%. At this school there was no gender balance in the selection of BEAM beneficiaries because
assisted and finally 2 out of the 44 who were
assisted fell under the category of the disabled and the poor.
Table 3.6: BEAM beneficiaries by category and by sex for the year 2014 for school B
Category Boys Girls Total
Both parents deceased 4 5 9
One parent deceased 2 4 6
Disabled and poor 0 1 1
Grand totals 6 10 16
From the above table, a total of 16 children were assisted under the BEAM Programme. Only 6 boys out of 16 children were assisted, giving 37,5%. Ten (10) girls of the 16 children were assisted giving 62,5%. It is also evident from the above table that there was no gender balance in
the selection of BEAM beneficiaries. As for school A more girls were assisted than boys. Lastly, as in school B, the greatest number of children assisted were orphans who had either both or one parent(s) deceased.
Table 3.7: BEAM beneficiaries by category and by sex for the year 2014 at school C
Category Boys Girls Total
Both parents deceased 42 36 78
One parent deceased 24 18 42
Dropped out of school due to economic hardships 10 8 18
Disabled and poor 4 4 8
Living in child headed household 6 4 10
Children in foster houses 2 2 4
Grand Totals 88 72 160
School C which had the greatest enrolment of 1 382 pupils had also the greatest number of children who were assisted by BEAM. Out of the 160 pupils assisted by BEAM, 88 were boys and 72 were girls, constituting 55% and 45% respectively. At school C, there was no gender balance in the selection of BEAM beneficiaries.
This time more boys than girls were assisted under the BEAM programme. As for schools A and B, school C also had orphans as the greatest number of children assisted. A total of 120 orphans who had either both or one parent(s) deceased were assisted. It can also be seen from the table that the beneficiaries were distributed through the various categories according to the Project Management Unit (PMU) form.
Table 3.8: BEAM beneficiaries by category and sex for the year 2014 for school D
Category Boys Girls Total
Both parents deceased 10 12 22
One parent deceased 10 8 18
Grand Totals 20 20 40
Table 3.8 above shows that a total of 40 children were assisted under the BEAM Programme. Of the 40 assisted children 50% were boys and 50% were girls. This shows that amongst all the four schools, School D observed gender balance in the
selection of BEAM beneficiaries. The table also shows that only orphans who had their both or one parent(s) deceased were assisted under the BEAM Programme.
Responses by Teachers
Table 3.9: Responses on teachers’ participation in the BEAM programme at school a
Question Yes Responses No Responses
1 Did you do Child Study at College? 2 0
2 Is the information from the Child Study you conduct in your class used in the selection of BEAM Beneficiaries?
2 0
3 Do you have vulnerable children in your class who were not selected into the BEAM programme?
1 1
4 Is the BEAM selection at your school transparent? 2 0
The above table shows that both teachers who provided answers to this questionnaire had gone to College and had done Child study which can be used in the selection of BEAM beneficiaries. Both teachers agreed that the information on Child study that they conduct in class is also used during the selection of BEAM beneficiaries. On
Table 4.0: Responses on teacher participation in the BEAM programme at school B
Question Yes Responses No Responses
1 Did you do Child Study at College? 2 0
2 Is the information from the Child Study you conduct in your class used in the selection of
BEAM Beneficiaries? 2 0
3 Do you have vulnerable children in your class who were not selected into the BEAM
programme? 2 0
4 Is the BEAM selection at your school transparent? 2 0
The above table indicates that both teachers had done child study at College. Both teachers showed that the information from their child study is used in the selection of BEAM beneficiaries. On question 3 on vulnerable children in their classes
who were not included in the BEAM Programme both teachers agreed that they had such children. Finally, for question 4, which sought to find the transparency of BEAM Selection process, there was a 100% agreement.
Table 4.1: Responses on teacher participation in the BEAM programme at school C
Question Yes Responses No Responses
1 Did you do Child Study at College? 2 0
2 Is the information from the Child Study you conduct in your class used in the selection of
BEAM Beneficiaries? 2 0
3 Do you have vulnerable children in your class who were not selected into the BEAM
programme? 2 0
4 Is the BEAM selection at your school transparent? 2 0
The above table shows that 100% of teachers had done Child Study at College. For question 2 both teachers agreed that their knowledge of Child Study was being used in the selection of BEAM beneficiaries. In question 3, which sought to establish whether teachers had vulnerable
children in their classes who had been left out of the BEAM programme, both teachers agreed that they had such children in their classes. Question 4 sought to establish whether the BEAM selection process was transparent. Both teachers indicated that the BEAM Selection process was done in a transparent manner.
Table 4.2 Responses on teacher participation in the BEAM programme at school D
Question Yes Responses No Responses
1 Did you do Child Study at College? 2 0
2 Is the information from the Child Study you conduct in your class used in the selection of BEAM Beneficiaries?
0 2
3 Do you have vulnerable children in your class who were not selected into the BEAM
programme? 2 0
4 Is the BEAM selection at your school transparent? 1 1
Table 4.2 above shows that both teachers did Child Study at College. Question 2 of the questionnaire sought to find if the information got by teachers from child study was used in the selection of BEAM beneficiaries. The responses reveal that this information was not used in the BEAM Selection process. Question 3 sought to find whether teachers had vulnerable children in
their classes who were not included in the BEAM Programme. Both teachers agreed that they had vulnerable children who were excluded from the BEAM Programme. Question 4 sought to establish the transparency of the Selection of BEAM beneficiaries at this school. 50% of the respondents agreed that there was transparency in the selection of BEAM beneficiaries while the other 50% said there was no transparency. Table 4.3: Distribution of teachers’ responses for the four schools
Question Item 1 2 3 4
Frequency for Yes responses 8 6 7 7
Frequency for NO responses 0 2 1 1
The frequency table above shows that for Question 1 which sought to find whether teachers had done Child Study at College, all 8 teachers agreed that they did Child Study at College. Question 2 sought to find if their knowledge of child study was being used n the selection of BEAM beneficiaries. 6 agreed that their knowledge of Child Study was being use in the selection of BEAM beneficiaries, while 2
of the BEAM selection process in schools. The table shows that out of the 8 respondents, 7 agreed that there was transparency in the execution of the BEAM Programme. Again this represents 87,5% as compared to 12,5% who said
there was no transparency in the implementation of the BEAM Programme. From this analysis it can be concluded that to a large extent there is transparency in the selection of BEAM beneficiaries.
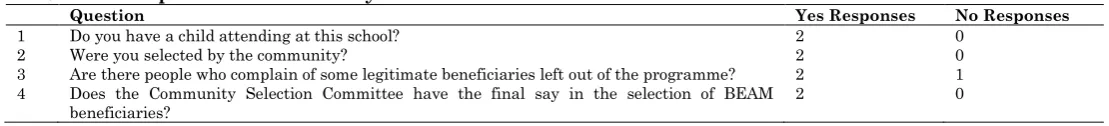
Table 4.4: Responses by the community selection committee of school A
Question Yes Responses No Responses
1 Do you have a child attending at this school? 2 0
2 Were you selected by the community? 2 0
3 Are there people who complain of some legitimate beneficiaries left out of the programme? 1 1 4 Does the Community Selection Committee have the final say in the selection of BEAM
beneficiaries?
2 0
The above table shows that both members of the Community Selection Committee had children who attended at that school. For question 2 which sought to find out whether these members were selected by the community, both members indicated that they had been chosen by the community. On question 3 which sought to find out whether there were any people who
complained of some legitimate beneficiaries left out of the programme, 50% indicated that there were parents who came to complain while the other 50% disagreed. Question 4 sought to find
out whether the Community Selection
Community had the final say in the selection of BEAM beneficiaries? On this question there was a 100% agreement that he Community Selection Committee had the final say in the selection process of BEAM beneficiaries.
Table 4.5 Responses by the community selection committee for school B
Question Yes Responses No Responses
1 Do you have a child attending at this school? 2 0
2 Were you selected by the community? 2 0
3 Are there people who complain of some legitimate beneficiaries left out of the programme? 1 1 4 Does the Community Selection Committee have the final say in the selection of BEAM
beneficiaries?
2 0
From the above table, for question 1, both respondents indicated that they had children attending at that school. Question 2 sought to establish whether these members were selected by the community. Both respondents indicated that they had been selected by the community. For question 3 which sought to find whether there were people who complained of some legitimate
beneficiaries being left out of the programme, 50% agreed while the other 50% disagreed. Question 4 sought to find out if the Community Selection Committee had the final say in the selection of BEAM beneficiaries. Both respondents were in agreement that the Community Selection Committee had the final say in the whole selection process.
Table 4.6: Responses by the community selection committee for school c
Question Yes Responses No Responses
1 Do you have a child attending at this school? 2 0
2 Were you selected by the community? 2 0
3 Are there people who complain of some legitimate beneficiaries left out of the programme? 1 1 4 Does the Community Selection Committee have the final say in the selection of BEAM
beneficiaries? 2 0
The table above shows that for question 1 all the respondents had children attending at that school. For question 2, respondents agreed that they had been chosen by the community. For question 3 which sought to find whether parents complained of some legitimate beneficiaries left out of the programme, 50% agreed that some
legitimate beneficiaries were being left out of the programme while the other 50% disagreed. For question 4, both respondents agreed that the Community Selection Committee had the final say in the selection of BEAM beneficiaries.
Table 4.7: Responses of community selection committee for school D.
Question Yes Responses No Responses
1 Do you have a child attending at this school? 2 0
2 Were you selected by the community? 2 0
3 Are there people who complain of some legitimate beneficiaries left out of the programme? 2 1 4 Does the Community Selection Committee have the final say in the selection of BEAM
beneficiaries?
Table 4.7 above shows that for question 1, both respondents had children attending at that particular school. Question 2 sought to find whether the respondents had been chosen by he community. Both respondents indicated that they had been chosen by the community. For question 3, both respondents indicated that parents were complaining of children who are left out of the
programme. On question 4 again, both respondents indicated that the Community Selection Committee had the final say in the selection of BEAM beneficiaries.
The above bar graph below shows responses by the Community Selection Committee for the four schools
Figure 1: Bar graph showing responses of the community selection committees.
The above graph shows that 100% of the respondents indicated that they were selected into the committee because they had children attending in their respective schools. On question 2 again 100% of the respondents agreed that they were selected into the committee by the community. For question 3, 62,5% indicated that
they were parents who complained of some eligible children being left out of the programme. For question 4, 87,5% of the respondents indicated that the BEAM selection committee has the final say in the selection of BEAM beneficiaries.
Table 4.9 Responses from parents from School A on the implementation of the BEAM programme
Questions Yes No
1 Were you involved in the initial nomination of BEAM beneficiaries? 1 1
2 Are there eligible children in your community who were left out of the BEAM programme? 2 0
3 Does the Community Selection Committee follow given categories to determine beneficiaries? 1 1 4 Are you pleased with the manner in which the BEAM selection process is conducted at your school? 0 2
From the above table in relation to question 1, 50% of the respondents agreed that they were involved in the initial nomination of BEAM beneficiaries while the other 50% revealed that they were not involved in the initial nomination exercise. For question 2, there was a 100% agreement that there were some eligible children
in the community who were left from the BEAM programme. In relation to question 3, 50% agreed that the Community Selection Committee followed the given categories to determine beneficiaries while the other 50% disagreed. In question 4, there was a 100% disagreement that respondents were pleased in the manner in which the BEAM selection process was conducted.
Table 5.0 Responses from parents from School B on the implementation of the BEAM programme
Questions Yes No
1 Were you involved in the initial nomination of BEAM beneficiaries? 2 0
2 Are there eligible children in your community who were left out of the BEAM programme? 1 1
The above table shows there was a 100% respondent involvement in the initial nomination of BEAM beneficiaries. For question 2, 50% indicated that there were eligible children in their community who were left out of the BEAM programme while the other 50% disagreed. For question3, again 50% indicated that the Community Selection Committee followed the
given categories to determine beneficiaries while the other 50% indicated that the committee did not follow laid down categories to determine BEAM beneficiaries. Similarly, on question 4, 50% indicated that they were pleased in the manner in which the BEAM selection process was conducted at this school while the other 50% indicated that they were not pleased.
Table 5.1: Responses of parents on the implementation of the BEAM programme at School C
Questions Yes No
1 Were you involved in the initial nomination of BEAM beneficiaries? 2 0
2 Are there eligible children in your community who were left out of the BEAM programme? 1 1
3 Does the Community Selection Committee follow given categories to determine beneficiaries? 1 1 4 Are you pleased with the manner in which the BEAM selection process is conducted at your school? 1 1 Above table indicates there was a 100%
respondent involvement in the initial nomination of BEAM beneficiaries. For question2, 50% of the respondents indicated that there were eligible children in the community who were left out of the BEAM programme while the other 50% disagreed. For question 3, 50% of respondents
agreed that the Community Selection Committee followed the given categories to determine BEAM beneficiaries while the other 50% disagreed. Finally for question 4, again 50% of respondents indicated that they were pleased in the manner in which the BEAM selection process was done at their school while the other 50% disagreed.
Table 5.2 Responses of parents of School D on the implementation of the BEAM programme
Questions Yes No
1 Were you involved in the initial nomination of BEAM beneficiaries? 0 2
2 Are there eligible children in your community who were left out of the BEAM programme? 1 1
3 Does the Community Selection Committee follow given categories to determine beneficiaries? 1 1 4 Are you pleased with the manner in which the BEAM selection process is conducted at your school? 1 1 The above table shows that both respondents
were not involved in the initial nomination of BEAM beneficiaries. For question 2, 50% of the respondents indicated that there were eligible children in their community who were left out of the BEAM programme while the other 50% disagreed. In question 3, 50% of the respondents
indicated that the BEAM Selection Committee followed the categories while the other 50% disagreed. On question 4, one respondent agreed that s/he was pleased with the manner in which the BEAM selection process was conducted while the other disagreed.
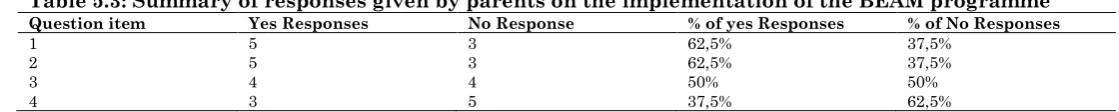
Table 5.3: Summary of responses given by parents on the implementation of the BEAM programme
Question item Yes Responses No Response % of yes Responses % of No Responses
1 5 3 62,5% 37,5%
2 5 3 62,5% 37,5%
3 4 4 50% 50%
4 3 5 37,5% 62,5%
The above table shows that 62,5% of the respondents were involved in initial nomination of BEAM beneficiaries while 37,5% did not take part in this exercise. For question item 2, 62,5% of the respondents indicated that there were eligible children in their communities who were left out of the programme, while 37,5% disagreed. In question 3, 50% of the respondents showed that the Community Selection Committees followed the given categories in determining beneficiaries while another 50% disagreed. Finally, for question 4, only 37,5% of the respondents indicated that they were pleased with the manner in which the selection process was conducted while the majority 62,5% expressed displeasure in the manner in which the programme was being carried out.
Data Discussion and Analysis
Workers, Manyanye [5] who posits that, “Not every child is accessing (BEAM) and this means that a considerable number of children are being denied their right to education.” From this evidence, it is clear that the government does not have adequate money to fund this pro-poor programme.
The research also found out that to some extent there was gender imbalance in the selection of BEAM beneficiaries. According to the 2014 statistics, the total number of boys in the four schools who were assisted was 135 as compared to 125 girls. This shows that the girl child is disadvantaged as far as access to education is concerned. This according to the Handbook for School Development Committees is a violation of one of the primary objectives of BEAM which stipulates that there must be a gender balance in BEAM beneficiaries (50% must be boys and 50% must be girls.)
This study also revealed that in coming up with the eligible beneficiaries to some extent the Community Selection Committees adhered to the demands of the Project Management Unit (PMU) by following the categories specified by the BEAM instruments such as the BEAM form 1/1 for able bodied children and the BEAM Primary form 4/1 for the disabled children. The research showed that 50% of the Community Selection Committees followed these categories while the other 50% did not observe the categories.
On the aspect of whether the implementation of the BEAM programme was transparent, this research revealed that 87,5% of the teachers agreed that there was transparency in the implementation of the BEAM programme. However, 62,5% of the members of Community Selection Committee indicated that there were parents who complained about the selection process. Furthermore, 62,5% of the parents expressed displeasure on the manner in which the BEAM programme was being implemented. Therefore from these findings, it can be concluded that to some extent there are some irregularities in the implementation of the BEAM programme. As once has been alluded to earlier on in this research that this research was conducted soon after the BEAM Audit Team had visited schools in the district, teachers might have given wrong information about this programme for fear of putting their schools into disrepute.
The findings of this research also revealed that to a large extent, the Community Selection Committees have the final say in the selection
process of BEAM beneficiaries. This is because 87,5% of the respondents indicated that the BEAM Selection Committees had the final say in the selection of BEAM beneficiaries. This is
supported by Transparency International
Zimbabwe [7] research officer who posits that, “The process of selecting BEAM beneficiaries is decentralized. It is done at primary school level and is spearheaded by the Community Selection Committee structures that are solely put in place to take charge of the process at local level.” The same sentiments are echoed by Sisimayi, Principal Director and Acting Secretary for Primary and Secondary Education in the Zimbabwean of 5 March 2014 who posits that,
“Members of the Community Selection
Committees are constituted to help identify and assist the needy children.” This therefore clearly shows that the Community Selection Committees to a large extent have great influence in the whole process of selecting BEAM beneficiaries, hence, they are key players in determining who should or should not benefit from the BEAM programme.
However, this autonomy by the Community Selection Committees is prone to abuse. This assertion is shared by Mutondoro [8] of Transparency International Zimbabwe who remarks that, “It is at this level where a lot of corruption reports have been made. BEAM beneficiaries have been selected not on the basis of need, but rather on a multiplicity of factors which include partisan basis, nepotism and return for personal favours.
Conclusions
Evidence gathered from this study revealed that:
The (BEAM) selection process was conducted
every year in schools.
Not all eligible children were benefiting from the BEAM programme.
To a lesser extent there was gender imbalance in the selection of beam beneficiaries.
To a larger extent teachers were involved in the selection of BEAM beneficiaries.
The Community Selection Committees were
selected by the community.
To a large extent the Community Selection
Committees had the final say in the selection of BEAM beneficiaries.
There was no transparency in the
implementation of the BEAM Programme.
To a large extent parents were not pleased in the manner in which the BEAM programme was being implemented in schools.
Recommendations
In the light of the findings of this research, the following recommendations are hereby being made:
Government should engage the donor
community in a bid to ensure that enough resources are marshalled so that the BEAM programme can be able to accommodate all eligible vulnerable children.
There is need for constant supervision of the selection process for proper implementation of the BEAM Programme so that education becomes a right for every child.
The Community Selection Committees should
shun corruption in the selection process of BEAM beneficiaries so that the rightful vulnerable children benefit from the programme.
Further research should be conducted on a large
scale so as to establish how the Beam programme is being implemented in all the ten provinces of Zimbabwe.
References
1. UNESCO (1989) Conventions on the Rights of the Child. New
York.
2. Zvobgo RJ (1994) Colonialism and education in Zimbabwe. Harare: Sapes Books.
3. Thirumurthy H (2012) Improved employment and children‟s education outcomes in households of HIV positive adults with high CD4 Counts.
4. Gwirayi P (2010) Sociology of Education Gweru: Mambo Press.
5. Manyanye G (2012) BEAM: Pros and cons. Harare: Jongwe Printers.
6. Key JP (1997) Research on occupational education: Oklahoma State University.
7. Transparency International Zimbabwe (1999) Evaluation of Basic Education Assistance Programme. Harare: Zimbabwe. 8. Muranda Z (2004) Descriptive writing, concepts and practices.
Harare: University of Zimbabwe Publications.
9. African Charter on the Rights and Welfare of the Child (1999).
10.Barker R (1986) Philosophies of education. An introduction course. Harare: Letho Services (Pvt) Ltd.
11.Chiromo AS (2009) Research methods and statistics in education. Gweru: Midlands State University.
12.Cohen L, Manion, L, Morrison, K. (2006) Research methods in education. London: Routledge.
13.Constitution of Zimbabwe (2013).
14.Dawson T (2002) Practical research methods: New Delhi: UBS.
15.Degu G, Jigzaw (2006) Research methodology. The Ethiopian Public health training initiative. The charter Centre. The Ethiopian ministry of education.
16.Ministry of Education (1987) The Education Act. Harare: Government Printers.
17.Fraenkel JR, Wallen VE (2003) How to design and evaluate research in education. 5th Ed. New York: Mac Graw Hill.
18.Gilbert GN (1970). Researching Social life. London: Sage. 19.Holiday A (1995) Doing and writing qualitative research.
London: Sage Publications.
20.Leedy PD (1980) Practical research and design: New York: MacMillan.
21.Nziramasanga CT (1999) The Presidential Commission on Education and Training Harare: Government Printers.
22.Salanki B (1958) The technique of Correlation in basic education. Ahmedabad: Navajivan Publishing House.
23.The Chronicle February 6 (2014). 24.The Selected work of Gandhiji Volume 6.
25.The Zimbabwean March 5 (2014.
26.UNICEF (2012) BEAM evaluation and assessment report. Harare: UNICEF