Research Article
a
June
2018
Computer Science and Software Engineering
ISSN: 2277-128X (Volume-8, Issue-6)
Measurement-based Statistical Method for Estimating and
Verifying Signal Coverage and Coverage Probability in Urban
Microcells
Kingsley Obahiagbon
Computer Sciences Benson Idahosa University, Department of Benin City, Nigeria
Joseph Isabona
Department of Electronics Engineering, University of Kwazulu Natal, South Africa
Abstract: Customer’s complaints and concerns about radio signal coverage at their home are important trigger to performance relevant drive test in the relevant area to observe the coverage quality. In this paper, statistical approach has been employed to assess the quality of the radio coverage and outage probability based on measured radio signals in an established UMTS network, operational in Ikoyi, a typical urban microcell in Nigerian environment. The results shows that the quality of radio signals at the cell edge is very poor in locations 2 and 4, as they recorded poor coverage probability performance of 89.25% and 81.72% and high outage probability performance of 10.74% and 18.28% respectively. It is also observed that the smaller the fade margin, the higher the outage probability and the lower the coverage reliability. This implies that the smaller the fade margin, the smaller the received signal strength at the MS and the more likely outage events. Hence, sufficient signal strength is needed at the mobile terminals at locations 2 and 4 in order to achieve the outage probability and coverage reliability required to effectively operate cellular communication networks.
Keywords: Radio signal coverage, fade margin, coverage probability reliability, outage probability performance, urban microcell
I. INTRODUCTION
In recent years, the acceptance and usage of smart phones and other personal mobile devices have become more widespread, which requires the cellular communication networks to provide high quality connections with good coverage.
The fundamental concept of modern wireless communication networks is a cell. A cell can defined as geographic area within which mobile users can communicate with a particular base station (BS) (see figure 1). The BS of the cell is the physical location of some of the equipment needed to operate the wireless network, such as antennas, GPS timing systems, cell towers, etc. The idea of cellular layout is to allow efficient use of bandwidth: in GSM systems, for instance, each cell is allocated a group of frequency bands which is completely different from the group allocated to the neighboring cells [1]. The combinations of these cells is what provide a radio coverage over a large geographical area of the entire network
The coverage area of each cell varies in sizes - macro, micro, pico, femto, nano and umbrella cells; each which are usually implemented according to different environment and configuration. Macro cells can be regarded as cells where the BS antenna is installed on a mast or a building above average rooftop level [2].The BS range of a macro cell is generally 100 meters to some few kilometers. Micro cells are cells whose antenna height is under average rooftop level; the BS range of a micro cell is generally 100 meters to 1000 meters and they are typically used in urban areas. Pico cells are small cells whose BS range of a Pico cells are generally less than 100 meters; they are mainly used indoors and airports. Femto cells are cells designed for use in homes, office areas or small business environments; the BS range typically covers small areas of tens of meters. Nano cells are cells usually mounted on walls, in vehicles or outdoor weatherproof enclosure. Umbrella cells are used to cover shadowed regions of smaller cells and fill in gaps in coverage between those cells [2].
ISSN(E): 2277-128X, ISSN(P): 2277-6451, pp. 74-83
place and maintain a call. The receiver sensitivity is given by the minimum signal level where a mobile station (MS) is still able to operate effectively.
Figure 4: A typical cellular scenario ([4])
The most used measures of the coverage reliability in cellular networks are cell edge reliability and cell area reliability [5]. Cell edge reliability refers to the probability that the RF signal strength measured on a circular contour at the cell edge will meet or exceed a desired quality threshold. Whereas, cell area reliability is the probability that RF signal will meet or exceed the quality threshold after integrating the contour probability over the entire area of the cell (i.e., across all of the contours of the cell, including the cell edge). Thus, Signal strength level measurements at the mobile terminal must be taken into consideration while designing a new network or optimizing an existing network in order to provide an efficient and reliable coverage area.
In this paper, frequency-based statistical analysis approach was employed to assess the quality of the radio coverage and outage probability based on measured radio signals in an established UMTS network, deployed in a typical urban microcell in Nigerian environment.
II. PROBLEM STATEMENT
Generally, in wireless communication networks, the transmission environment can vary greatly as conditions evolve over time. This leads to the variation in the received radio signals caused by propagation factors, not only due to changes in the distance between the transmitter and the receiver, but also to shadowing and multipath fading. Shadowing occurs when a topographical elements and other structures such as tall buildings and tress in the transmission path between the transmitter and receiver obscures the main signal path between the transmitter and the receiver. Such topographical elements attenuate signal power through absorption, reflection, scattering, and diffraction; when the attenuation is very strong, the signal is drop.
The increasing rate of call drops, especially in urban and metro areas, can also be attributed to these propagation factors on signal behavior such as reflections and multipath, diffraction and shadowing, building and vehicle penetration, propagation of signal over water, propagation of signal over vegetation (foliage loss) and fading of the signal. In [7], more than 50% of the reasons for dropped calls/network failures in a cell, especially in urban and metro areas, have be attributed to these propagation factors.
ISSN(E): 2277-128X, ISSN(P): 2277-6451, pp. 74-83
Thus, customer’s complaints and concerns about radio signal coverage at their home are important trigger to performance relevant drive test in the relevant area to observe the coverage quality. Information about radio coverage is essential for network planning, network optimization and radio resource parameter optimization, as well as backend network management activities, such as network dimensioning, PAPEX/OPEX planning and marketing [8].
Moreover, it is very for very important for telecom operators to be aware of the radio coverage and quality their networks provide for effective for network planning and performance optimization. This can only be achieved by carrying out drive test periodically in order to update their understanding of the radio coverage levels their networks provide. This kind of drive test is also performed on a regular basis by a third party (the end users) in particular, for benchmarking telecom operators.
However, how to carry out such a periodic drive test in urban terrain where there are always vehicular traffic jams, with busy streets all day long is the real challenge.
III. MATERIALS AND METHODS A. Theoretical Framework
Providing adequate signal coverage of the target area or at the cell edge is of paramount importance for proper functioning of wireless cellular networks.
In typical cellular network environments, the variations in the received signal strength as measured at different receivers’ locations from the same transmitter are random and independent due to obstacles between the transmitter and receiver that attenuate signal power through absorption, reflection, scattering, and diffraction.This type of variation in the signal strength is called shadowing and is usually formulated as log-normally distributed over the ensemble of typical locals [9]. Shadowing creates holes in coverage areas and results in poor coverage and poor service quality in different places. When the attenuation is strong, the signal is blocked.The log-normal received signal strength, Pr at distance d
from the transmitter can be described by [10]:
Xr
d
d
P
r
P
0 010
log
)
(
(1)where P0 is the reference power measured at a distance of d, do is the reference distance, ß is the path-loss exponent, and Xr represents a normal random variable with zero mean and standard deviation, σ.
The probability density function (PDF) of the received signal’s envelope affected by shadowing follows lognormal distribution that can be written in the following mathematical form [11]:
2
2
µ)2
(
exp
2
1
)
(
x
x
P
(2)where µ and σ are mean and standard deviation of the shadowed component of the received signal, respectively. Typically, σ in dB ranges from 4 dB to 12 dB in outdoor environments [12], and
x
is the signal strength measured value. The probability thatx
exceeds the threshold,x
o at a given radius r is given by
x
x
p
x
dx
P
r
P
xo o
o
(
)
(
)
(3)By integrating the probability density function from
x
o to ∞, the edge reliability results is
2
-µ
1
2
1
)
(
oo
r
erfc
x
P
(4)where
FM
µ
-
x
o defines the fade margin and r is the cell radius.Here, FM is excess or additional margin forcompensating signal variation levels at the receiver due to shadowing fading. This is to maintain the signal strength level above the target level at the input of the receiver according to the reliability required from the system.Equation (4) expresses cell edge reliability and it is defined as the probability that the received signal strength measured on a circular contour at the cell edge will exceed or meet a desired quality threshold.
B. Outage Probability Model
Outage probability is another important parameter for performance evaluation of cellular communication networks. An outage occurs when the signal fading component is larger than FM. The outage probability of the cell is defined as the percentage of area within the cell that does not meet its minimum signal strength requirement,
x
o and it isISSN(E): 2277-128X, ISSN(P): 2277-6451, pp. 74-83
2
2
1
FM
erfc
P
FMout (5)
Equation (4) is related to equation (5) by:
)
(
1
P
r
P
outFM
o (6)C. Study Locations, Measurement and Methods
The quality of communication links is a function of many variables including location, distance, direction and time [14][15]. Here, seven cell site locations, namely location 1, 2, 3, 4, 5, 6 and 7 were randomly chosen for this study and depended on the accessibility of the testing to a particular location.
D. Investigated Environment
This research was carried out in Ikoyi, Lagos Nigeria. Ikoyi lies to the northeast of Obalende and adjoins Lagos Island to the West, and the edge of the Lagos Lagoon; its geographical coordinates are within latitude 6o 27' 11" North, longitude 3o 26' 8" East. Ikoyi is often regarded as the most affluent neighborhood of Lagos, with most sumptuous residential facilities in Nigeria. It is also thought to have the most expensive real estate on the entire African continent. So, Ikoyi was chosen to represent a typical urban region which consists of blocks densely high rise commercial buildings/human made structures. Ten main radio BSs are used to cover main parts of this area. The coverage and quality test perform is limited to outdoor environment. The areas the drive test covers are along the main strength roads of the studied area.
Past study reveals that determining the propagation of a city requires taking measurement at various high and low environment or taking exhaustive measurement round the city to cover all the possible terrain conditions [16-18]. In this study, the focus is on the first approach.
E. Measurement Campaign
Measurements were conducted with Drive test tools that could generate calls automatically and uniformly within the cellular network of study.The testing process started with selection of the cell site locations of the network where the tests need to be performed, and the drive testing path. In this study, Drive test was performed to assess signal strength levels from a moving subscribers’ point of view. The tools consisted of a Vehicle, Test terminal, Test cable, Laptop, Mobile handset, Power inverter, Socket, Compass, Global Positioning System GPS, and MapInfo digital maps. The Mobile handset and the laptop were equipped with TEMS Drive Test software for data collection.The compass helps to determine the various azimuth angles of the BS transmitters. Average height of BS antenna is about 30 – 45 meters above ground level, with comparatively same transmit power. In all the study locations, BS was equipped three sectored antennas with inbuilt features, which enables them to radiate in three directions at 1800MHz. Location of the BS antenna was a parameter for site selection.
With the aid of testing Sony Ericson mobile handset running on the TEMS software mode, calls were initiated at each test point until it is established and the RxLev (receivedlevel) based on field strengthinformation displayed on the MSterminal were read along the selected routes which cover main roads, public access and hot spot areas. The RXLev is the parameter that determines the received signal strength (RSS) at the MS terminal and it is one of the most significant radio signal parameters of radio coverage that can be measured forUMTSperformance verification and evaluation (see table 1). Seven locations, namely location 1, 2, 3, 4, 5, 6 and 7 were randomly chosen for this study and depended on the accessibility of the testing to a particular location. At each data location, the testing vehicle was displaced slowly at a distance of 5m˷10m before data being collected. By moving the testing vehicle slowly between 5m˷10m, the fast fading effect is eliminated from the collected data [19]; meaning that the collected measured data only show signal attenuation loss and shadow fading components. All measurements were taken in the mobile active mode and in three sectors of each base station. This was to ensure that the mobile phone was in constant touch with the base station.
IV. RESULTS AND DISCUSSION
ISSN(E): 2277-128X, ISSN(P): 2277-6451, pp. 74-83
Figure 2: A summary of signal performance using frequency tables
Table 1: Legend of Received Signal Strength (RSS) at the MS terminal (source: [20]) Signal Strength Value Signal Strength range (dBm) Classification (Coverage)
0…6,99 101 or lower Insufficient
7…11,99 -100 ... -91 Weak
12…16,99 90… -81 medium
17…31,99 -80 or higher Good
99 - Unknown
Table 2: Classification by Frequency tables
Location 1 Location 2 Location 3 Location 5 Location 6 Location 6 Location 7
Valid Freq % Freq % Freq % Freq % Freq % Freq % Freq %
Good 83 73 72 53 32 30 8 6 105 91 116 98 87 85
medium 29 27 46 40 72 70 81 65 11 10 5 2 16 1
Weak 0 0 8 7 0 0 35 29 0 0 0 0 0 0
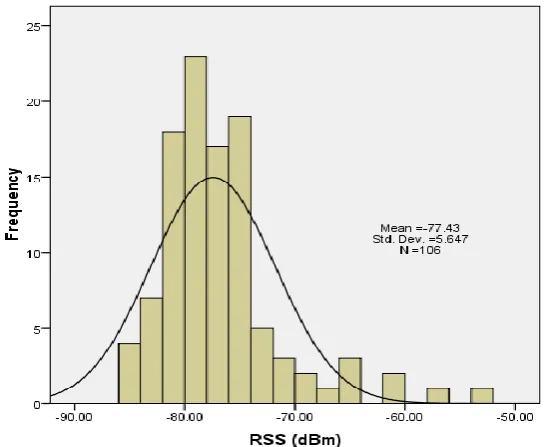
Descriptive statistics histograms of measured signal coverage data with fitted lognormal or Gaussian distribution in each study locations is shown Figs.3-9 and summarized in table 3. In evaluating the minimum field strength, a value of -95 dBm was observed in locations 2 and 4 which are lower than the reference of -92 dBm for perfect reception at the end user mobile terminal. Notice the variation of field strength per measurement point and this can be attributed to shadow fading and attenuation present around the test sites.
Fig.3: Histogram of observed RSS (dBm) versus normal distribution with µ =-77.43 and σ =5.65 in location1
0 20 40 60 80 100 120
Location 1 Location 2 Location 3 Location 4 Location 5 Location 6 Location 7
Si
gna
l C
ov
er
ag
e
perf
or
m
ance
(%
)
Site Locations
ISSN(E): 2277-128X, ISSN(P): 2277-6451, pp. 74-83
Fig. 4: Histogram of observed RSS (dBm) versus normal distribution with µ =-78.73 and σ =9.89 in location 2
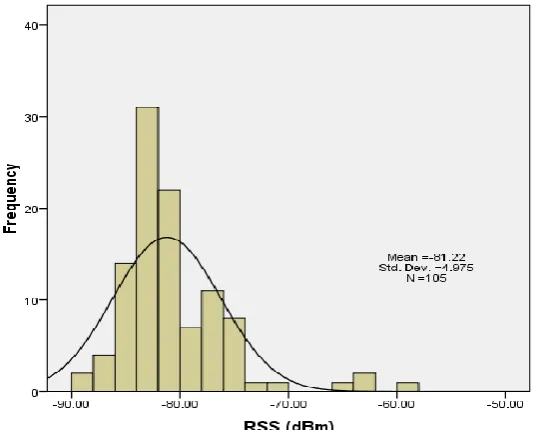
Fig.5: Histogram of observed RSS (dBm) versus normal distribution with µ =-81.22 and σ =4.97 in location 3
ISSN(E): 2277-128X, ISSN(P): 2277-6451, pp. 74-83
Fig. 7: Histogram of observed RSS (dBm) versus normal distribution with µ =-76.16 and σ =4.18 in location 5
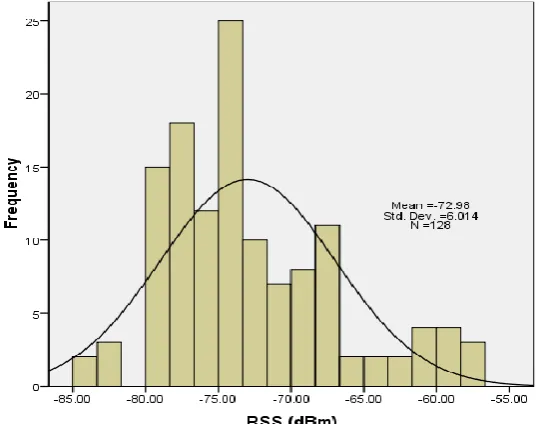
Fig.8: Histogram of observed RSS (dBm) versus normal distribution with µ =-72.96 and σ = 6.01 in location 6
ISSN(E): 2277-128X, ISSN(P): 2277-6451, pp. 74-83
The data for the study as captured at different locations designated as location 1, location 2…location 7. Shown in table 2are calculated mean, the minimum and the maximum signal strength levels at each location. The results in table shows that, mean signal strengths in each investigated locations are above the reference level of -93dBm for perfect reception, except in locations 2 and 4.
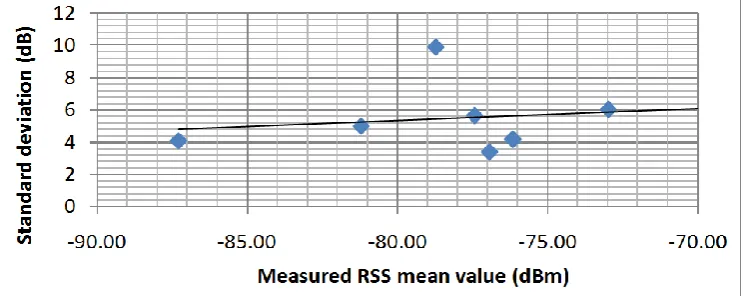
Standard deviations, fade margin, coverage reliability and outage probability were calculated and presented in table 3. It is observed that the standard deviation is ranged between 3.37 dB and 9.89 dB. Figure 10 depicts a plot of standard deviation with mean signal levels at each measurement locations. It basically represents how the signal strength level values spread (log-normally distributed around the mean value) in each measurement locations. So, the standard deviation would vary by clutter type in different signal propagation environment. Assuming a dense urban terrain, clutter type would more often than not have a higher standard deviation levels than the suburban or open clutter types. This is due to the highly obstructive properties encountered in an urban environment that in turn will produce higher standard deviation to mean signal strengths than that experienced in anopen area.
Fig.10: Standard deviation as function of mean signal strength
An outage probability of ≤ 5% and coverage probability of ≥ 90%-95% is usually allowed in wireless networks. Table 3 shows the results of the coverage probability and outage probability for the various cell locations considered in this paper. It is evident in table 4 that the quality of radio signals of mobiles at the cell edgeis very poor in locations 2 and 4, as they recorded poor coverage probability performanceof 89.25% and 81.72% and hence high outage probability performance of 10.74% and 18.28% respectively.It is also observed in table 3that the smaller the fade margin, the higher the outage probability and the lower the coverage reliability(see figure 11). This implies that the smaller the fade margin, the smaller the received signal strength at the MS and the more likely outage events.Hence, sufficient signal strength is needed at the mobile terminal in order to achieve the outage probability and coverage reliability required to effectively operate cellular communication networks. In other words, the MS must have a good signal level to access the network. Therefore, for effective network design, the knowledge of these parameters is needful to aid system designers in link budget calculation. This type ofknowledge can also help to guide the network designersto determine the required fading margin
Table 3: Received Signal Strength Statistics in each Study Locations
Table 4: Coverage Reliability/ Outage Probability Parameters in each Study Locations
Parameter Location 1 Location 2 Location 3 Location 4 Location 5 Location 6 Location 7 Standard.
Deviation 5.65 9.89 4.97 4.10 4.18 6.01 3.37
Fade Margin 13.57 12.27 9.78 3.71 14.84 18.02 14.07
Parameter Location 1 Location 2 Location 3 Location 4 Location 5 Location 6 Location 7 Mean received signal
strength (dBm) -77.43 -78.73 -81.22 -87.29 -76.16 -72.98 -76.93
Minimum received
signal strength (dBm) -86.0 -95.0 -89.0 -95.0 -84.0 -84.0 -85.0
Maximum received
signal strength (dBm) -54.0 -43.0 -60.0 -78.0 -59.0 -57.0 -66.0
ISSN(E): 2277-128X, ISSN(P): 2277-6451, pp. 74-83
Cell edge
Reliability 0.99 0.89 0.97 0.81 0.99 0.99 0.99
Outage
Probability 8.14E-03 1.07E-01 2.46 E-02 1.18 E-01 1.94 E-04 1.37 E-03 1.49E-05
Fig.12: Coverage Probability versus fade margin
V. CONCLUSION
Network coverage problems remain one of important issues for the mobile cellular communication service providers. The study was carried out to identify some problematic BS site locations using statistical descriptive analysis in an established UMTS network, operational in Ikoyi area of Lagos State, Nigerian The results shows that the quality of radio signals at the cell edge in locations 2 and 4 is weak, as they recorded poor coverage probability performance of 89.25% and 81.72% and high outage probability performance of 10.74% and 18.28% respectively. It is also observed that the smaller the fade margin, the higher the outage probability and the lower the coverage reliability. These are locations within the coverage area or at the outskirts of the coverage area where the propagated signal is not good enough for perfect reception at the mobile terminal. Therefore, the GSM network operator should take action to deploy new cell or adjust the antenna tilts/azimuth of existing cells, among others things for adequate reception signal coverage at the mobile terminals in the specific cell locations.
In future work, we will look out to evaluate the entire cell area reliability, which is is often more useful than edge reliability.
REFERENCES
[1] T. Tonteri; A Statistical Modeling Approach to Location Estimation Helsinki, Master's Thesis Department of Computer Science, Faculty of Science, University of Helsinki, 2001.
[2] https://en.wikipedia.org/wiki/GSM, accessed 13/12/2015.
[3] S. Bouzouki, J.Panaoutsopoulos, C. Ioannous, S. Kotsopoulos and C.Soras; Coverage Probability Verification for Cells in Urban Radio Networks Planning, http://www.Scribd.com/doc/63488630/coverage-probability. [4] http://shodhganga.inflibnet.ac.in/bitstream/10603/1223/11/11_chapter%202.pdf
[5] P.Bernardin and T. ellis; Cell Radius Inaccuracy: A New Measure of Coverage Reliability IEEE Transactions on Vehicular Technology, Vol. 47, No.4, pp. 1215-1226, 1998.
[6] J. Isabona, and Peter I. G. Benchmarking Mobile Network Quality of Service with Essential Key Performance Indicators: A Case Study of Operational GSM Telecom Operators in Nigeria. Conference Proceedings of Nigerian Institute of Physics, 2014.
[7] J. Isabona, Maximising Coverage and Capacity with QOS Guarantee in GSM Network by Means of Cell Cluster Optimization, International Journal of Advanced Research in Physical Science (IJARPS) Vol. 1, Issue 6, pp. 44-55, Oct. 2014.
[8] 3GPP TR 36.806 V9.0.0 (2009-12)
[9] D. Kotz, C, Newport, R. Gray, J, Liu, Y, Yuan, andC, Elliott, Experimental Evaluation of Wireless Simulation Assumptions. In Proc. the 7th ACM international symposium on Modeling, analysis and simulation of wireless and mobile systems (MSWiM’04), Venice, Italy, pp. 78–82.Oct. 2004;
[10] T. Rappaport, Wireless Communications: Principles and Practice, 2nd ed.; Prentice Hall PTR: Indianapolis, IN, USA, 2001.
0 50 100
1 2
3 4
5 6
7
C
ov
e
ra
ge
p
rob
ab
ili
ty
(
%
)
ISSN(E): 2277-128X, ISSN(P): 2277-6451, pp. 74-83
[11] T, Stoyanova, F, Kerasiotis, A, Prayati, A and G, Papadopoulos, A practical RF Propagation model for Wireless Network Sensors, Third international Conference on Sensor Technology and Applications, IEEE Computer Society, 2009.
[12] The Network Simulator: ns-2. Available online:http://isi.edu/nsnam/ns/.
[13] Kim, J, Kim, S and Choi K (2009) A New RBC handover scheme for LTE-R system, Journal of International Council on Electrical Engineering, vol. 4, No.3, pp. 243-250
[14] J. Isabona and C.C. Konyeha; Urban Area Path loss Propagation Prediction and Optimisation Using Hata Model at 800MHz Journal of Applied Physics (IOSR-JAP), Vol.3, (4), pp. 08-18, 2013.
[15] J. Isabona, C. C. Konyeha, C. B. Chinule. and I.G. Peter Radio Field Strength Propagation Data and Pathloss calculation Methods in UMTS Network, Advances in Physics Theories and Applications, vol. 21, pp. 54-68, 2013.
[16] C. Umit Bas and S.C. Ergen; Spatial-temporal Characteristics of Link Quality in Wireless Sensor networks, IEEE wireless Communication and Networking conference (WCNC) pp. 1152-1152, 2012.
[17] T.I,Adebayoand F.O, Edeko, Characterization of Propagation path loss at 1.8GHz: A case Study of Benin City, Nigeria. Research, Journal of Applied Sciences, vol. 1 (1-4), PP. 92-96, 2006.
[18] Rautiainen,T, Varying Path loss and Delay Spread predictions of a 3D ray tracing Propagation model in Urba n Environment. Institute of Electrical and Electronics Engineers (IEEE), 2001.
[19] W.C.Y, Lee,Mobile Communication Design Fundamentals, 2nd Edition, John Wiley and Sons: New York, 1992. [20] S.Savas, N, Topaloglu, and B, Ciylan, B Analysis of Mobile Communication Signals with Frequency Analysis
![Figure 4: A typical cellular scenario ([4])](https://thumb-us.123doks.com/thumbv2/123dok_us/7807428.2085367/2.595.188.411.90.296/figure-a-typical-cellular-scenario.webp)