STUDIES ON THE ROLE OF EARTHWORMS IN
BIOREMEDIATION OF MOTOR OIL
Safwat H. Shakir Hanna
[a]*, Irvin W. Osborne-Lee
[a], Elisha Taiwo Ahlinvide
[a]Keywords: Bioremediation technology, Earthworms, oil spills.
This study focuses on the bioremediation of soil contaminated with motor oil. Laboratory investigations were conducted to determine the ability of macro-organism's (i.e., earthworms) survival in soil contaminated with motor oil, and the role of macro-organisms in the contaminated soil (i.e., exposure to high toxicity in the soil). The soil was contaminated with two types of car motor oil, one with used motor oil from cars and the second was the pure car motor oil (i.e. was not used prior) in different concentrations [0% (i.e. control), 1 %, 3 %, 5 % and 10 % by weight contamination]. The soil parameters such as soil moisture %, carbon %, nitrogen %, pH, Eh, organic matter (OM) % and C/N ratio, were measured before and after contamination. Water content was maintained during incubation by making additions as determined from reweighed containers. Four worms (Lumbricus terrestris) were inoculated in each jar of the experiments. The length of the experiments was 30 days. The data of earthworms’ survivability were measured each day. Motor oil content between 1-5 % was not harmful to the survival of earthworms for 30 days but oil concentration of 10 %, increased mortality rate by 75 % in pure motor oil and 45 % in used motor oil. Further, there was a significant difference in survivability of earthworms in used and pure motor oil. Used motor oil can support the survivability of earthworms better than pure (i.e. unused motor oil) motor oil. The properties of the soil at the end of the experiment showed an average reduction of 5 % carbon content, which indicated that the earthworms could consume the organic carbon with the support of micro-organisms in their digestive system. It was concluded that macro-organisms could be used for soil cleanup and restoration but that, Soil contamination of motor oil above 5 % might not allow for a similar process.
*Correspondent author:
E-Mail: [email protected]
[a] P.O. Box 235, Texas Gulf Coast Environmental Data (TEXGED) Centre, Chemical Engineering Department, Prairie View A&M University, Roy G. Perry, College of Engineering, Prairie View A&M University, The Texas A&M University System] Prairie View, TX 77446, USA.
Introduction
Oil bioremediation technology is the most important technique that can avoid the oil spills‘ pollution and damages to the ecosystem and environment.The pollution by oil and the contamination of soils by motor oil pose a threat to the environment, and the remediation of oil-contaminated soils and water being a major challenge for environmental
research.1 Bioremediation is a useful method for soil
treatment and restoration If motor oil contamination of the soil is moderate and non-biological methods are not
economical.1 Contamination of soil can occur through
oil-tanker accidents, production spill, thoughtless actions of the
increased number of automobiles on our roads,
transportation of petroleum products, drilling activities on oil production sites and those emerging through accidental discharge,1 etc. It is difficult to transport, store, or refine
crude oil without spills and losses, and to prevent spills resulting from routine changing of motor oil or automobile crashes. The soil suffers the most ecological damage in the contaminated areas of the environment. There are high chances for a significant increase in soil and groundwater contamination at petroleum refineries.
Motor oil is one of the most common contaminants
endangering both aquatic and terrestrial ecosystems.1 Soil
contaminated sites are a legal requirement in the United States of America (USA) and most countries around the
world.2
Motor oil is lubricating oil consisting of base lubricating oil, which is a mixture of hydrocarbons about 80 – 90 % by
volume2 and performance additives, which make up the
remaining 10 – 20 %.2 The use of this oil in motor engines
alters the composition greatly due to break down of additives, introduction of metals through the wear and tear of the engine, and contamination resulting from combustion. Therefore, the components of motor oil after use vary greatly according to usage and degree of wear of metals within the lubricated area. Although the components of pure motor oil can be determined, it varies slightly from brand to brand. The major components of the used motor oil are aliphatic and aromatic hydrocarbons such as alkanes,
cycloalkanes, naphthalene, phenol fluoranthene,
benzo(a)pyrene, and benz(a)anthracene and high levels of
heavy metals such as Pb, Zn, Cu, Cr, Ni, and Cd.2,3
The need to remediate contaminated site has introduced new technologies that emphasize the detoxification and destruction of the contaminants rather than the conventional
approach of disposal.4 The primary factor controlling the
extent of biodegradation is the molecular composition of the petroleum contaminant. Multiple ring cycloalkanes are hard to degrade, while polynuclear aromatic hydrocarbons display varying degrees of degradation. Straight-chain alkanes biodegrade rapidly with branched alkanes and single
saturated ring compounds degrading more slowly.4
heavy oils. The rate of spreading and ultimate thickness of the oil slick will affect the rates of the other weathering
processes.5 To cleanup a contaminated site, the contaminant
will have to be determined; its degree of hazard to the environment assessed, and the best choice of remediation determined and applied.
The present paper has the following objectives:
1) Earthworms would remediate the oil-contaminated soil;
2) There is concentration range suitable for
earthworms‘ survival, and
3) The productivity of the earthworms will decrease with the increased percentage of motor oil contamination.
Materials and Methods
Experimental design
Microcosm experiment (oil, soil, and earthworms): In
order to achieve the research goals, we have used the
microcosm.6 An experimental approach to investigate the
impact of the used motor oil and unused motor oil (i.e. pure oil) on the survivability of earthworms in the motor oil contaminated soil.
Surface horizon soil was collected from the Prairie View A & M farm in Waller County. The soil had grass growing on it, suggesting the absence of pesticide. The soil was a brown loamy fine sand, single grained; loose common fine roots; strongly acidic; clear smooth boundary with a pH of 4.5.
In this respect, set of jars (about 100 jars) were used in the experiment and these jars were 370 mL glass canning jars that were 6 cm diameter and 13 cm tall. These jars were divided to two sets: one set was about 50 jars to be used with used motor oil that was extracted from cars, and the other set was about 50 jars to be used with pure motor oil.
The used motor oil and the pure motor oil are from Castrol Brand (SAE 10 W- 30) - Partial Synthetic Oil). The pure motor oil used was newly manufactured lubricating motor oil design to lubricate, clean, inhibit corrosion, improve
sealing and cool the engine.7 It is comprised of
petroleum-based and non-petroleum synthesized chemical compounds and blended using base oils composed of hydrocarbons,
poly(alpha-olefins) (PAO), and polyinternal olefins8 (PIO),
which are made up of entirely carbon and hydrogen. Motor oil has heavy hydrocarbons in the range of 18-34 carbon
atoms per molecule,9 and is also characterized by other
properties such as viscosity SAE, additives like detergent and dispersants additives, alkaline additives, and corrosion inhibitors.
The used motor oil was crankcase oil obtained through the oil change. The used motor oil contains petroleum and non-synthesized chemical compounds, blended with base oils
composed of hydrocarbons. The used motor oil contains metals derived from lubricating the engine. This new composition of the motor oil contains benzo[a]pyrene which
is known for carcinogecity.10
The experimental procedure is designed by using two sets of fifty jars were divided into five groups, each group with
its percentage concentration of motor oil. The
concentrations of motor oil in these jars were 0 % (i.e. control experiment without contamination of motor oil), 1 %, 3 %, 5 % and 10 % soil contaminated on a soil dry weight basis, and the motor oil used and unused (i.e. pure) was thoroughly mixed with the soil. The water content was maintained at 25 % soil moisture content on soil dry weight basis. Water content was maintained during incubation by making additions as determined by reweighing the containers.
Four earthworms (Lumbriscus terrestris) were used in
each jar (the average weight of the worm is between 2 to 4 grams each approximately) in this investigation. The reason for using this species is because it is a deep burrowing earthworm and would likely have higher exposure to oil in the soil. The jars were kept in an incubator at 20 °C as
recommended by Kula and Larink.11,12 The number of viable
earthworms was determined after 5, 10, 15, 20, 25, and 30 days.
After, the completion and at the end of the experiment, soil samples were analyzed for testing the organic matter
(OM %), pH, nitrogen content %, carbon content %, and Eh.
In this respect, organic matter was determined through using
the loss on ignition.13 This method is used to determine the
organic matter by drying the soil at 105 oC, and then
weighted. The weighed crucible of dried soil, is heated in a furnace for a period of time up 16 hours at the temperature
of 450 oC. The difference in weight of the soil before
burning in furnace and after burning is used to determine the organic matter of the soil. According to this method, the calculation of carbon % is that of the organic matter multiplied by 0.58 to determine the carbon percentage from the organic matter.
For nitrogen determination, we used the Lecoo instrument Fp 528. The soil sample was weighted in the of range 0.2-0.29 gm and measured against the standard such as the soya flour with 8.84% and EDTA with 9.56 % nitrogen.
pH Analyses were conducted using the Accumet 1003 series pH meter model from Fishers scientific. The soil samples were weighted about 20 g of soil and added to it 40 g of distilled water. Then the soil samples were stirred for approximately 30 minutes in order to assure the uniformity of soil solution, and then the pH values were measured after standardizing the pH meter with pH 4.0, 7.0 and 10 buffer standard solutions (Fisher Brand SB 101-500, SB 107-500
and SB115-500). At the same time, we used the pH/Eh
meter to measure the redox-potential of soil. The measured parameters were collected in order to measure the impact of these parameters on earthworms survivability in the
Data analysis
The experimental design was completely randomized, with a factorial arrangement of treatments. The data were submitted to two-way analysis of variance for statistical
comparisons. SPSS,14 SAS,15 SYSTAT,16 Sigma-Plot.17,18
Software was used in the analysis. Additionally, sometimes the data were transformed using log and cosine functions in order to smooth the data and to reduce the variability as
explained by.19,20
Results and Discussion
Environmental factors
The detailed data regarding environmental factors that were collected from the soil before the contamination of the soil and after the contaminations of soil with motor oil with different concentration levels at the beginning of the experiment were recorder in Tables 1-4. At the end of the experiment, the data of environmental factors were also recorded in Tables 5 and 6. The pH of the soil sample before the contamination of soil with motor oil used and pure before the commencement of the experiment was acidic averaged at 4.5 and 4.9 for the used and pure respectively (Table 7). This acidity was reduced after the contamination of the soil with motor oil, to 5.5 and 5.4 respectively for used and pure motor oil (Table 2). The increase is due to the alkalinity of the motor oil tending to neutralize the acid.
Table 1. Average mean physio-chemical parameters in the sampled soil (50 samples) before the addition of motor oil in experiment
Oil Type
pH Eh Om% C% N%
U 4.59 183.4 0.029 0.017 0.046
P 4.93 180.9 0.029 0.017 0.046
(U is used motor oil and P is pure motor oil- Ehis in millivolt)
Table 2. Average physiochemical parameters in the sampled soil (50 samples) after the addition of motor oil
Oil Type
pH Eh Om% C% N%
U 5.51 156.1 0.152 0.088 0.067
P 5.43 143.4 0.215 0.124 0.123
(U is used motor oil and P is pure motor oil- Eh isin Millivolt)
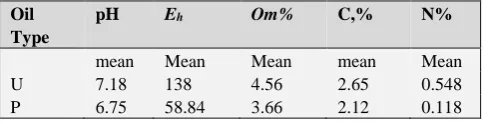
Table 3. Average physio-chemical parameters in the sampled soil (50 Samples) at the end of experiment with motor oil,
Oil Type
pH Eh Om% C,% N%
mean Mean Mean mean Mean
U 7.18 138 4.56 2.65 0.548
P 6.75 58.84 3.66 2.12 0.118
(U is used motor oil and P is pure motor oil- Eh isin millivolt)
Improved greatly at the end of the experiment to 7.2 and 6.8 for the used and pure motor oil (Table 7). The increase at the end of the experiment is accounted for by the death and excretes of earthworms in the soil.
Organic matter of the sampled soil was 0.029 in the soil before the introduction of motor oil. The organic matter increased in the range of 1.0- 9.5 for the used motor oil and 0.68 – 9.5 for the pure motor oil after contamination of the soil with motor oil. It also had a pH range of 0.38 – 9.0 for the used motor oil and 0.49-9.04 for the pure motor oil at the end of the experiment. The activities of the earthworm are assumed to have reduced the organic content by way of feeding on the soil and its constituents. And the rise in the organic matter in the used motor oil can be inferred that the remains of the dead earthworms had added to the soil organic matter. (Table 8).
The soil nitrogen of the sampled soil before the addition of motor oil was 0.046 for both set of experiment. The nitrogen content of the soil sample after contamination with motor oil had the range of 0.037 – 0.37 for the used motor oil and 0.76 – 0.84, with a mean of 0.19 for used and 0.13 for pure motor oil. The nitrogen value reduced at the end of the experiment for the used motor oil samples but increased for that of the pure motor oil (Tables 4-6). In this respect, there was an overall improvement in the soil physiochemical properties in mixing motor oil with soil.
The soil Eh is between 183 – 120 for the used motor oil
and 180 – 64 for the pure motor oil. The soil redox potential is an electrical measurement that shows the tendency of a soil solution to transfer electrons to or from a reference electrode. From this measurement we can estimate whether the soil is aerobic, anaerobic, and whether chemical compounds such as Fe oxides or nitrate have been
chemically reduced or are present in their oxidized forms.21
Earthworms Survivability
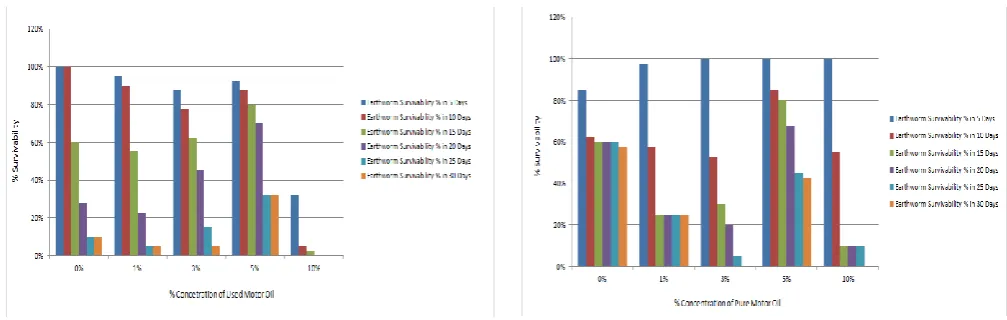
The survival of earthworms in the studies of earthworms in both used and pure motor oil had the best of survivors in the 5 % concentration.Though the death of the earthworms in concentrations 0, 1, and 3% concentration did not follow the expected pattern and of course as seen on Figures 1 and 2, and Tables 9 and10, they were more death recorded in these concentrations than they were in concentration with 5% motor oil. This implies that factors other than those of motor oil concentration were responsible for the dead of earthworms in concentration 0, 1, and 3 %, because the earthworms survived very well in 5 % concentration of the motor oil. In 10 % concentration of the motor oil both in used and pure motor oil the earthworms could not survive as much, about 50 % of the earthworms were dead by the 5th day of the studies.
Survival of earthworms ‘Lumbricus terrestris was
Table 4. Average physiochemical parameters in the sampled soil before addition of motor oil (Number of samples =10)
Treatment Oil type pH Eh OM C% N% Nml
T1 U 4.38 189 0.500 0.290 0.056 0.028
T2 U 4.75 180 0.620 0.359 0.047 0.023
T3 U 4.55 186 0.500 0.290 0.068 0.034
T4 U 4.62 185 0.519 0.302 0.044 0.021
T5 U 4.69 182 0.619 0.359 0.042 0.020
T1 P 5.32 173 0.498 0.289 0.056 0.028
T2 P 4.95 181 0.614 0.356 0.047 0.023
T3 P 5.05 186 0.496 0.288 0.044 0.022
T4 P 4.92 185 0.673 0.391 0.044 0.021
T5 P 4.69 182 0.611 0.354 0.042 0.020
U=used motor oil, P=pure motor oil, T1=control, [T2=1%, T3=3%, T4=5%, T5=10% percentage of oil added] and Eh is in millivolt
Table 5. Average physio-chemical parameters in the sampled soil after the addition of motor oil used (U) and pure (P)
Type of Treatment Oil type pH Eh OM C% N% Nml
T1 U 5.63 137 1.007 0.584 0.099 0.035
T2 U 5.04 121 2.077 1.205 0.069 0.032
T3 U 4.24 350 5.073 2.943 0.068 0.034
T4 U 6.03 109 5.161 2.994 0.064 0.029
T5 U 6.06 104 9.498 5.509 0.044 0.026
T1 P 5.73 137 0.678 0.393 0.154 0.036
T2 P 5.40 151 2.291 1.328 0.094 0.025
T3 P 5.41 143 4.030 2.337 0.154 0.021
T4 P 5.40 145 6.530 3.788 0.124 0.031
T5 P 5.35 135 9.214 5.344 0.107 0.024
U=used motor oil, P=pure motor oil, T1= control, [T2=1%,, T3=3%, T4=5%, T5=10% of oil added] and Eh is in millivolt
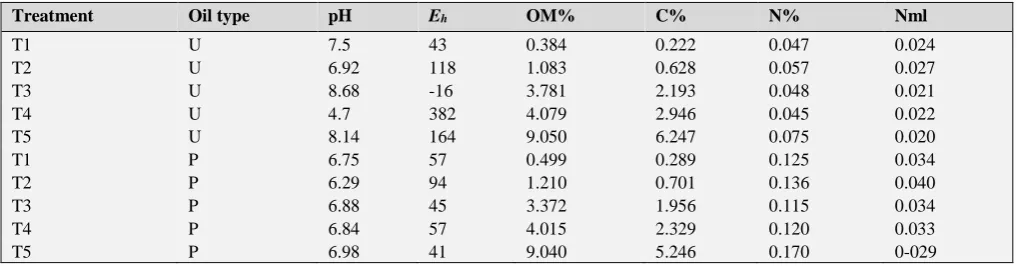
Table 6. Average physio-chemical parameters in the sampled soil at the end of experiment with motor oil used(U) and pure (P)
Treatment Oil type pH Eh OM% C% N% Nml
T1 U 7.5 43 0.384 0.222 0.047 0.024
T2 U 6.92 118 1.083 0.628 0.057 0.027
T3 U 8.68 -16 3.781 2.193 0.048 0.021
T4 U 4.7 382 4.079 2.946 0.045 0.022
T5 U 8.14 164 9.050 6.247 0.075 0.020
T1 P 6.75 57 0.499 0.289 0.125 0.034
T2 P 6.29 94 1.210 0.701 0.136 0.040
T3 P 6.88 45 3.372 1.956 0.115 0.034
T4 P 6.84 57 4.015 2.329 0.120 0.033
T5 P 6.98 41 9.040 5.246 0.170 0-029
U=used motor oil, P=pure motor oil, T1=control, [T2=1%, T3=3%, T4=5%, T5=10%] %=percentage of oil added, Eh is in millivolt
Table 7. The comparison of pH in the three stages of the experiment
Concentration Stage 1 (P) Stage 1 (U) Stage 2 (P) Stage 2 (U) Stage 3 (P) Stage 3 (U)
0% 5.32 4.38 5.73 5.63 6.75 7.50
1% 4.95 4.75 5.40 5.04 6.29 6.92
3% 5.05 4.55 5.41 4.24 6.88 6.68
5% 4.92 4.62 5.40 6.03 6.84 4.70
10% 4.95 4.69 5.35 6.06 6.98 8.14
Stage 1 means test before introducing motor oil, Stage 2 means test with motor oil, Stage 3 means test at the end of experiment U=used motor oil P=pure motor oil.
Table 8. Comparison of organic matter in the three stages of the experiment
Concentration Stage 1 (P) Stage 1 (U) Stage 2 (P) Stage 2 (U) Stage 3 (P) Stage 3 (U)
0% 0.5 0.5 0.7 1.0 0.5 0.4
1% 0.6 0.6 2.3 2.0 1.2 1.1
3% 0.5 0.5 4.0 5.0 3.4 3.8
5% 0.7 0.5 6.5 5.2 4.0 4.1
10% 0.6 0.6 9.2 9.5 9.0 9.1
Stage 1 means test before introducing motor oil Stage 2 means test with motor oil.Stage 3 means test at the end of experiment U=used motor oil P=pure motor oil
At 5% used motor oil concentration had survivors of 100% in the day 5, 85% in the day 10, 80% in the day 15, 68% in the day 20, 45% in the day 25, and 43% in the day 30.Concentrations, 0% (control), 1% and 3% had percentage survivors lower than those of 5 % percent concentration. 0 % had 85, 63, 60, 60, 60, and 58 %, 1 % had 98, 58, 25, 25, 25, and 25 %, while 3 % had 100, 53, 30, 20, 5, and 0 %, in days 5, 10, 15, 20, 25, and 30, respectively. The earthworms‘ survival did not follow gradual decrease with increase in the concentration of the motor oil as expected but showed a drastic decrease in 10% oil concentration.
Figure 1. Graph of percentage of earthworm survivability against used motor oil as % of concentration
The second experiment with pure motor oil recorded a greater survivability, with 93 % in the day 5, 88 % in the day 10, 80 % in the day 15, 70 % in the day 20, 33 % in the day 25 and 33 % in the day 30. The survival of earthworms
in the experiment followed a similar pattern with the first. Concentration 0% motor oil had percentage survival of 100, 100, 60, 28, 10, and 10%, concentration 1 % had 95, 90, 55, 23, 5, and 5 %, and concentration 3 % motor oil recorded 88, 78, 63, 45, 15, and 5% in the day 5, 10, 15, 20, 25, and 30 respectively (Figure 2, Tables 9 and 10). The survivability went out of the expected pattern, though it followed the pattern similar to that of the experiment with used motor oil, having good survivors up to 5 % concentration. The earthworms could not survive in 10 % concentration beyond
the 5th day as 67 % were already dead by the 5th day.
Figure 2. Graph of earthworm survivability as % against pure motor oil as % of the concentration
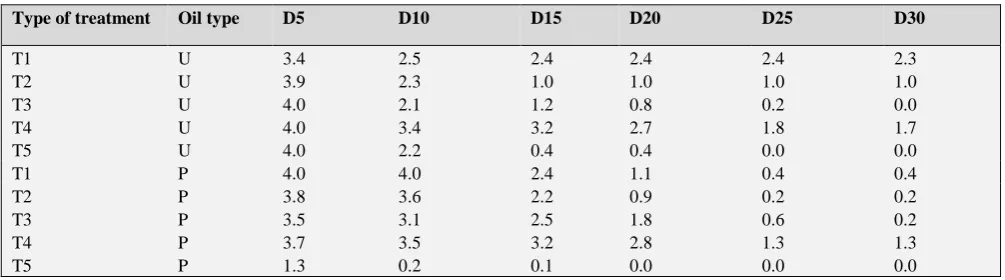
Table 9. Survivability average of earthworms in experiments with motor oil, used (U) and pure (P) at the end of the experiment in the individual.
Type of treatment Oil type D5 D10 D15 D20 D25 D30
T1 U 3.4 2.5 2.4 2.4 2.4 2.3
T2 U 3.9 2.3 1.0 1.0 1.0 1.0
T3 U 4.0 2.1 1.2 0.8 0.2 0.0
T4 U 4.0 3.4 3.2 2.7 1.8 1.7
T5 U 4.0 2.2 0.4 0.4 0.0 0.0
T1 P 4.0 4.0 2.4 1.1 0.4 0.4
T2 P 3.8 3.6 2.2 0.9 0.2 0.2
T3 P 3.5 3.1 2.5 1.8 0.6 0.2
T4 P 3.7 3.5 3.2 2.8 1.3 1.3
T5 P 1.3 0.2 0.1 0.0 0.0 0.0
U=used motor oil, P=pure motor oil, [T1= control, T2=1 %, T3=3 %, T4=5 %, and T5=10 % of oil added], D5=day 5, D10=day 10, D15=day 15, D20=day 20, D25=day 25, D30=day 30.
Table 10. Survivability of L. terrestris in experiment with used (U) and pure (P) motor oil after 30 days as %
Treatment Type Oil Type D 5 D10 D15 D20 D25 D30
T1 P 100% 100% 60% 28% 10% 10%
T2 P 95% 90% 55% 23% 5% 5%
T3 P 88% 78% 63% 45% 15% 5%
T4 P 93% 88% 80% 70% 33% 33%
T5 P 33% 5% 3% 0% 0% 0%
T1 U 85% 63% 60% 60% 60% 58%
T2 U 98% 58% 25% 25% 25% 25%
T3 U 100% 53% 30% 20% 5% 0%
T4 U 100% 85% 80% 68% 45% 43%
T5 U 100% 55% 10% 10% 10% 0%
U=used motor oil, P=pure motor oil, T1= control, [T2=1 %, T3=3 %, T4=5 %, T5=10 % of oil added], D5=day 5, D10=day 10, D15=day 15, D20=day 20, D25=day 25, D30=day 30.
pattern (Figures 1 and 2, and Table 9 and 10), they were more death recorded in contaminated samples with ten percent % concentration of the motor oil in both studies, while concentration with 5 % motor oil recorded the most survivors. This implies that factors other than those of motor oil toxicity were responsible for the dead of earthworms in concentration 0, 1, and 3 %, because the earthworms survived very well in 5 % concentration of the motor oil.
In 10 % concentration of the motor oil both in used and
pure motor oil, the earthworms could not survive as much,
about 50 % of the earthworms were dead between the 10th
day and the 15th day of the studies as a general observation.
This means the death of earthworms is caused by the toxicity of motor oil.
The tree diagrams showed similarities in the oil-type and various concentrations (Figures 3 and 4).
In Figure 3, The survival of earthworms in used motor oil had two groups, day five (D5) and day ten (D10) with high survivors, and day fifteen (D15), day twenty (D20), day twenty five (D25) and day thirty (D30) with high fatality (Figure 3).
A comparison between the number days D5 and D10, D15, D20, D25 and D30 and the concentration was plotted. The comparison of D5 with other concentrations and showed a clustered pattern with the only deviation emerging in 10 % concentration of motor oil. This pattern indicates a norm in or sustainable toxicity to the earthworms excluding the 10 % concentration; hence at 5 % concentration earthworms can be used to clean up a contaminated site.
In Figure 4, a pattern of survivability in pure motor oil is observed. There is a similarity between the survival of earthworms in day five (D5) and day ten (D10), and also between day fifteen (D15) and day twenty (D20) of the experiment.D5 and D10 had a higher degree of survival than D15 and D20. But the twenty-fifth day (D25) and the thirtieth day (D30) are further apart indicating a very low percentage of earthworm survival (Figure 4).
The survival of earthworms throughout the duration of the experiment was plotted but normalized such that, the equation would not be limited to a specific number of earthworms to be used in the experiment. In this case, the desired number of earthworms would be multiplied by one (1). With this parameter, the survivability was normalized in two equations, the exponential and the polynomial fit. It was found that the exponential fit is the closest to the normal measured data.
Figure 3. Similarity1 of survivability of earthworms in the soil contaminated with used motor oil
Figure 4. Similarity1 of survivability of earthworms in the soil contaminated with pure motor oil
Figure 5. Survivability of earthworms in 1 % of pure motor oil
1 scale is referred to the similarity distance in hierarchical clusters that are
displayed in a tree which is using Computes a normalized Euclidean distance (root-mean-squared differences) matrix for all the variables in variable list (i.e. days of the experiment as 5, 10, 20, 25, and 30).
The exponential form of normalized survivability is:
where a and b are fitting parameters, d is the percent
concentration and y is the number of days. From the
minimum mean square error fitting: a=1.3686, and b=
6.1489. The polynomial form is:
From the minimum mean square error fitting: a = 0.0213
Figure 6. Survivability of earthworms in 1% of used motor oil
Normalized survivability_
where a and b are fitting parameters, d is the percent
concentration and y is the number of days. From the
minimum mean square error fitting: a= 0.9480, and b=
2.1625.
Polynomial form_
From the minimum mean square error fitting: a = 0.02095.
Analysis of variance
One-way ANOVA analysis of earthworms’ survivability for the first 5 days in contaminated soil with pure and used motor oil showed significant difference between different
concentrations of motor oil % [i.e. F =13.12 and P<0.001
for pure motor oil type], and [i.e. F=4.19 and P<0.0057 for
used motor oil type] (Tables 11 and 12).
0 5 10 15 20 25 30
0 0.5 1 1.5 2 2.5
Number of days
N
or
m
al
iz
ed
S
ur
vi
va
bi
lit
y
Measured Data Polynomial Fit Exponential Fit
0 5 10 15 20 25 30
0 0.5 1 1.5 2 2.5
Number of days
N
o
rm
a
li
z
e
d
S
u
rv
iv
a
b
il
it
y
Measured Data Polynomial Fit Exponential Fit
exp(
)
s
a
bdy
/ (
)
s
a
dy
exp(
)
s
a
bdy
/ (
)
Figure 7. Survivability of earthworms in 10% of pure motor oil
Figure 8. Survivability of earthworms in 10% of used motor oil
However, the ANOVA Two-ways analysis for
earthworms’ survivability in different motor oil types at different concentrations % indicated that there are
significant results [i.e. F=16.33 and P<0.001 for motor oil
type] and [i.e. F=9.54 and P<0.001 for motor oil
concentrations]. However, the impact of the interactions between motor oil type and motor oil concentrations on the
earthworms‘ survivability showed significant results [i.e. F=
14.05 and P<0.001] (Table 13).
Table 11. ANOVA analysis for survivability of earthworms in contaminated soil with used motor oil (D5)
Source DF Sum of
Squares
Mean square
F
Value
Pr > F
Model 4 49.32 12.33 12.12 < .0001
Error 45 42.30 0.94 Corrected
Total
49 91.62
Table 12. ANOVA Analysis for survivability of earthworms in contaminated soil with pure motor oil (D5)
Source DF Sum of
Squares
Mean square
F Value Pr > F
Model 4 2.72 0.68 4.19 0.0057
Error 45 7.30 0.16
Corrected Total
49 10.02
One-way ANOVA analysis of earthworms’ survivability at the end of the studies (i.e. at 30 days in contaminated soil with pure and used motor oil) showed insignificant difference between different concentrations % of pure motor
oil type [i.e. F =2.37 and P<0.07], and significant difference
between different concentrations [i.e. F=6.34 and P<0.0004]
for used motor oil type (Tables 14 and 15).
Table 13. MANOVA analysis for survivability of earthworms in contaminated soil with motor oil types and interaction between oil type and concentration oil (D5)
Source DF Sum of
squares
Mean square
F Value Pr > F
Concent-ration
4 13150.0 3287.5 9.54 <0.00 01 Oil type 1 5625. 0 5625.0 16.33 <0.00
01 Oil type/
concent-ration
4 19375.0 4843.8 14.05 <0.00 01
However, the ANOVA two-ways analysis for
earthworms‘ survivability in different motor oil at different concentrations % indicated that there are significant results (i.e. pure and used motor oil [i.e. F=6.11 and P<0.01 for motor oil type] and [i.e. F=6.98 and P<0.01 for motor oil concentrations]. However, the impact of the interaction between motor oil type and motor oil concentrations on the earthworms‘ survivability showed significant results [i.e.
F=2.51 and P<0.05] (Table 16).
Table 14. ANOVA Analysis for Survivability of Earthworms in Contaminated Soil with pure motor oil (D30)
Source DF Sum of
Squares
Mean square
F
Value
Pr > F
Model 4 10.48 2.62 2.37 0.0664
Error 45 49.70 1.10
Corrected Total
49 60.18
Table 15. ANOVA Analysis for Survivability of Earthworms in Contaminated Soil with used motor oil (D30)
Source DF Sum of
squares
Mean square
F
Value
Pr > F
Model 4 41.80 10.45 6.34 0.0004
Error 45 74.20 1.65
Corrected Total
49 116.00
0 5 10 15 20 25 30
0 0.2 0.4 0.6 0.8 1 1.2 1.4
Number of Days
Table 16. MANOVA analysis for survivability of earthworms in contaminated Soil with motor oil types and interaction between oil type and concentration (D30)
Source DF Sum of
Squares
Mean square
F
value
Pr > F
Concentration 4 24025.00 6006.30 6.98 <0.0001 Oil Type 1 5256.30 5256.30 6.11 0.0153 Oil type
/con-centration
4 8650.00 2162.5 2.51 0.0471
Impacts of ecological factors on earthworms survivability
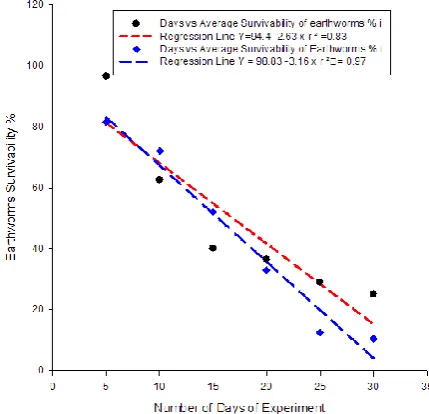
Earthworm survivability in contaminated soil with used and pure motor oil has shown variation in survivability due to the ecological parameters that prevailed in the experiment. In this respect, during the survivability test of earthworms in contaminated soil with used and pure motor oil (i.e. the one-month period of study) showed that the survivability of earthworms decreased from 100 % to 40 % during the first 15 days and declined until it reached 20 % at the end of the experiment (Figure 9).
Figure 9. Relationship between the number of days of the experiment and average earthworms survivability % in contaminated soil with used and pure motor oil
Earthworm’s survivability with respect to pH (Figure 10) showed the highest survivability rate at a pH (7.0) in contaminated soil with pure and used motor oil. There is a significant relationship between pH and the survivability of earthworms. In addition, it is found that the earthworm’s survivability decreased when the pH moved from neutral to alkaline (8-10).
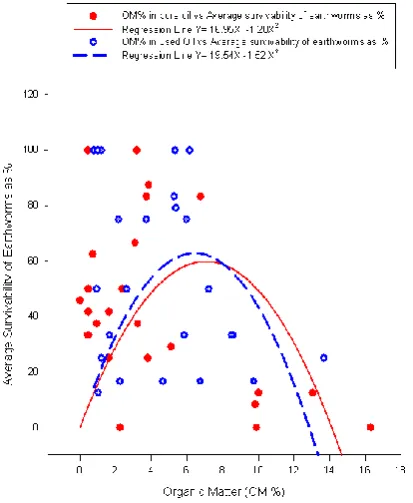
Earthworm’s survivability (Figure 11) increased when the OM% reached 6-8%. On the other hand, earthworms showed a significant decrease of the survivability when the organic matter increased more than 10% and this is related to the increase carbon % which impacted on its degradation by microbial organisms in the gut of the earthworms and has resulted in the degradation of these toxic materials and
heavy hydrocarbon. The present heavy materials of hydrocarbon in the motor oil have prevented the earthworms from its ability to degrade these compounds, and it is due to the lack of microorganisms that are able to degrade the hydrocarbon.
The earthworms showed a significant increase in survivability when the nitrogen percentage increased. Consequently, the increase of nitrogen has enhanced the ability of earthworms and the microbial organisms in the earthworms’ guts to decompose the heavy hydrocarbon materials in the motor oil (Figure 12).
Further, the survivability of earthworms with respect to concentration of motor oil showed an increase in survival as the concentration of motor oil increased up to 5% concentration and declined steadily after that (Figure13).
The earthworms showed increased survivability in the contaminated soil, with a rise in C/N ratio and its peak at a ratio of 50. A further rise in the C/N ration beyond fifty 50, affected the survival of earthworm as seen in the graph. The increase led to a rise in the toxicity of the soil and hence the inability of earthworms to survive (Figure 14).
Figure 10. The relationship between pH and average earthworms survivability % in contaminated soil with used and pure motor oil.
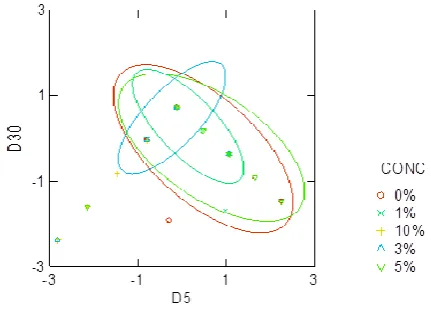
The above results are supported by the comparison of the day five D5 and the day D30 with the concentration T1-T5 as shown in Figure 16, in which it shows a cluster of the various concentrations with similarities in concentration 0, 1, 3 and 5 %. The 10 % concentration is completely off the scale.
Figure 11. Relationship between averages of earthworms’ survivability as % and organic matter (OM %) in contaminated soil with used and pure motor oil
Figure 12. Relationship between average earthworms survivability % and nitrogen % in contaminated soil with used and pure motor oil
A graphic representation model of the entire process was developed (Figure17). It is important in this experiment to present a visual model for a clear understanding of the processes by which earthworms deal with the decomposition of organic hydrocarbon materials in the soil. The diagram shows how the earthworms can improve the soil quality to
degrade these contaminants and convert it to fewer toxic substances and, to enhance the process of biodegradation through the combing activities of earthworms and the microorganisms in their guts or the digestive tract of earthworms.
Figure 13. Relationship between average earthworms survivability as % and motor oil concentration % in contaminated soil with used and pure motor oil.
Figure 14. Relationship between C/N ratio and average survivability of earthworm’s %in contaminated soil with used and pure motor oil
At the end of the experiment, the carbon content % of the soil samples was measured and recorded. The carbon content of the soil samples before and after the inoculations of the earthworm was recorded.
1 3
Figure 15. Relationship between average earthworms survivability % and soil carbon % in contaminated soil with pure and used motor oil
The percentage carbon reduction in each concentration, both pure and used motor oils are as follows: 1) In 0 % concentration, 26 % and 38 % in the pure and used motor oil respectively; 2) In 1 % concentration, 47 % and 47 % in the pure and used motor oil respectively; 3) 3 % concentration had 16 % and 25 %; in the pure and used motor oil respectively; 4), 5 % concentration recorded 38 % and 20 % in the pure and used motor oil respectively; and 5)10 % concentration recorded 1.8 % total reduction of carbon in the pure motor oil and 4.7 % total in the used motor oil. In
this respect, Daniel A. Vallero22 Indicated that the
earthworms could degrade pollutants into simpler, less toxic forms, while the organisms at the lower levels of the biological organization transform substances in the direction of mineralization, i.e. toward inorganic compounds (those that lack carbon-to-carbon and carbon-to-hydrogen covalent bonds), and that motor oil biodegradation can be enhanced and was accelerated from 55.9% to 64.4% by adding other micro-organisms. This result can support that the microorganisms that are existing in guts of earthworms can have accelerated influence in the decomposition of hydrocarbons in the motor oil, which is the case in the present study.
Metals have been shown to cause mortality23-26 and reduce
fertility,27, and growth28 of earthworms. Therefore, a higher
percentage survival of earthworms was expected in the pure motor oil than in the used motor oil due to the presence of toxic metals in the used motor oil, but the reverse was the case.
The cause of this unexpected result cannot be determined at this time. More studies are needed for this purpose to find out. The survival of earthworms in the contaminated soil was impacted on by the pH of the soil. As the pH increases the survivability also increases, and reached its peak at pH of 7 as seen on the graph (Figure 10).
The organic matter and carbon content of the soil also impacted the survival of the earthworms. The soil originally was very low in carbon and organic content, an unfavorable condition for the earthworms. But as both the carbon and organic content increased, the survivability of the earthworms also increased. The carbon and organic matter in the samples increased as the percentage of added motor oil increases. These increases eventually create a toxic environment for the earthworms which in turn reduces survivability for the earthworms.
Figure 16. Comparisons of D5 and D30 against T1-T52
Note: CONC means the different concentration %, D5 means survivability of earthworms in day 5 as a factor and D30 is the survivability of earthworms in day 30 of the experiment as a factor used in discrimination analysis. In this respect, the graph is representing two canonical variables as used by SYSTAT. The SYSTAT produces a canonical scores plot, in which the axes are the canonical variables, and the points are the canonical variable scores. This plot includes confidence ellipses for each group.
In the present research, an oil concentration of 10 %
reduced survival of Lumbriscus terrestris (Tables 9 and 10).
An oil concentration of 5 % did not reduce survival of
Lumbriscus terrestris and from the limited data of the
current study, it appears that Lumbriscus terrestris was
better off in the used, motor oil since Lumbriscusterrestris
survived 42 % for 30 days in 5 % usedmotor oil treatment
and 32 % for 30 days in 5 % pure motor oil treatment. It was
expected that Lumbriscus terrestris was going to survive
more in the pure motor oil than in the used motor oil, because used motor oil contains metals depleted from the crankcase of the engine and chemicals generated in the process. These properties of the used motor oil should have hindered the survival of the earthworm Lumbriscus terrestris.
As stated by Neuhauser and Hopkin.24 There are no
published studies on Lumbriscus terrestris for
bioremediation of motor oil to compare to my laboratory
2(T
1=0%, T2=1%, T3=3%, T4=5%, T5=10% Concentration of
results but Shakir Hanna and Weaver11 in their study on
earthworm survival in oil-contaminated soil, used
Lumbriscus terrestris. In this research, 17 % of Lumbriscus
terrestris survived at an oil concentration of 1.5 % for 7
days, and none survived to the 10th day. This result is not in
agreement with ours because 33 % Lumbriscus terrestris
survived in an oil concentration of 5 %, for 30 days in pure motor oil and 30 days for the used motor oil.The concentration of organic matter at the end of the experiment was less than before the experiment may have been due to earthworm’s activities on the soil. Bioremediation of motor
oil reduced toxicity to Lumbriscus terrestris.
Figure 17. Graphic diagram showing the impact of earthworms as a biological agent for remediation of motor oil contaminated soil
In conclusion, research work on the use of earthworm to remediate soil contaminated with motor oil needs expansion. The limited studies carried out by author, and others indicate that the type of oil, soil and species of earthworm all
influence the quantity of oil that can be tolerated in soil.29-30
Future investigations need to be done to determine the
toxicity of oil-contaminated soil on juvenile Lumbriscus
terrestris and effects on reproduction. In addition, the
influence of metals on earthworm needs to be addressed too.
Conclusions
There has not been much work on bioremediation using
earthworms Lumbriscus terrestris for soil clean-up. The
success of Lumbriscus terrestris in bioremediation is
achieved only if the concentration of the contaminated site
can be tolerated by the Lumbriscus terrestris in the soil. This
study is to determine the concentration of the motor oil that
the earthworms Lumbriscus terrestris can survive in, and
maintain its natural pattern of activities, which eventually results in the process of clean-up. Shakir Hanna and
Weaver11 in their study on earthworm survival in
oil-contaminated soil used Lumbriscus terrestris. In this
research, 17 % of Lumbricus terrestris survived at an oil
concentration of 1.5 % for 7 days and none survived to the
10th day. But in my investigation, 33 % Lumbriscus
terrestris survived in an oil concentration of 5 %, for 30 days in pure and used motor oil. Therefore it can be
concluded that Lumbriscus terrestris can survive in motor
oil contaminated soil for up to 30 days in a concentration of 5 % percent. At the end of the experiment, the carbon content of the soil samples were less than those before the
activities of Lumbriscus terrestris. This implies that
Lumbriscus terrestris can be used to clean-up the soil
contaminated with motor with concentrations between 0-5 % and might not support the clean-up of concentrations higher than 5% of the contamination of motor oil be it used or pure. More studies need be conducted to determine the cause of fatality of earthworms in the oil contaminated soil because obviously, there would be other reasons for the fatality of earthworms. Studies should be extended to
consider the accumulation of metals by not only Lumbriscus
terrestris but also other species in naturally contaminated soils. What is required to progress this field and to increase the use of studies in bioremediation using macro-organism (Lumbriscus terrestris) is to study the effects of metals on the earthworms, determine soil properties (which should include pH, organic matter content, soil texture, cation exchange capacity). Kinetic studies are of particular importance as will suggest how long studies should be performed in the laboratory and provide more useful toxicological information than more straight forward bioremediation studies. It is important that studies are tested on different soils; individual studies usually define relationships but do not test them independently. More studies are required that generate earthworm interspecies comparison ratios thereby allowing application of data
obtained for one species (and particular Lumbriscus
terrestris) to other species.
Lastly, attempts should be made to perform experiments
either in the field or terrestrial model ecosystems23 in order
that experimental constraints do not influence earthworm’s response. In particular, the different ecological niches that earthworms occupy cannot be expressed in laboratory studies performed closely following some laboratory protocols.
References
1Maike, S., Soren, P. O., Juliane, F., Effects of Lumbricus terresris,
Allolobophora chlorotica and Eisenia fetida on microbial community dynamics in oil-contaminated soil," Soil Biol. Biochem., 2005, 37, 2065-2076.
doi.org/10.1016/j.soilbio.2005.03.010
2Vazquez-Duhalt, R., Greppin, H., Biodegradation of used motor oil by bacteria promotes the solubilization of heavy metals.
Sci. Total Environ., 1986, 52, 109-121. https://doi.org /10.1016/ 0048-9697(86)90108-7
3Maugh, T. H. "Refined oil; an option that saves oil, minimizes pollution," Science, 1976, 193, 1108-1110.
4Wang, G. D., Chen, X. Y., Detoxification of soil phenolic pollutants by plant secretory enzyme, Phytoremediation, In: Methods in Biotechnology Series, Animal Cell Biotechnology, Methods and Protocols, Second Edition, Edited by John Walker, Humana Press, Totowa., 2007, 49-57. DOI:
5Driscoll, J. N., Hanby, J., Panaro,J., Calabrese P. T., J. B. E., Review of Field Screening Methodology for Analysis of Soils. Hydrocarbon Contaminated Soils. 2. Boca Raton: Lewis Publishers, Boca Raton, 1992, 2, 153–171.
6http://en.wikipedia.org/wiki/Microcosm_(experimental_ecosystste
m).
7Peake, E., Parker, K., Polynuclear aromatic hydrocarbons and the mutagenicity of used crankcase oil, In: Chemistry and Biological Effects, P. A. H. in A. Bjorseth and J. Dennis (Eds..), Ed. Columbus, OH, Battelle Press, 1980, 1025-1039.
8Stewart, R. G., Helm, J. L., The lubricant market in the 1980s. The US and the free world (AM-80-25), National Petroleum Refiners Association, Washington, DC, U.S.A., 1980.
9National Petroleum Refiners Association, 1981 Report on U.S.
lubricating oil sales, Washington, DC, U.S.A.
10Ismailov, N. M., Effect of oil population on the nitrogen cycle in the soil, Mikrobiologiya, 1983, 52,1003-1007.
11Kula, H., Larink, O., Tests on the earthworms Eisenia fetida and Aporrectodea caliginosa. In: Handbook of Soil Invertebrate Toxicity Tests. Eds. H. Lockke and C. A. Mvan Getsel. JohnWiley & Sones Ltd. Chichester, 1998.
12Shakir Hanna, S.H., Weaver, R.W., Earthworm survival in
oil-contaminated soil, Plant and Soil, 2002, 240, 127–132. DOI:
https://doi.org/10.1023/A:1015816315477
13Vepraskas,M.J.. Redox potential Measurements. NC State University, 2002, 1-17.
14SPSS Inc.SPSS Base 8.0 for Windows User's Guide. SPSS Inc., Chicago.1998. http://www.childrens-mercy.org/stats/ask…
15Base SAS 9.3, Procedures Guides: Statistical procedures. Copyright 2011 by SAS Int. Software, Inc.
16SYSTAT 12. Getting started. Copyright 2007 by SYSTAT
software, Inc.
17SPSS Science, S., Sigmaplot, Version 8 SPSS Science, 2002.
www.spsscience.com/sigmaplot.
18Matlab works Inc., 2009.
19Sokal, R. R., Rohlf, F. J., Biometry The Principles and practices
of Statistics in Biological Research: W.H Freeman and Company. NY 1995.
20McDonald, J.H., Handbook of biological statistics. Sparky House, Publishing, Baltimore, Maryland U.S.A, 2009, 313 p.
21Su, W., Wu, B., Cheng, W., Characterization and biodegradation of motor oil by indigenous Pseudomonas aeruginosa and optimizing medium constituents. J. Taiwan Inst. Chem. Eng.,
2011,42, 689-695.
https://doi.org/10.1016/j.jtice.2011.01.002.
22Daniel, V. A., Environmental Biotechnology- A Biosystem
Approach,2010, 742 pp. Academic Press, Elsevier Science, USA
23Fitzpatrick, L.C., Muratti-Ortiz, J.F., Venables, B.J.,Goven, A.J., Comparative toxicity in earthworms Eisenia fetida and Lumbricus terrestris exposed to cadmium nitrate using artificial soil and filter paper protocols. Bull. Environ.
Contam. Toxicol, 1996, 57, 63-66. DOI:
https://doi.org/10.1007/s001289900156
24Neuhauser, E. F., Loehr, R. C., Milligan, D. L. and Malecki, M. R., Toxicity of metals to the earthworm Eisenia fetida. Biol.
Fertil. Soils, 1985 1,149-152. DOI:
https://doi.org/10.1007/BF00301782
25Spurgeon, D. J., Hopkins, S. P., Effects of metal-contaminated soils on the growth, sexual development, and early cocoon production of the earthworm Eisenia fetida, with particular reference to zinc. Ecotoxicol. Environ. Safety,1996, 35, 86-95. https://doi.org/10.1006/eesa.1996.0085
26Spurgeon, D. J., Svendsen, D. J., Rimmer, C., Hopkin V. R. S. P., Weeks, J. M., Relative sensitivity of life-cycle and biomarker responses in four earthworm species exposed to zinc.
Environ. Toxicol. Chem., 2000, 19, 1800-1808. DOI: 10.1002/etc.5620190714.
27Cikutovic, M.A., Fitzpatrick, L.C., Venables, B. J., Goven, A.J., Sperm count in earthworms (Lumbricus terrestris) as a biomarker for environmental toxicology: effects of cadmium and chlordane. Ecotoxicol. Environ., 1993, 81, 123-125.
https://doi.org/10.1016/0269-7491(93)90076-Z
28Siekierska, E., Urbanska-Jasik, D., Cadmium effect on the ovarian structure in earthworm Dendrobaena veneta (Rosa).
Environ. Pollut., 2002, 120, 289-297.
https://doi.org/10.1016/S0269-7491(02)00152-5
29Khalil, M. A., Abdel-Lateif, H. M., Bayoumi, B. M., Straalen, N. M. V., Analysis of separate and combined effects of heavy metals on the growth of Aporrectodea caliginosa
(Oligochaeta; Annelida), using the toxic approach. Appl. Soil Ecol., 1996, 4, 213-219. https://doi.org/10.1016/S0929-1393(96)00115-1
30Van Gestel, C. A., Van Dis, W. A., Dirven-V-van Breemen, E. M., Sparenburg, P. M., Baerselman, R., Influence of cadmium copper and pentachlorophenol on growth and sexual development of Eisenia andrei (Oligochaeta, Annelida). Biol. Fertil. Soils, 1991, 12, 117-121. DOI:
https://doi.org/10.1007/BF00341486
Received: 20.11.2017.