Study on Optimization of Mobile Data Visualization Algorithm
Wenwen Liu
1,a1School of Computer Science and Technology, Chongqing University of Posts and
Telecommunications,
NO.2, Chongwen Road, Nanan District, Chongqing City, China
Keywords: computer software; data visualization; tiling; moving heat trajectory
Abstract. Along with the development of Internet, to produce more and more massive amounts of data, and visualization methods can rapidly and effectively simplify and refine data. Heat map is a method of data visualization, It can provide a basic support for the optimization of urban traffic management that we researched the trajectory of the heat of an area of mobile users in a certain period of time. In this paper, taking part of the mobile users in Chongqing area as data base, we researched and implemented a static heat map model in a moment of overall user location in the background of data visualization technology, and further researched the mobile heat map in a certain period of time the user from the beginning to the end of the moving trajectory.
Introduction
In recent years, with the rapid development of data warehouse technology, network technology and e-commerce technology, visualization technology covers a wider range of content, and we further puts forward the concept of data visualization. What is called data visualization is the visualization of data in large database or data warehouse, it is the application of visualization technology in the field of non-spatial data and the people no longer limited to the relationship between data tables to the observation and analysis of information included in data, but also in a more intuitive way to see the data structure and their relationship [1]. Data visualization can maximum eliminate the boundary between the data world and human cognition.
From the service of information perspective, visualization of data essentially provides an interface. Regardless of the internal structure of data visualization, Users need to be presented in an easy to understand the data content, time saving and efficient way to understand the meaning of data[2]. The content of this paper is based on part of the Chongqing area mobile user location information data, then we designed heat map model that the user position in a moment. On that basis, we located the end position of each user in a certain period of time, by roughly connecting their starting and ending positions, we approximately set up trajectories of mobile heat. The Related Research
The system needs to map topology partitioning plane to calculate the heat area, we use the hexagon structure to tiling map by comparison [3,4]. Owing to all data display areas are in the plane coordinate system, we need to convert the latitude and longitude coordinates of the user's information to the screen coordinates.
Coordinate Conversion Algorithm. The data in visualization system for mobile users is an excel document which has thousands of research data (4130 user data in this paper). The original data of each user is the starting and ending positions of the latitude and longitude, we need to finish the coordinate transformation of data before drawing the heat map, and after the treatment the screen coordinates are stored in the document as data to be directly taken in the program.
Geographical coordinates defined rules: X axis (on behalf of the longitude) increases to the right, the Y axis (latitude) increases to the top. Screen coordinates defined rules: X axis increases to the right, Y axis increases to the bottom. Thus, the difference between geographic coordinates and screen coordinates is only in Y axis they have an oppositely direction to increase. Geographical
coordinates convert to seconds to measure and use double type to calculate so as to ensure the accuracy of the results, then we convert to int type at the end. According to the literature [5] that analysises of the longitude and latitude coordinates into screen coordinates algorithm:The final formula that converts the latitude and longitude coordinates to screen coordinates is as follows: X 3600/scale * minLon) -(Lon = X (1) Y 3600/scale * Lat) -(maxLat = Y (2)
Tiling by Hexagon. A tiling is a covering of the entire plane with figures which do not overlap, and leave no gaps. In this paper, we uses monohedral tilings which use only one size and shape of tile. Not all of regular polygons can tile the plane except equilateral triangle, square and hexagon [6] which does not overlap each other and not leave gaps. But in these three kinds of graph, the hexagon has these advantages that it can completely fill the plane, has the most efficient
and follows the most common natural principle -- the principle of leastaction[7]. In
addition compared to regular triangle and quadrangle,hexagons have
more multi-direction description. Based on the above theory, we adopt the hexagon to topologically tile the plane.
As the figure 1 shown to realize hexagonal tessellation, hexagon tiling takes the upper left corner of the maximum width and height as the starting point. The hexagonal cell whose coordinate is (0, 0) tiles from point coordinates of O, the hexagonal cell whose coordinate is (1, 0) tiles from M point, the hexagonal cell whose coordinate is (0, 1) tiles from N point, and so on. As shown in figure 2.
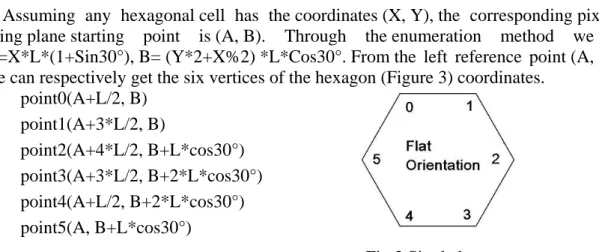
Assuming any hexagonal cell has the coordinates (X, Y), the corresponding pixel location for tiling plane starting point is (A, B). Through the enumeration method we obtained that A=X*L*(1+Sin30°), B= (Y*2+X%2) *L*Cos30°. From the left reference point (A, B) in figure 2, we can respectively get the six vertices of the hexagon (Figure 3) coordinates.
point0(A+L/2, B) point1(A+3*L/2, B) point2(A+4*L/2, B+L*cos30°) point3(A+3*L/2, B+2*L*cos30°) point4(A+L/2, B+2*L*cos30°) point5(A, B+L*cos30°)
Fig.3 Single hexagon
Table 1 is the pseudo code that we realized the hexagonal topology partition algorithm. Tab. 1 Hexagonal tiling algorithm pseudo code
Hexagonal tiling algorithm pseudo code
1 Define three variables: M and N which are used to represent the hexagonal
two-dimensional array M*N;
L is the edge of hexagon;
2 Initialize variable L according to the degree of subdivision;
3 Calculate M = m_pixelsX / ( 3L / 2 ), N = m_pixelsY / ( 3L / 2 ), where
m_pixels X, m_pixels Y separately stand for the screen’s width and height; 4 For ( i = 0 to M )
For ( j = 0 to N )
Define four variables: A and B are on the left of the reference point of the hexagon; Ox and Oy are the center point of the hexagon;
Calculate A = i*L*( 1 + sin30°); B = ( 2*j + i%2 )*L*cos30°; Ox = A + L; Oy = B + L*cos30°;
Calculate the six points of the hexagon;
Push these points to the m_vPointList container;
Define one array pList[lNum] to store these points, where lNum is the size of the m_vPointList container;
Draw one hexagon: Polygon ( pList, 6 ); End For
End For
5 End
The core algorithm of mobile data visualization system
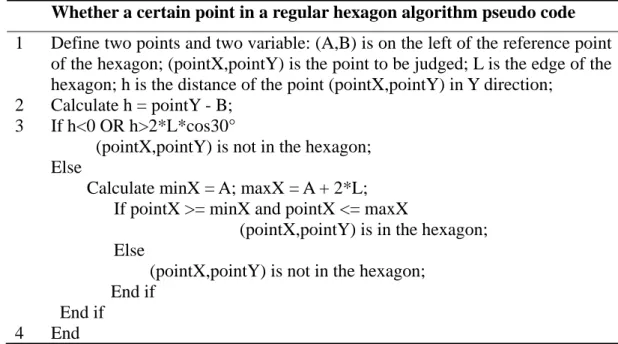
The core algorithm of static heat map. To depict the heat area, first of all we need to locate the hexagon which is the concentration of the user start or stop location coordinates. Finally according to their density, hexagons are plotted for different degree of heat zone. Table 2 is the pseudo code of the core algorithm that to determine whether a certain point in a regular hexagon.
Tab. 2 Whether a certain point in a regular hexagon algorithm pseudo code Whether a certain point in a regular hexagon algorithm pseudo code 1 Define two points and two variable: (A,B) is on the left of the reference point
of the hexagon; (pointX,pointY) is the point to be judged; L is the edge of the hexagon; h is the distance of the point (pointX,pointY) in Y direction;
2 Calculate h = pointY - B;
3 If h<0 OR h>2*L*cos30°
(pointX,pointY) is not in the hexagon; Else
Calculate minX = A; maxX = A + 2*L; If pointX >= minX and pointX <= maxX
(pointX,pointY) is in the hexagon; Else
(pointX,pointY) is not in the hexagon; End if
End if
4 End
The core algorithm of the heat trajectory.The trajectory of users in real life depicted in the map plane by an irregular curve. In order to describe the curve, we approximately make it up by the large number of line segments. In this paper, we use the line segment that links the starting point with the end point of user to approximately represent the user's real trajectory. To describe the heat trajectory, we need to search these hexagons which intersect with the given trajectory segment. Table 3 is a pseudo code algorithm to search hexagons which intersect with the given trajectory.
Tab. 3 Search hexagons which intersect with the given trajectory segment algorithm pseudo code Search hexagons which intersect with the given trajectory segment algorithm
pseudo code
1 Define three points: O(Ox, Oy) is the center point of one hexagon;
M(Mx, My) and N(Nx, Ny) are respectively the two endpoints of the given trajectory segment;
Define one variable: FH is the hexagon factor to measure times which intersect with the given trajectory segment;
Pre-processing: With a given line segment MN for diagonal draw the rectangle, and to expand a hexagonal side length L in four directions of this rectangle;
2 If min(Mx, Nx)-L ≤Ox≤ max(Mx, Nx)+L AND
min(My, Ny)-L ≤Oy≤ max(My, Ny)+L
Calculate the length d from the point O to the straight line MN; If L ≥ d
If min(Mx, Nx) ≤ Ox ≤ max(Mx, Nx) AND
min(My, Ny) ≤ Oy ≤ max(My, Ny) FH = FH + 2;
End if
3 End
Conclusion
This paper firstly introduces the research background, then it gives the original data pre-processing algorithms and topology partitioning algorithm that tiling by hexagon for mobile data to describe heat area convenient before realizing the
visualization system. Finally we proposed the core algorithm of the static heat model
and heat trajectory. This system can be used as the basis of researching mobile data visualization. To improve the real utilization rate of this system, the follow-up work is optimize our algorithms and realize the trajectory in reality.
References
[1] Y.H. Zhu, W.N. Hao and G. Cheng: The Summary of Visualization Theory. Computer
Knowledge and Technology, Vol.8 (2012), p. 1402~1407 (in Chinese)
[2] H. Zhang and C. Guo: Image De-noising Based on Different Wavelet Thresholding Functions.
Software Guide, Vol.11 (2012), p. 169~172 (in Chinese)
[3] D. Chavey: Tilings by Regular Polygons-Ⅱ A Catalog of Tilings. Computers & Mathmatics with Applications, Vol.17 (1989), p. 147-165
[4] E. B. Saff and A. B. J. Kuijlaars: Distributing Many Points on a Sphere. Springer-Verlag, Vol.19 (1997), p. 5-11
[5] Information on http://www.blogjava.net/mycolby/articles/268261.html
[6] COMAP (The Consortium for Mathematics and its Appl), in: For All Practical Purposes,
edtied by W.H. Freeman Publications, GER (2009), in press.