Consult this publication on line at http://dx.doi.org/10.1787/migr_outlook-2015-en.
This work is published on the OECD iLibrary, which gathers all OECD books, periodicals and statistical databases. Visit www.oecd-ilibrary.org for more information.
International Migration
Outlook 2015
International Migration Outlook 2015
Contents
Editorial: Now more than ever, migration policy needs to be comprehensive and co-ordinated
Executive summary
Chapter 1. Recent developments in international migration movements and policies
Chapter 2. Recent labour market trends and integration policies in OECD countries
Chapter 3. Changing patterns in the international migration of doctors and nurses to OECD countries
Chapter 4. Country notes: Recent changes in migration movements and policies
Statistical annex
www.oecd.org/migration/imo
ISBN 978-92-64-23694-3In
te
rnat
iona
l Mi
g
rat
ion
O
u
tlo
o
k 2
01
5
9HSTCQE*cdgjed+
International Migration
Outlook
opinions expressed and arguments employed herein do not necessarily reflect the official views of OECD member countries.
This document and any map included herein are without prejudice to the status of or sovereignty over any territory, to the delimitation of international frontiers and boundaries and to the name of any territory, city or area.
ISBN 978-92-64-23694-3 (print) ISBN 978-92-64-23695-0 (PDF)
Annual: International Migration Outlook ISSN 1995-3968 (print)
ISSN 1999-124X (online)
The statistical data for Israel are supplied by and under the responsibility of the relevant Israeli authorities. The use of such data by the OECD is without prejudice to the status of the Golan Heights, East Jerusalem and Israeli settlements in the West Bank under the terms of international law.
Photo credits:Cover © David Rooney.
Corrigenda to OECD publications may be found on line at:www.oecd.org/about/publishing/corrigenda.htm. © OECD
You can copy, download or print OECD content for your own use, and you can include excerpts from OECD publications, databases and multimedia products in your own documents, presentations, blogs, websites and teaching materials, provided that suitable acknowledgement of OECD as source and copyright owner is given. All requests for public or commercial use and translation rights should be submitted to[email protected]. Requests for permission to photocopy portions of this material for public or commercial use shall be addressed directly to the Copyright Clearance Center (CCC) at[email protected]or the Centre français d’exploitation du droit de copie (CFC) at[email protected].
Please cite this publication as:
OECD (2015),International Migration Outlook 2015, OECD Publishing, Paris. http://dx.doi.org/10.1787/migr_outlook-2015-en
Foreword
T
his publication constitutes the thirty-ninth report of the OECD’s Continuous Reporting System on Migration. The report is divided into four chapters plus a statistical annex.Chapter 1 provides a broad overview of recent trends in international migration flows and migration policies. Chapter 2 takes a close look at the employment situation of immigrants and highlights major changes in policies to support the integration of immigrants and their children.
Chapter 3 looks at changing patterns in the international migration of doctors and nurses to OECD countries. It examines how the international migration of health workers to OECD countries has evolved since 2000. It analyses flows against the background of shifts in migration and health policies and economic and institutional change.
Chapter 4 presents succinct country-specific notes and statistics on developments in international migration movements and policies in OECD countries in recent years. Finally, the statistical annex includes a broad selection of recent and historical statistics on immigrant flows, the foreign and foreign-born populations and naturalisations.
This year’s edition of the OECDInternational Migration Outlookis the joint work of staff of the International Migration Division in the Directorate for Employment, Labour and Social Affairs. Chapters 1, 2 and 4 are a collective work of the staff of the International Migration Division with contributions from John Salt (University College London, United Kingdom) for Chapter 1 and from Martina Lubyova (Slovak Academy of Sciences, Slovak Republic) and Ioannis Kaplanis (OECD) for Chapter 2. Chapter 3 was prepared by Clémence Merçay (University of Neuchâtel), Jean-Christophe Dumont (OECD) and Gaétan Lafortune (OECD). Jean-Christophe Dumont edited the report. Research assistance and statistical work were carried out by Véronique Gindrey and Philippe Hervé. Editorial assistance was provided by Sylviane Yvron. Finally, thanks go to Ken Kincaid for his editing of Chapters 1 and 3.
Table of contents
Editorial: Now more than ever, migration policy
needs to be comprehensive and co-ordinated . . . 9
Executive summary. . . 11
Chapter 1.Recent developments in international migration movements and policies. . . 15
Introduction. . . 16
Recent trends in international migration . . . 17
General policy developments . . . 38
Notes. . . 53
Annex 1.A1.Supplementary tables and figures . . . 54
Chapter 2.Recent labour market trends and integration policies in OECD countries . . 59
Introduction. . . 60
Labour market trends. . . 61
Integration policy . . . 80
Conclusions . . . 90
Bibliography . . . 90
Annex 2.A1.Supplementary tables and figures . . . 91
Chapter 3.Changing patterns in the international migration of doctors and nurses to OECD countries . . . 105
Introduction. . . 106
International migration of health workers in OECD countries: The destination country perspective . . . 108
International migration trends for health workers in OECD countries: The sending country perspective . . . 128
The impact of health policies and immigration policies on the international mobility of health workers . . . 136
International mobility of students: A growing component of international migration of health workers . . . 163
Notes. . . 169
Bibliography . . . 171
Chapter 4.Country notes: Recent changes in migration movements and policies . . . 183 Australia . . . 184 Austria . . . 186 Belgium . . . 188 Bulgaria . . . 190 Canada . . . 192 Chile . . . 194 Czech Republic . . . 196 Denmark . . . 198 Estonia . . . 200 Finland . . . 202 France . . . 204 Germany. . . 206 Greece . . . 208 Hungary . . . 210 Ireland . . . 212 Israel . . . 214 Italy . . . 216 Japan . . . 218 Korea. . . 220 Latvia . . . 222 Lithuania . . . 224 Luxembourg. . . 226 Mexico . . . 228 Netherlands . . . 230 New Zealand . . . 232 Norway . . . 234 Poland. . . 236 Portugal . . . 238 Romania . . . 240 Russian Federation . . . 242 Slovak Republic . . . 244 Slovenia . . . 246 Spain. . . 248 Sweden . . . 250 Switzerland . . . 252 Turkey . . . 254 United Kingdom . . . 256 United States . . . 258
Sources and notes of the country tables of Chapter 4. . . 260
Statistical annex. . . 263
Introduction. . . 264
General comments . . . 264
Inflows and outflows of foreign population . . . 266
Inflows of asylum seekers . . . 291
Stocks of foreign and foreign-born populations. . . 311
Acquisitions of nationality . . . 349
List of the members of the OECD Expert Group on Migration. . . 371
Look for the StatLinks2at the bottom of the tables or graphs in this book. To download the matching Excel® spreadsheet, just type the link into your Internet browser, starting with the http://dx.doi.org prefix, or click on the link from the e-book edition.
This book has...
StatLinks2
A service that delivers Excel files from the printed page! ® http://twitter.com/OECD_Pubs http://www.facebook.com/OECDPublications http://www.linkedin.com/groups/OECD-Publications-4645871 http://www.youtube.com/oecdilibrary http://www.oecd.org/oecddirect/ OECD Alerts
Editorial:
Now more than ever, migration policy
needs to be comprehensive and co-ordinated
O
ECD countries are facing an unprecedented refugee crisis. In 2014, more than 800 000asylum applications were recorded, an historical high, but the figure for 2015 is expected to be even higher. Even if humanitarian migration is an issue of increasing concern in several parts of the world, notably in Asia, most asylum applications were made in Europe (more than 600 000 in 2014). This is clearly an emergency situation that requires a co-ordinated response at both European and global levels.
In Europe, this humanitarian crisis is taking place in the broader context of increasing challenges associated with irregular migration. The absence of controls at Libyan borders has created a unique situation and the number of irregular entries, as recorded by the European agency Frontex, is on a constant rise. In the first six months of 2015, about 137 000 people landed in Greece, Italy, Malta and Spain, corresponding to a staggering 83% increase on the 75 000 recorded for the same period of 2014. The fact that these landings include not only potential refugees but also migrants who are not always in clear need of protection adds to the pressure.
Images of people landing on the European shores and information on the many who died in their attempt to find a better life are as powerful as the tragedy of these people is real. The current refugee crisis also takes place in a context of relatively weak European economic and labour market conditions, as well as against the background of a global fight against terrorism. The anxiety regarding migration issues has reached new highs and anti-immigrant sentiment is spreading.
Building consensus among European countries to identify and agree on ad hoc
emergency solutions has proven particularly challenging, in part because of expected negative reactions in public opinion at the national level. Nevertheless, in light of the worsening situation, current policy responses may need to be prolonged and enhanced. The failure to anticipate – and to communicate on – ongoing trends may actually have a very detrimental effect on trust and ultimately on the capacity to adapt further emergency policy responses but also, more generally, to adapt migration management systems as required.
Most resources (political capital, administrative staff, energy and attention of policy makers) are currently devoted to addressing the humanitarian crisis. However, one should not forget that existing legal migration systems also need to be constantly adjusted because of changing economic and demographic conditions, international competition for talent, and lessons learnt from evaluation of past policies and experiences. This also applies to integration policies, which help ensure migrants’ skills are used to their best potential. Most migration to Europe and the OECD still occurs through legal channels and is managed in an orderly fashion. Legal permanent migration to the OECD amounted to
4.3 million in 2014, a 6% increase compared to 2013. In the European Union (EU), permanent legal migration from outside the EU is now equivalent to what is recorded in the United States: about one million a year.
The integration of immigrants and their children also needs to be supported by appropriate public policies. Recent OECD evidence shows that despite some marked improvements across generations, in many OECD countries immigrants are more likely to be unemployed, in low quality jobs or overeducated in their jobs and to face poverty including in-work poverty. Their children attain on average lower levels of education. To make the most out of skills of migrants who are here to stay, it is important to continue investing in integration policies and reinforcing the efficiency of these investments.
The European Agenda on Migration proposed by the European Commission in April 2015 was initially meant to develop a global approach with proposals for immediate action but also longer term proposals for a new labour migration management system and integration. The second part of this equation should not be forgotten.
Even in the current context of the humanitarian crisis, a global policy strategy is needed, which has the right tools – and international co-ordination – to deal with current and future refugees and asylum seekers flows as well as more long-term tools to get the most out of legal migration. Failure to act on the first is likely to jeopardise efforts to improve on the second, as it will fuel anxiety about migration, regardless of the actual numbers involved.
Executive summary
Main trends
Immigration flows are on the rise in most OECD countries. Preliminary data for 2014 suggest that permanent migration flows increased sharply for the first time since 2007 and are back to their pre-crisis level, with 4.3 million permanent entries to the OECD. Family reunification migration accounted for 35% of all permanent migration to OECD countries in 2013 and free movement for 30%.
Germany is consolidating its position as one of the main immigration countries, now second only to the United States in the number of migrants it receives. Overall, in 2013 the European Union (EU) received as many permanent migrants from outside the EU as the United States did from all countries. One in ten new immigrants to the OECD is Chinese and 4.4% are from India. Romania and Poland rank second and third, with 5.5% and 5.3% of overall inflows to OECD countries.
In 2014, the number of new asylum seekers in OECD countries rose by 46%, exceeding 800 000 for the first time since the beginning of the 1990s, the second highest level in 35 years. Preliminary data suggest that 2015 will also reach a historical high. The top destination countries are Germany, the United States, Turkey, Sweden and Italy. France is now sixth, down from its longstanding position among the top three destination countries.
A number of OECD countries have fundamentally revised their migration legislation in the past few years, responding to evolving patterns of migration and to the changing political environment. Most changes tend towards restrictions: i) skilled workers are still wanted, but countries are picking them more selectively; ii) investors and entrepreneurs are sought after, but are increasingly scrutinised; iii) some family immigration procedures are being eased, but the general trend is still towards restriction; iv) new measures have been adopted in response to the humanitarian crisis in the Mediterranean region; and v) actions to strengthen border controls, encourage voluntary returns and fight against illegal employment of foreign workers have been implemented.
For the vast majority of countries, the labour market outcomes of migrants and natives have been either stable or improving in recent years. However, some countries which have not yet recovered from the crisis (Greece, Italy and Slovenia) have seen migrants disproportionally affected. Overall, during 2011-14 the average employment rate of migrants in the OECD area increased slightly more for migrants than for natives, although no significant change in their unemployment rate was seen.
While targeted integration measures continue to be widely used, some countries with a longstanding tradition of hosting immigrants are trying to mainstream integration measures into all aspects of economic and social life. Many countries are placing particular emphasis on the recognition of foreign qualifications and on lifelong learning, in particular for those who lack basic skills.
International mobility of health workers
In total, the number of migrant doctors and nurses working in OECD countries has increased by 60% since 2004. The trend mirrors the general increase in immigration to OECD countries – particularly that of skilled workers. It also points to the sizeable contribution that immigrants made to the rise in numbers of healthcare workers in OECD countries in the 2000s, although the very latest data show a fall in inflows in a number of countries.
Asian countries are the world’s top suppliers of emigrant doctors and nurses, but there is also increasing mobility between OECD countries, chiefly because of growing intra-EEA flows. Small and island countries, however, still show the highest emigration rates.
In 2010/11, doctors and nurses who had emigrated to the OECD area from countries affected by severe shortages of healthcare professionals, as defined by the World Health Organisation (WHO), accounted for 20% of estimated healthcare workforce needs in their countries of origin, compared with 9% in 2000/01.
Against the background of burgeoning international student mobility, the number of medical students pursuing their education abroad has soared in recent years. This is the result of the increasingly international nature of medical studies, which is due both to unmet demand in countries that restrict access to healthcare education and training and to the growing offer of places in medical school in others. In coming years, the number of international medical graduates can be expected to continue rising.
Main findings
Migration is rising overall and has returned to its pre-crisis level
● The total foreign-born population in OECD countries stood at 117 million people in 2013,
corresponding to 35 million (40%) more than in 2000.
● Preliminary 2014 data suggest that permanent migration flows to the OECD reached
4.3 million permanent entries to the OECD, a 6% increase compared to 2013. In addition, most categories of temporary migration also increased.
● China and India remain important origin countries, but Poland and Romania are also
significant, due to increased intra-EU mobility.
● Asylum seekers in OECD countries reached an historical high in 2014 and levels continue
to increase in 2015.
Some positive signs regarding labour market outcomes of immigrants
● Overall, the average employment rate of immigrants in the OECD area increased by
1.3 percentage points during 2011-14, compared with 0.5 percentage points for the native population.
● The unemployment rate did not change much, remaining on average 3.3 points higher
for foreign-born than for native-born.
● In the OECD area, the rise of long-term unemployment for migrants has slowed down
The growing importance of health worker migration
● The share of foreign-born among doctors grew in most countries between 2000/01
and 2010/11 from an average (across 23 countries) of 19.5% to more than 22%, while that among nurses rose from 11% to 14.5% (22 countries).
● In 2010/11, foreign-born doctors and nurses practicing in OECD countries made up about
5% of all healthcare professionals worldwide.
● In 2012/14, foreign-trained doctors and nurses accounted for 17% and 6%, respectively, of the healthcare workforce in the 26 countries for doctors and 24 countries for nurses for which data were available.
● Between 2000/01 and 2010/11 the number of doctors and nurses emigrating to
OECD countries from countries with severe shortages in health workers grew by more than 80%.
Chapter 1
Recent developments in international
migration movements and policies
This chapter provides an overview of recent developments in international migration movements in OECD countries. It begins with a description of the uptick in migration flows in 2014, based on preliminary and partial data. This is followed by a more detailed analysis of the trends in permanent migration from the start of the financial crisis through 2013, by country and by main category of migration – migration for work, family or humanitarian purposes, and migration within free movement areas. Temporary migration is then covered, with brief highlights on seasonal workers and intra-company transferees, and a focus on posting of workers within the European Economic Area (EEA). Close attention is then devoted to the spike in the number of asylum seekers, before turning to the international mobility of students. The chapter continues with a brief description of the composition of migration flows by gender and by country of origin, then turns to the evolution of the foreign-born population, the changing trends in net migration and the acquisition of nationality across OECD countries. A detailed policy section follows, describing the major recent developments in policies that regulate the entry and stay of foreign nationals in OECD countries. Large-scale revisions in migration frameworks are reviewed. Policy changes for different categories of migrants are examined (skilled and less skilled workers; investors and entrepreneurs; international students; family migrants and humanitarian migrants). The developments in management systems for permits and for asylum procedures are discussed, followed by enforcement measures and those to encourage return.
The statistical data for Israel are supplied by and under the responsibility of the relevant Israeli authorities. The use of such data by the OECD is without prejudice to the status of the Golan Heights, East Jerusalem and Israeli settlements in the West Bank under the terms of international law.
Introduction
The overall GDP growth for the OECD area in 2014 is estimated at 1.8% against 1.4% in 2013 and 1.3% in 2012. Almost all OECD countries showed positive GDP growth rates in 2014, with very limited decline in the only three countries still reporting negative figures (Italy, down 0.4%, and Finland and Japan, both down 0.1%). The labour market situation did not improve in all OECD countries in 2014 but, at the end of the year, the overall harmonised unemployment rate in the OECD area had fallen to approximately 7%, its average level since data recording began in 1991.
This slightly improved economic climate, combined with factors such as demographic developments and geopolitical crises, created an environment conducive to resumption of international migration movements, as will be seen.
This chapter proposes a glance on these most recent trends, and then gives a global view of international migration flows and policies. It covers total permanent movements into OECD countries, entries by category, temporary labour migration, asylum movements, international students and movements by gender and country of origin. The chapter then gives an overview on foreign-born populations, net migration and acquisition of citizenship, from 2000 onwards. The second part of this chapter is a detailed policy section, which goes through major recent developments in policies that regulate the entry and stay of foreign nationals in OECD countries. Large-scale revisions in migration frameworks are reviewed, as well as specific policy changes affecting particular categories of migrant, and revisions of asylum procedures and enforcement measures.
Main findings
● Preliminary data suggest that permanent migration flows to the OECD increased sharply
in 2014 for the first time since 2007 and is back to its pre-crisis level with 4.3 million permanent entries to the OECD.
● Germany consolidates its position as one of the main immigration countries, second
only to the United States. Significant increases in inflows are recorded for example in the Czech Republic, Israel, Ireland and the United Kingdom. In contrast, the largest decreases are observed in Slovenia, Italy or Australia.
● In 2013, the European Union has received as many permanent migrants from outside the
EU as the United States did from all countries, and for the first time Korea received more immigrants than Japan.
● Family reunification migration accounted for over one-third of all permanent
migration to OECD countries in 2013 (-1% compared to 2012) and free movement for 30% (+4%).
● Inflows of temporary migrant workers are also increasing but with large variation across
categories: intra-company transferees (+6% in 2013 compared to 2012), working holidaymakers (+12% for Australia, Canada, New Zealand, the United Kingdom and
the United States), seasonal workers in agriculture and hospitality (-0.4%, excluding intra-EU movements).
● In 2013, one in ten new immigrants to the OECD is Chinese and 4.4% are from India.
Romania and Poland rank second and third with respectively 5.5% and 5.3% of overall inflows to OECD countries.
● In 2012, there were 3.4 million foreign students in the OECD, +3% compared with the
previous year. They accounted for an average of 8% of the OECD tertiary-level student population. Most international students in higher education in the OECD originate from Asia – 22% from China, 6% from India, and 4% from Korea.
● Applications for asylum in the OECD area have increased steadily since 2010, reaching a
20-year peak in 2014 at over 800 000, the second highest year in the last 35 years. The number of asylum seekers across the OECD rose by 46% in 2014 over 2013, fuelled partly by the deteriorating security situation in Syria and Libya, notably.
● The total foreign-born population in OECD countries stood at 117 million people in 2013
which corresponds to 35 million and 40% more than in 2000.
● Since 2000, OECD countries have granted nationality to 25 million foreign nationals.
In 2013, more than 2 million people acquired the citizenship of an OECD country, up 14% from 2012.
● During the last years, a number of countries have fundamentally revised their migration
legislation in response to evolving patterns of migration and to the changing political environment: i) skilled workers are still wanted, but countries are picking them more selectively, ii) investors and entrepreneurs are sought after, but are increasingly scrutinised, iii) some family immigration procedures are being eased but the general trend is still towards restriction, iv) new measures have been adopted in response to the humanitarian crisis in the Mediterranean region and v) actions to strengthen border controls, encourage voluntary returns and fight against illegal employment of foreign workers have been implemented.
Recent trends in international migration
Preliminary trends 2014
With more favourable global economic conditions than in previous years, partial data for 2014 point to a sharp increase in permanent migration in the OECD area. Roughly 4.3 million people immigrated to OECD countries (Figure 1.1), compared with 4.1 million the year before – a 6% year-on-year rise. The level reached was in fact higher than in the years prior to the 2007/08 global economic crisis.
Preliminary figures, based on non-standardised statistics and partial counts, show not only that flows increased in most OECD countries in 2014, but that in more than half they outstripped their 2007 levels. The United States was the prime destination, accounting for one million new permanent residents, a 1% increase compared to 2013 (Table 1.A1.1). Germany, which confirms its second place with yet another double-digit increase, contributed to much of the overall increase in flows to the OECD in 2014. The United Kingdom, too, saw a rise in numbers of new migrants from EU and non-EU countries, and partial data for Spain suggest a robust resumption of immigration. There were also moderate increases in Canada, of 5%, and in France, where flows of third-country nationals climbed 3%.
A number of relatively smaller countries also contributed noticeably to the overall rise in flows. Korea, for example, with the lowest unemployment rate in the OECD and the second strongest economic growth – both around 3% – saw inflows increase by more than 12%. Austria, Denmark, Ireland, Israel, New Zealand, and Sweden all received between significantly more arrivals in 2014 than in 2013. A double-digit increase is also observed in Iceland.
Only a few countries took in fewer migrants in 2014 than in 2013. Italy, where most migrants come for work purposes, experienced a 9% fall, partly due to its difficult labour market situation. Although inflows to the country have been declining steadily since 2007, Italy remains among the OECD’s main destinations.
With a 6% drop, Australia was another major immigration destination that welcomed less new migrants in 2014 than in 2013. In Switzerland, too, there was a slight fall – of 2% – for the first time in ten years, while the make-up of inflows by country of origin changed significantly. Arrivals from EU15 countries, Romania, and Bulgaria dropped by 9% while those from other EU member countries and third countries altogether increased by 13%.
Trends in migration flows by country and by category
Comprehensive data for standardised permanent migration by country of destination and migration category are available for 2013. In 2013, the United States welcomed a little less than one million new permanent migrants (Table 1.1). Altogether, the OECD countries which are also EU members received a similar number of third-country nationals. Germany was the second main OECD destination country, with 468 000 arrivals of permanent migrants, a figure twice higher than the average level at the end of the 2000s. In Southern European countries like Spain, Italy, Portugal and Greece, new migrants are approximately twice fewer than in 2008, which is also the case in Ireland. All those countries had been particularly hard hit by the 2008 Great Recession. It can also be noted that, for the first time since these data exist, new permanent arrivals in Korea outnumbered those in Japan. Migration flows to Chile have also increased rapidly in 2012 and 2013, to reach 132 000.
Figure 1.1. Permanent migration flows to OECD countries, 2006-14
Note:Data for 2006 to 2013 is the sum of standardised figures for countries where they are available (accounting for 95% of the total of flows to OECD countries), and non-standardised figures for other countries. 2014 data are estimated based on growth rates published in official national statistics.
Source:OECD calculations based on national statistics.
1 2 http://dx.doi.org/10.1787/888933260721 5.0 4.5 4.0 3.5 3.0 2006 2007 2008 2009 2010 2011 2012 2013 2014 (e) 4.1 4.7 4.4 4.1 4.0 4.0 4.0 4.1 4.3 Millions
Table 1.1. Inflows of permanent immigrants into selected OECD countries, 2007-13 2007 2008 2009 2010 2011 2012 2013 Variation (%) 2013/12 2012/11 2013/07 Standardised statistics United States 1 052 400 1 107 100 1 130 200 1 041 900 1 061 400 1 031 000 989 900 -4 -3 -6 Germany 232 900 228 300 201 500 222 500 290 800 400 200 468 800 17 38 101 United Kingdom 343 300 317 300 359 200 394 800 322 600 286 100 291 000 2 -11 -15 France 206 500 214 400 212 100 224 300 231 500 251 200 259 800 3 9 26 Canada 236 800 247 200 252 200 280 700 248 700 257 900 258 600 0 4 9 Australia 191 900 205 900 221 000 208 500 219 500 245 100 253 500 3 12 32 Italy 571 900 490 400 390 300 355 700 317 300 258 400 245 800 -5 -19 -57 Spain 691 900 409 600 334 100 300 000 291 000 209 800 195 300 -7 -28 -72 Switzerland 122 200 139 100 114 800 115 000 124 300 125 600 136 200 8 1 11 Netherlands 80 600 90 600 89 500 95 600 105 600 | 96 800 105 500 9 -8 31 Sweden 74 400 71 000 71 500 65 600 71 800 81 700 86 700 6 14 17 Korea 44 200 39 000 36 700 51 100 56 900 55 600 66 700 20 -2 51 Austria 47 100 49 500 45 700 45 900 58 400 | 67 100 65 000 -3 15 38 Norway 43 900 49 300 48 900 56 800 61 600 59 900 60 300 1 -3 37 Belgium 50 300 51 200 64 200 64 100 64 300 65 700 60 300 -8 2 20 Japan 108 500 97 700 65 500 55 700 59 100 66 400 57 300 -14 12 -47 Mexico 6 800 15 100 23 900 26 400 21 700 21 000 | 54 400 .. -3 .. Denmark 30 300 45 600 38 400 42 400 41 300 43 800 52 400 20 6 73 New Zealand 51 700 51 200 47 500 48 500 44 500 42 700 44 400 4 -4 -14 Ireland 120 400 89 700 50 700 23 900 33 700 32 100 40 200 25 -5 -67 Czech Republic 100 600 76 200 38 200 28 000 20 700 28 600 27 800 -3 38 -72 Portugal 42 800 71 000 57 300 43 800 36 900 30 700 27 000 -12 -17 -37 Finland 17 500 19 900 18 100 18 200 20 400 23 300 23 900 3 14 37
Total number of persons
All countries 4 468 900 4 176 300 3 911 500 3 809 400 3 804 000 3 773 900 3 864 100 2 -1 -14 Settlement countries 1 532 800 1 611 400 1 650 900 1 579 600 1 574 100 1 576 700 1 546 400 -2 0 1 EU included above 2 610 500 2 224 700 1 970 800 1 924 800 1 906 300 1 875 500 1 949 500 4 -2 -25
Of which:free movements 1 215 700 900 000 734 900 739 300 831 700 926 200 968 400 5 11 -20
Annual percent change
All countries -7 -6 -3 -0.1 -0.6 1.6
Settlement countries 5 2 -4 -0.3 0.2 -2
EU included above -15 -11 -2 -1 -2 4
Of which:free movements -26 -18 1 12 11 5
National statistics (unstandardised)
Chile 79 400 68 400 57 100 63 900 76 300 105 100 132 100 26 38 66 Poland 40 600 41 800 41 300 41 100 41 300 47 100 46 600 -1 14 15 Hungary 22 600 35 500 25 600 23 900 22 500 20 300 21 300 5 -10 -6 Luxembourg 15 800 16 800 14 600 15 800 19 100 19 400 19 800 2 2 25 Greece 46 300 42 900 46 500 33 400 23 200 17 700 .. .. -24 .. Slovenia 30 500 43 800 24 100 11 200 18 000 17 300 21 700 25 -4 -29 Israel 18 100 13 700 14 600 16 600 16 900 16 600 16 900 2 -2 -7 Slovak Republic 14 800 16 500 14 400 12 700 8 200 | 2 900 2 500 -14 .. .. Iceland 9 300 7 500 3 400 3 000 2 800 2 800 3 900 39 0 -58 Estonia 2 000 1 900 2 200 1 200 1 700 1 100 1 600 45 -35 -20 Turkey .. .. .. 29 900 .. .. .. .. .. ..
Total (except Greece, Turkey) 233 100 245 900 197 400 189 500 206 800 232 600 266 400
Percent change 23 5 -20 -4 9 12 15
Notes:Includes only foreign nationals; the inflows include status changes, namely persons in the country on a temporary status who
obtained the right to stay on a longer-term basis. Breaks in series are indicated with a “|”. Series for some countries have been significantly revised compared with previous editions, notably for France.
Source: OECD International Migration Database.
Permanent labour migration to OECD countries has been falling steadily since the 2008 crisis (Figure 1.2, Panel A), although the decline in 2013 was marginal (-1%). The fall in the United Kingdom (20% less) and Spain (16% less) represented a loss which was not counterbalanced by larger inflows of workers to other OECD countries. Italy contributed to somewhat offset the fall in labour migration observed in other countries when work permits, granted as part of the 2012 migrant regularisation programme, were eventually issued after a long delay. Other notable variations in labour migration flows include increases of 15% in the United States and 34% in Denmark, and a 5% fall in Canada. Outside the European Economic Area (EEA), and despite widely varying trends from one country to another, permanent labour migration has remained stable overall, as have numbers of family members accompanying migrant workers.
Figure 1.2. Permanent migration flows to OECD countries by category of entry, 2007-13
Note:Sum of standardised figures for countries where they are available (accounting for 95% of the total of flows to OECD countries). Data include changes of status from a temporary to a permanent status.
Source: OECD International migration Database.
1 2 http://dx.doi.org/10.1787/888933260734 1.5 0 2007 2008 2009 2010 2011 2012 2013 0.5 1.0 Millions Work
Panel A. Variations in categories of entry
Panel B. Categories of entry in 2013 (%) Panel C. Percentage change in categories, 2012-13 Accomp. family
of workers
Family Humanitarian Other Free movements
Accomp. family of workers 8% Family 35% Humanitarian 8% Other 5% Free movements 30% Work 14% -1.0% 2.1% -1.3% 5.6% 4.3% Work Accompanying family of workers
Family Humanitarian Free movements
As in previous years, international migration within the EU was at the same level as
immigration from third countries. Flows in free movement areas across OECD countries1
totalled 1.15 million people, up 4% compared to 2012. Germany alone drove that rise, while variations in flows to other countries cancelled each other out. The main drops were recorded in Italy (-26%) and Spain (-9%) and were counterbalanced by increases in the United Kingdom (+25%) and Switzerland (+9%).
Family migration accounted for over one-third of all permanent migration to OECD countries in 2013 (Figure 1.2, Panel B), even though it has been declining consistently for several years – it fell a further 1% in 2013 (Figure 1.2, Panel C). Nevertheless, it is still the largest single category of migration, although free-movement migration has been gradually closing in on it since 2009 and is now close to its 2007 level. The drop in family-related migration is due chiefly to falls in the United States and the United Kingdom. Only Canada, with 15 000 more arrivals, France with +7 000, and Denmark with +2 000 received significantly higher numbers of family migrants in 2013 than in 2012.
In 2013, OECD countries granted permanent residence rights to more than 300 000 humanitarian migrants – the migrant group which, at 6%, showed the highest overall increase. Many OECD countries accepted more humanitarian migrants in 2013 than in 2012. A number of them experienced 50% rises – Denmark, Germany, the Netherlands or Sweden. Humanitarian migration still accounts for more than 12% of total migration to the United States, although it declined by 20% in 2013. This decline (-30 000 persons) partly offset the increases recorded in many other countries. While the impact of the conflict in Syria and Iraq was felt in a number of countries, humanitarian migration still represents only 8.2% of total flows to the OECD, against 7.8% in 2012.
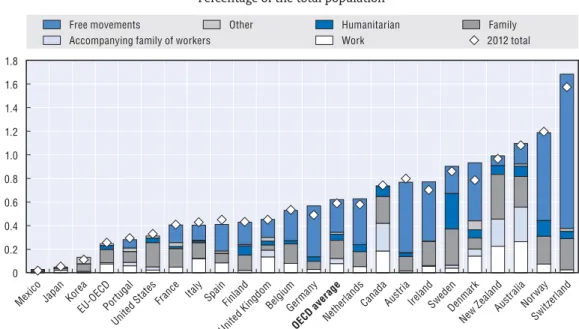
When migration flows are measured as a ratio of total populations, OECD countries received on average six permanent migrants for every thousand inhabitants in 2013 (Figure 1.3 and Annex 1.A1). The figure in some large countries – such as Mexico and Japan – remained low at less than 1 per 1 000. In many European and settlement countries,2though, it was above the 6 per 1 000 average. Switzerland, a major host country for free movement immigration, stood out with almost 17 entries per 1 000 inhabitants, followed by Norway with 12 per 1 000.
More than 75% of migrants to Switzerland, Austria, and Germany arrived from the EEA as free-movement migrants. Not counting those arrivals, EU-OECD countries received 2.4 permanent migrants per 1 000 inhabitants, down from 2.9 in 2011. At the same time, the ratio in the United States fell from 3.4 to 3.2 per 1 000.
Temporary labour migration flows
Temporary labour migration comes in addition to permanent immigration and is also an important phenomenon. Not only are flows large, but temporary migrants bring with them some critical skills. It makes a valuable contribution because it ebbs and flows with fluctuations in the market and short-term demands for high and low skills, so allowing host country labour markets to adjust to shifting economic conditions. Although temporary migration is not – initially, at least – a stepping-stone to long-term residence, it is closely tied to permanent migration (considered in the previous section). And a sizeable share of temporary migrants do manage to change status and stay on as long-term residents.
Temporary migrant workers are a mixed group – both of categories and skills. They include, for example, highly skilled engineers and information technology consultants on
assignment, together with intra-company transferees (ICT), working holidaymakers, au pairs and seasonal workers in agriculture and hospitality.
Some host countries may regard less skilled migrants as temporary. Others may include them at least in part among permanent categories. Intra-company employees, for example, may be viewed both ways. It is, in fact, difficult to determine what constitutes temporary migrant flows at the international level and statistics still fall short. Cross-border service providers, for example, move from country to country but are not clearly identified as migrants. And then there are short-term assignments where migrants may slip under the radar.
This section looks at statistics that relate to four important groups of temporary migrants that exert an effect on the labour market: seasonal workers, posted workers, working holidaymakers and trainees.
Seasonal workers
Seasonal workers are generally employed as unskilled labourers in agriculture. Their numbers were stable overall in 2012 and 2013 in the 13 main OECD host countries despite large variations across host-countries (Table 1.2). For example, the numbers increase by roughly 3% in New Zealand and North America (peaking at 14% in the United States) and fall in the EU. However, European countries actually recruit seasonal workers in neighbouring countries, and since the free movement of labour has gradually widened to the new member countries, intra-EU seasonal migrants do not require work permits any longer (with the occasional exception, still, of Romanian, Bulgarian or Croatian nationals). The epitome of that intra-EU flow of labour is Germany, where the bulk of seasonal workers are from Poland and Romania.
Figure 1.3. Permanent migration flows by category of entry to selected OECD countries, 2013
Percentage of the total population
Note:Data include changes of status from a temporary to a permanent status. Data for Mexico are estimated to take into account a backlog effect.
Source: OECD International migration Database.
1 2 http://dx.doi.org/10.1787/888933260743 1.8 0 0.2 0.4 0.6 0.8 1.0 1.2 1.4 1.6
Accompanying family of workers Work 2012 total
Free movements Other Humanitarian Family
Mexi co Japan Kor ea EU-O ECD Por tugal Unite d Sta tes Fran ce Italy Spain Finl and Unite d KingdomBe lgiu m Germany OECD aver age Nether lands Cana da Aus tria Irela nd Swed en Den mar k New ZealandAus tralia Norw ay Swit zerla nd
Posted workers and intracompany transferees
Service providers are employees or self-employed workers who cross borders to supply services for a set length of time to private individuals, firms, or governments. Unlike classic labour migrants, when they are employed, they are recruited by a company located in their origin country and not in the country where they provide their services. When self-employed, their company is generally not located in the country where services are provided. Employers and employees are generally affiliated to the social security system where the company is located. This category includes notably posted workers and intra-company transferees (ICT).
Although service providers’ jobs are often temporary, intra-company transfers may be long-term postings to manage operations or take up administrative duties in the subsidiary of an international company. In such cases, the transferee usually becomes an employee of the subsidiary in the host country. So, although the company back in the country of origin is not, strictly speaking, supplying a service, work and residence permit systems do not always distinguish between posted employees and transferees. Both are granted the same kind of permit.
ICTs have increased by 25% since 2007 and grew 6% between 2012 and 2013 alone. That constant upward trend reflects the ongoing need for talented workers. The United States is the chief ICT destination in the OECD area, even though its share of
Table 1.2. Seasonal workers who require a work permit in the main OECD host countries, 2007-13
2007 2008 2009 2010 2011 2012 2013 2013/2012
Change (%) Thousands
Seasonal workers to main non-EU OECD receiving countries
United States 51 64 60 56 55 65 74 14
Canada 23 28 23 24 25 25 28 8
Mexico 28 23 31 29 28 23 15 -35
New Zealand 7 10 8 8 8 8 8 3
Total (4 countries) 108 126 122 116 115 122 125 3
Seasonal workers within the EU (excluding workers benefiting from free mobility)
United Kingdom 17 16 20 20 20 21 21 0 Austria 12 12 12 10 18 13 15 14 Finland 14 12 13 12 12 14 14 0 Belgium 17 20 5 6 6 10 11 5 Italy 65 42 35 28 15 10 8 -22 France 19 12 7 6 6 6 6 -5 Sweden 2 4 7 5 4 6 6 4 Spain 16 42 6 9 5 4 3 -17 Germany 300 285 295 297 168 4 .. .. Total (9 countries) 461 445 399 392 253 87 83 -5 Total 568 571 521 508 368 210 209 0
Note:Data do not relate to the actual number of entries, but to the number of workers who require a work permit and were granted one. Permits are generally granted during the year for a duration of less than one year (usually six to nine months).
Free access to the labour market has been progressively given to citizens of new EU countries and therefore these series do not cover the same set of origin countries. For example, in the United Kingdom, the SAWS programme is restricted to Bulgarians and Romanians since 2008.
In Germany, most seasonal workers are recruited from Poland and therefore are not registered any more in the data since 2012.
Source: OECD International Migration Database.
transfers dropped from 62% in 2009 to 52% in 2013 (Table 1.3). The United Kingdom and Canada, by contrast, have seen their shares grow. In 2014, the EU adopted the Intra-Corporate Transfer Directive 2010/0209 to facilitate the temporary transfers of highly skilled third-country nationals from international companies to subsidiaries in the EU. Yet the United Kingdom, even though it is one of the main ICT destination countries, has not opted into the directive.
Within the European Economic Area (EEA) area, social security forms PD A1 (formerly E101) are the sole way of counting posted workers. They register the movements of European workers posted temporarily to other European countries and who remain employees of the company in their country of residence. The PD A1 certifies that people working abroad are paying social security contributions in their country of origin. Employers may request them as proof so that they do not end up paying contributions for their employees in the countries to which they have been posted (For further details on the limits of these data presented in Figure 1.4, see OECD [2011]).
The number of E101/PD A1 forms issued rose by 50% between 2005 and 2013. Following a slight dip between 2005 and 2007, the number picked up again and climbed steadily to some 1.35 million in 2013. It is worth noting that some of these forms do correspond to short stays in the receiving country. Over the same period, however, the main sending countries changed significantly with EU enlargement – i.e. new member countries issued a growing share of the certificates. Although the share of posted Polish workers has remained constant at around 20% of PD A1s since 2005, the proportion from the other new EU member countries climbed from less than 7% in 2005 to roughly 25% in 2013. The share of posted French workers, by contrast, dropped from one-third to less than 10%. Nevertheless, after Poland with 263 000 workers and Germany with 227 000, France remains the third largest sending country with 123 600 citizens on postings in Europe.
The net balance between posted workers sent and received is determined by where companies are located (Figure 1.5). Data suggest that the countries which receive more workers than they send belong to the EU15 – Germany followed by Belgium and the Netherlands. In 2013, France became a net receiving country. By contrast, the top five sending countries include four new EU member countries – Poland, Hungary, the Slovak Republic, and Romania. Portugal is the second largest net sender.
Table 1.3. Temporary intra-company transfers (ICT) to the main ICT destination countries in the OECD, 2007-13
2007 2008 2009 2010 2011 2012 2013 2013/2012 2013/2009 Thousands Change (%) United States 85 84 65 75 71 62 67 7 3 United Kingdom .. .. 13 18 21 23 26 13 95 Canada 9 10 10 14 13 14 14 3 39 Australia .. 7 6 4 8 10 9 -12 48 Germany 5 6 4 6 7 7 8 8 76 Japan 7 7 5 6 5 6 6 2 19 Total (6 countries) 106 114 104 122 126 122 129 6 25
Note:Not including transfers within the European Economic Area (EEA) as they do not require a work permit.
Source: OECD International Migration Database.
Eighteen countries (or 54% of PD A1 certificates) supply data on posted workers by sector. In 2013, for example, roughly 45% of PD A1 certificates were issued for postings in the construction sector and 23% in other fields of industry. Just under one-third were for service sector assignments and less than 2% were in agriculture and fisheries. Some three-quarters of nationals from the new EU member countries are posted to construction and manufacturing industries, while about half of all posted workers from the EU15 countries are employed in the services – primarily banking and insurance, education, and healthcare.
Only eight countries supplied data on the average lengths of postings. Although scant, the data point to wide variations in durations – from less than 40 days per annum for workers posted in France and Belgium to over 150 in Germany, Ireland and Hungary, for example.
Figure 1.4. E101/PD A1 certificates to posted workers issued by sending country or region, 2005-13
Note:The trend line includes only countries for which data are available from 2005 on.
Source:European Commission.
1 2 http://dx.doi.org/10.1787/888933260759
Figure 1.5. Net balance between posted workers sent and received within the EU, 2007 and 2013
Source:European Commission.
1 2 http://dx.doi.org/10.1787/888933260767 100 90 80 70 60 50 40 30 20 10 0 1 600 000 600 000 % 700 000 800 000 900 000 1 000 000 1 100 000 1 200 000 1 300 000 1 400 000 1 500 000 2005 2006 2007 2008 2009 2010 2011 2012 2013
Other EU15 Other EU13
Poland Germany France
Number (right-hand scale)
300 000 -300 000 - 200 000 - 100 000 100 000 0 200 000 2007 2013
Poland Germany France Other EU15
+ Switzerland + Norway
Trainees and working holidaymakers
The chief purpose of working holidays – which are widely developed in settlement countries – is to foster cultural exchange and international understanding between young people through temporary employment in a foreign country. In 2013, Australia, the United States, Canada and New Zealand were the destinations of choice for 93% of the 485 000 foreigners who migrated as working holidaymakers (Table 1.4). Australia alone accounted for half of the flow in the OECD area. Numbers of working holidaymakers have grown 13% in the last five years, with the increase as high as 62% in Australia and over 40% in Canada and New Zealand. The United States saw arrivals slump by half between 2008 and 2012,3before picking up slightly – by 8% – in 2013.
In 2013, there were 110 000 foreign paid trainees admitted into OECD countries as part of a trend that has been stable since 2009. The highest figures are recorded in Japan and Korea. However, the total figure is underestimated, as a number of countries do not distinguish between paid trainees and students.
Asylum seekers
Applications for asylum in the OECD area have increased steadily since 2010, reaching a peak in 2014 at over 800 000 (Figure 1.6). In fact, 2014 was the second-highest year in the last 35 – behind 1992, when the conflict in the Former Yugoslavia saw asylum requests swell to extremely high levels.
The number of asylum seekers across the OECD rose by 46% in 2014 over 2013, fuelled partly by the deteriorating security situation in Syria and Libya, notably. Syrian asylum seekers accounted for one-third of the increase. In fact, Syria is by far the country of origin that accounts for the most asylum seekers (Figure 1.7). They submitted some 130 000 applications to OECD countries in 2014, three times as many as in 2013. The situation has deteriorated to such an extent that, in the last quarter of 2014 alone, the industrialised countries took in as many Syrian asylum seekers as in the whole of 2013. Iraq, with nearly
Table 1.4. Migration flows of trainees and working holidaymakers, 2008-13
2008 2009 2010 2011 2012 2013 2013/12 2013/08 Thousands Change (%) Trainees OECD (22 countries) 146 113 107 113 112 110 -2 -25 Japan 102 80 78 82 86 84 -2 -18 Korea 14 11 12 13 12 12 2 -8 Germany 5 5 5 5 4 4 -3 -27 Australia 5 5 4 3 4 4 -5 -33 United States 3 2 2 2 3 3 -7 -21 Working holidaymakers OECD (22 countries) 430 403 419 414 435 485 11 13 Australia 154 188 176 185 215 249 16 62 United States 153 116 118 98 80 86 8 -43 Canada 41 45 50 55 59 59 0 44 New Zealand 40 41 45 45 51 58 13 43 United Kingdom 34 5 21 21 20 21 6 -39
Note:The table includes all the countries for which standardised data are available (see Table 1.1) with the exception of the Czech Republic.
Source: OECD International Migration Database.
65 000 applications for asylum is the country that accounts for the second largest flow. In parallel to those two war-torn countries, the number of people seeking international protection increased throughout the world. In 2014, the number of asylum seekers from Serbia (and Kosovo), Afghanistan, and Eritrea exceeded 40 000 each while applications from Ukrainians jumped from less than 1 500 in 2013 to more than 15 000 in 2014. In contrast, the number of Russians petitioning for asylum fell steeply.
As in 2013, Germany was the country that saw the highest numbers of asylum applications in 2014 – and the greatest increase (up 63 000). It alone accounts for one-fifth of all applications in the OECD (Table 1.5). The number of Russians seeking asylum in
Figure 1.6. New asylum applications since 1980 in the OECD Thousands
Source:UNHCR.
1 2 http://dx.doi.org/10.1787/888933260776
Figure 1.7. New asylum applications from Syrians in 44 industrialised countries, Q1 2011 to Q4 2014
Thousands
Note:The 44 countries are the 28 member countries of the EU, Albania, Bosnia-Herzegovina, Iceland, Liechtenstein, Montenegro, Norway, Serbia (and Kosovo), Switzerland, the former Yugoslav Republic of Macedonia (FYROM), Turkey, Australia, Canada, Japan, New Zealand, Korea, and the United States. In total, these countries received 865 000 asylum applications in 2014. Source:UNHCR. 1 2 http://dx.doi.org/10.1787/888933260786 900 0 100 200 300 400 500 600 700 800 1980 1982 1984 1986 1988 1990 1992 1994 1996 1998 2000 2002 2004 2006 2008 2010 2012 2014 OECD EU 60 0 10 20 30 40 50 2011 2012 2013 2014 Q1 Q2 Q3 Q4 Q1 Q2 Q3 Q4 Q1 Q2 Q3 Q4 Q1 Q2 Q3 Q4
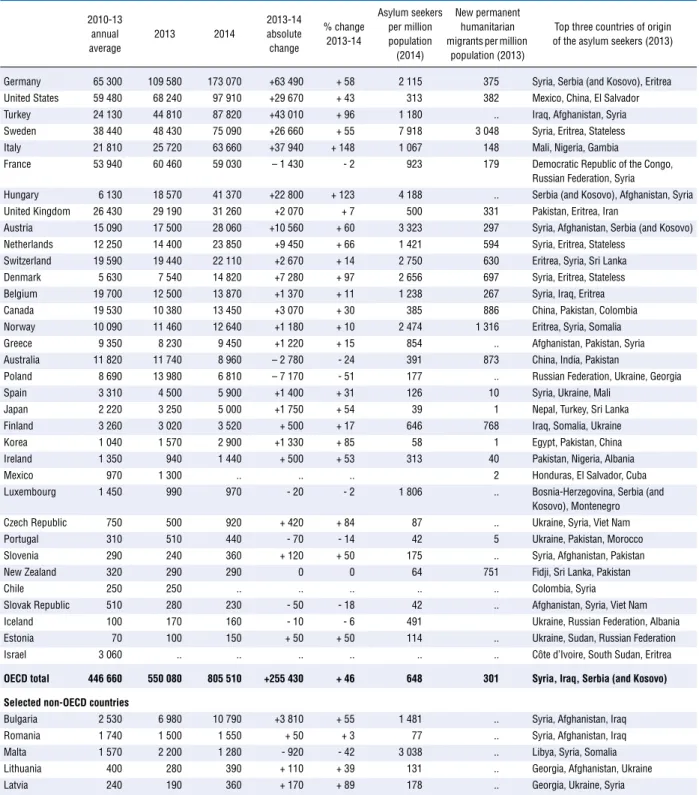
Table 1.5. Asylum seeker applications by country of destination, 2010-14 2010-13 annual average 2013 2014 2013-14 absolute change % change 2013-14 Asylum seekers per million population (2014) New permanent humanitarian migrants per million
population (2013)
Top three countries of origin of the asylum seekers (2013)
Germany 65 300 109 580 173 070 +63 490 + 58 2 115 375 Syria, Serbia (and Kosovo), Eritrea United States 59 480 68 240 97 910 +29 670 + 43 313 382 Mexico, China, El Salvador Turkey 24 130 44 810 87 820 +43 010 + 96 1 180 .. Iraq, Afghanistan, Syria Sweden 38 440 48 430 75 090 +26 660 + 55 7 918 3 048 Syria, Eritrea, Stateless Italy 21 810 25 720 63 660 +37 940 + 148 1 067 148 Mali, Nigeria, Gambia
France 53 940 60 460 59 030 – 1 430 - 2 923 179 Democratic Republic of the Congo, Russian Federation, Syria
Hungary 6 130 18 570 41 370 +22 800 + 123 4 188 .. Serbia (and Kosovo), Afghanistan, Syria United Kingdom 26 430 29 190 31 260 +2 070 + 7 500 331 Pakistan, Eritrea, Iran
Austria 15 090 17 500 28 060 +10 560 + 60 3 323 297 Syria, Afghanistan, Serbia (and Kosovo) Netherlands 12 250 14 400 23 850 +9 450 + 66 1 421 594 Syria, Eritrea, Stateless
Switzerland 19 590 19 440 22 110 +2 670 + 14 2 750 630 Eritrea, Syria, Sri Lanka Denmark 5 630 7 540 14 820 +7 280 + 97 2 656 697 Syria, Eritrea, Stateless Belgium 19 700 12 500 13 870 +1 370 + 11 1 238 267 Syria, Iraq, Eritrea Canada 19 530 10 380 13 450 +3 070 + 30 385 886 China, Pakistan, Colombia Norway 10 090 11 460 12 640 +1 180 + 10 2 474 1 316 Eritrea, Syria, Somalia Greece 9 350 8 230 9 450 +1 220 + 15 854 .. Afghanistan, Pakistan, Syria Australia 11 820 11 740 8 960 – 2 780 - 24 391 873 China, India, Pakistan
Poland 8 690 13 980 6 810 – 7 170 - 51 177 .. Russian Federation, Ukraine, Georgia Spain 3 310 4 500 5 900 +1 400 + 31 126 10 Syria, Ukraine, Mali
Japan 2 220 3 250 5 000 +1 750 + 54 39 1 Nepal, Turkey, Sri Lanka Finland 3 260 3 020 3 520 + 500 + 17 646 768 Iraq, Somalia, Ukraine Korea 1 040 1 570 2 900 +1 330 + 85 58 1 Egypt, Pakistan, China Ireland 1 350 940 1 440 + 500 + 53 313 40 Pakistan, Nigeria, Albania
Mexico 970 1 300 .. .. .. 2 Honduras, El Salvador, Cuba
Luxembourg 1 450 990 970 - 20 - 2 1 806 .. Bosnia-Herzegovina, Serbia (and Kosovo), Montenegro Czech Republic 750 500 920 + 420 + 84 87 .. Ukraine, Syria, Viet Nam
Portugal 310 510 440 - 70 - 14 42 5 Ukraine, Pakistan, Morocco
Slovenia 290 240 360 + 120 + 50 175 .. Syria, Afghanistan, Pakistan
New Zealand 320 290 290 0 0 64 751 Fidji, Sri Lanka, Pakistan
Chile 250 250 .. .. .. .. .. Colombia, Syria
Slovak Republic 510 280 230 - 50 - 18 42 .. Afghanistan, Syria, Viet Nam Iceland 100 170 160 - 10 - 6 491 Ukraine, Russian Federation, Albania Estonia 70 100 150 + 50 + 50 114 .. Ukraine, Sudan, Russian Federation
Israel 3 060 .. .. .. .. .. .. Côte d’Ivoire, South Sudan, Eritrea
OECD total 446 660 550 080 805 510 +255 430 + 46 648 301 Syria, Iraq, Serbia (and Kosovo)
Selected non-OECD countries
Bulgaria 2 530 6 980 10 790 +3 810 + 55 1 481 .. Syria, Afghanistan, Iraq Romania 1 740 1 500 1 550 + 50 + 3 77 .. Syria, Afghanistan, Iraq Malta 1 570 2 200 1 280 - 920 - 42 3 038 .. Libya, Syria, Somalia Lithuania 400 280 390 + 110 + 39 131 .. Georgia, Afghanistan, Ukraine
Latvia 240 190 360 + 170 + 89 178 .. Georgia, Ukraine, Syria
Note:Figures for the United States refer to “affirmative” claims submitted with the Department of Homeland Security (number of cases) and “defensive” claims submitted to the Executive Office for Immigration Review (number of people). The symbol “..” stands for “not available”.
Source:UNHCR andOECD International Migation Database.
Germany dropped sharply, with most applications coming from Syria, Serbia (and Kosovo), Eritrea. Behind Germany came the United States, Turkey, Sweden, and Italy. All received 40% more asylum requests than in 2013, while France, which ranked third in 2013, is now sixth and was the only top-ten country not to have experienced a rise in asylum applications. In Turkey, Italy and Hungary, by contrast, they doubled from 2013 to 2014, reaching an unprecedented high. Asylum seekers cover a very wide range of nationalities: in Turkey, they are Iraqi, Afghan, and Syrian; in Hungary, from Serbia (and Kosovo), Syria, and Afghanistan; and Italy from sub-Saharan African countries like Mali, Nigeria, and Gambia.
Comparisons of ratios of asylum-seeker entries to host country populations reveal that the OECD registered 650 new applications per million inhabitants in 2014. Sweden received the highest number of applications as a proportion of its population, with 7 900 requests per million people. Hungary and Austria also received over 3 000 asylum seekers for one million inhabitants. Although small countries generally have the highest rates of asylum seeker per capita, Germany was also among the top asylum receiving country with a ratio of 2 100 per million. In contrast, France and the United Kingdom receive less asylum seekers relative to their total population, with 900 and 500 applications per million of inhabitants, respectively.
International students
Unlike the fluctuating flows of temporary labour migrants, the number of students who pursue their tertiary education abroad rises year by year worldwide. In 2012, 4.5 million round the globe studied in countries of which they were not nationals – a number that had more than doubled since 2001 (Figure 1.8). Three-quarters, or 3.4 million, resided in OECD countries which, though still the most attractive to students, were less so than in the mid-2000s when they drew 80% of all foreign students. The rate of increase in
Figure 1.8. Foreign students worldwide and in OECD countries, 2000-12 Millions
Note:This figure refers to students of foreign nationality, which is not necessarily the same thing as international students. Students are considered “international” when they leave their country of origin for another country with the intention of studying there. Data on international students are not available until 2008 for most countries. Source: OECD Education Database,www.oecd.org/education/database.htm.
1 2 http://dx.doi.org/10.1787/888933260799 2000 2001 2002 2003 2004 2005 2006 2007 2008 2009 2010 2011 2012 Millions 1.6 1.6 1.9 2.1 2.3 2.4 2.4 2.5 2.6 2.8 3.2 3.3 3.4 2.1 2.1 2.4 2.6 2.8 3.0 3.1 3.2 3.5 3.8 4.2 4.4 4.5
the number of foreign students in the OECD area fell from over 8% per annum between 2000 and 2005 to just over 3% between 2011 and 2012. Countries in the rest of the world boast stronger international student growth rates.
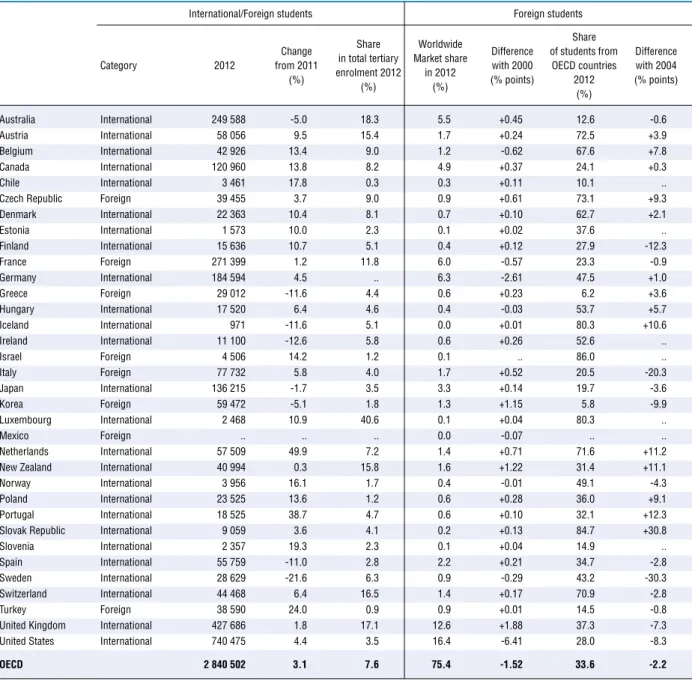
Among OECD countries, the United States and United Kingdom alone account for two-thirds of the world’s international students. With 740 000 in 2012 – a year-on-year rise of 4% – the United States is by far the most popular country. The United Kingdom boasts 430 000 international students which, given its size, makes it one of the most globally attractive destinations. Next in line come France and Australia where around 250 000 international students were living in 2012 (Table 1.6).
Table 1.6. Numbers of international tertiary-level students in OECD countries in 2012
International/Foreign students Foreign students
Category 2012 Change from 2011 (%) Share in total tertiary enrolment 2012 (%) Worldwide Market share in 2012 (%) Difference with 2000 (% points) Share of students from OECD countries 2012 (%) Difference with 2004 (% points) Australia International 249 588 -5.0 18.3 5.5 +0.45 12.6 -0.6 Austria International 58 056 9.5 15.4 1.7 +0.24 72.5 +3.9 Belgium International 42 926 13.4 9.0 1.2 -0.62 67.6 +7.8 Canada International 120 960 13.8 8.2 4.9 +0.37 24.1 +0.3 Chile International 3 461 17.8 0.3 0.3 +0.11 10.1 ..
Czech Republic Foreign 39 455 3.7 9.0 0.9 +0.61 73.1 +9.3
Denmark International 22 363 10.4 8.1 0.7 +0.10 62.7 +2.1 Estonia International 1 573 10.0 2.3 0.1 +0.02 37.6 .. Finland International 15 636 10.7 5.1 0.4 +0.12 27.9 -12.3 France Foreign 271 399 1.2 11.8 6.0 -0.57 23.3 -0.9 Germany International 184 594 4.5 .. 6.3 -2.61 47.5 +1.0 Greece Foreign 29 012 -11.6 4.4 0.6 +0.23 6.2 +3.6 Hungary International 17 520 6.4 4.6 0.4 -0.03 53.7 +5.7 Iceland International 971 -11.6 5.1 0.0 +0.01 80.3 +10.6 Ireland International 11 100 -12.6 5.8 0.6 +0.26 52.6 .. Israel Foreign 4 506 14.2 1.2 0.1 .. 86.0 .. Italy Foreign 77 732 5.8 4.0 1.7 +0.52 20.5 -20.3 Japan International 136 215 -1.7 3.5 3.3 +0.14 19.7 -3.6 Korea Foreign 59 472 -5.1 1.8 1.3 +1.15 5.8 -9.9 Luxembourg International 2 468 10.9 40.6 0.1 +0.04 80.3 .. Mexico Foreign .. .. .. 0.0 -0.07 .. .. Netherlands International 57 509 49.9 7.2 1.4 +0.71 71.6 +11.2
New Zealand International 40 994 0.3 15.8 1.6 +1.22 31.4 +11.1
Norway International 3 956 16.1 1.7 0.4 -0.01 49.1 -4.3
Poland International 23 525 13.6 1.2 0.6 +0.28 36.0 +9.1
Portugal International 18 525 38.7 4.7 0.6 +0.10 32.1 +12.3
Slovak Republic International 9 059 3.6 4.1 0.2 +0.13 84.7 +30.8
Slovenia International 2 357 19.3 2.3 0.1 +0.04 14.9 ..
Spain International 55 759 -11.0 2.8 2.2 +0.21 34.7 -2.8
Sweden International 28 629 -21.6 6.3 0.9 -0.29 43.2 -30.3
Switzerland International 44 468 6.4 16.5 1.4 +0.17 70.9 -2.8
Turkey Foreign 38 590 24.0 0.9 0.9 +0.01 14.5 -0.8
United Kingdom International 427 686 1.8 17.1 12.6 +1.88 37.3 -7.3
United States International 740 475 4.4 3.5 16.4 -6.41 28.0 -8.3
OECD 2 840 502 3.1 7.6 75.4 -1.52 33.6 -2.2
Note:The “Foreign” category refers to students of foreign nationality, which is not necessarily the same thing as international students. Students are considered “international” when they leave their country of origin for another country with the intention of studying there. Source: OECD Education Database,www.oecd.org/education/database.htm.
The number of international students in tertiary education in the OECD climbed 3% between 2011 and 2012. The rise was particularly steep in the Netherlands, where the number doubled in 2012, and in Portugal, up 39% on 2011. Turkey, too, saw its inflow of international students increase by a quarter. Australia, Spain, and Sweden, by contrast, registered year-on-year falls in 2012. At 22%, the drop was particularly marked in Sweden. International students account for an average of 8% of the OECD tertiary-level student population. In some countries, the foreign presence is vital to the survival of the university system. In Luxembourg, for example, international students account for 40% of all students in higher education. In Australia, the United Kingdom, Switzerland, New Zealand and Austria, one student in six at university level is from abroad. In the United States, however, where they are more numerous than anywhere else, they constitute only a 3.5% share of university-level students.
As international students could well be the skilled foreign workers of the future, countries compete to lure them. And although the United States exerts by far the greatest appeal, its share of the world market for foreign students fell six percentage points between 2000 and 2012. It also fell by a half-point in major immigrant destination countries like Germany, Belgium, and France. The lure of the United Kingdom, by contrast, has grown constantly since 2000, and its share of the global market has grown more than that of any other OECD country over the period. Interestingly, two countries which boast relatively small shares of the foreign student market – Korea and New Zealand – saw those shares increase nine fold and fourfold, respectively.
Although on average one-third of all students in higher education in OECD countries hail from another OECD member country, the situation varies widely from country to country. The proportion of foreigners from an OECD country who move to Europe to study has mounted steadily since 2004 and currently stands at one in two. France, Italy, Greece and Slovenia buck the trend, however, as less than 25% of their student populations are
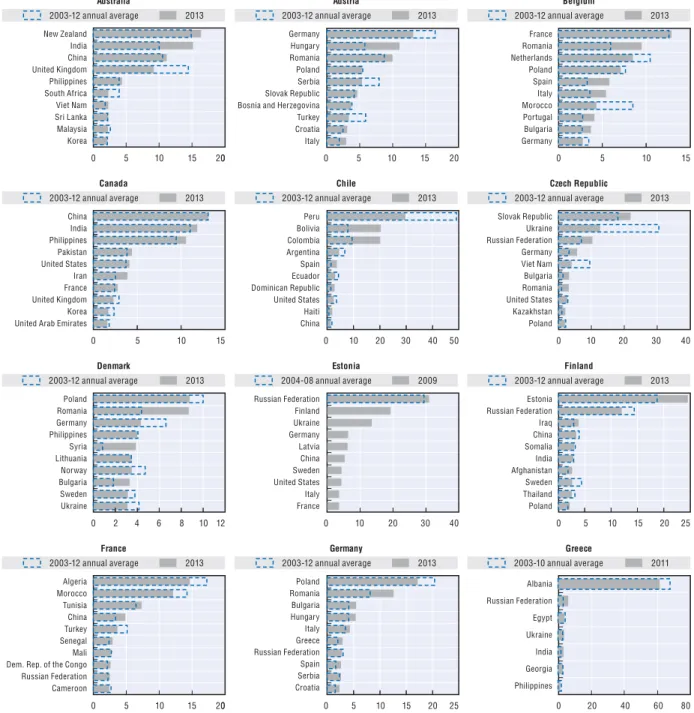
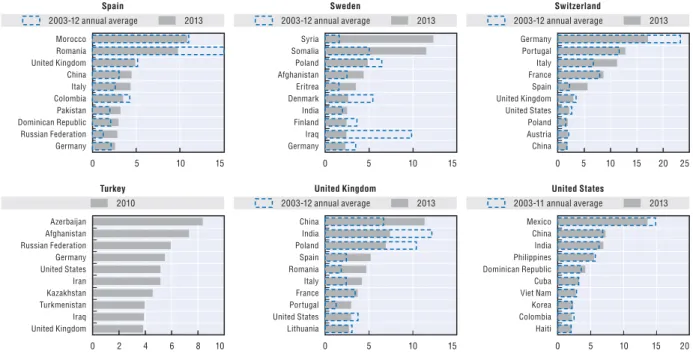
Figure 1.9. Main countries of origin of tertiary-level students in OECD countries, 2008 and 2012
Percentages of all international tertiary-level students
Source: OECD Education Database,www.oecd.org/education/database.htm.
1 2 http://dx.doi.org/10.1787/888933260806 25 20 15 10 5 0 2008 2012 Chin a Indi a Germany Kor ea Fran ce Saud i Ara bia Viet Nam Mala ysia Uni ted S tate s Italy Cana da Moroc co Russ ian F eder atio n Slov ak Republi c Japan
from the OECD area. In non-European OECD countries like Australia, Japan, Korea and Turkey, the vast majority of tertiary-level foreign students are from non-OECD countries. Generally speaking, in fact, non-European OECD countries attract less and less students from non-OECD countries. Italy, too, has lost its draw, with the share of OECD-national students falling by half between 2004 and 2012.
Most international students in higher education in the OECD originate from Asia – 22% from China, 6% from India, and 4% from Korea (Figure 1.9). German and French students – at 4% and 2% – account for the highest shares of those from Europe in OECD universities. Only one African country, Morocco, is in the top 15 international student sending countries. The share of Chinese students, who are already the most numerous in the OECD, has climbed continuously in recent years – by 3.4 points between 2008 and 2012. The same is true of students from Saudi Arabia, whose share doubled over the same period. The proportion of Indian and Japanese students at university in an OECD country, by contrast, slipped by over one percentage point.
International migrants’ countries of origin
Discussion of permanent and temporary migration in previous sections has been based on standardised definitions designed to make the scale and composition of migration comparable across countries. With the exception of a handful of countries, however, no such standardised data are yet available by country or region of origin. And although information on migrants is generally available from national population registers, what constitutes a “migrant” varies widely from country to country. Adding up and deriving trends from register-based data (as in Table 1.7) is therefore not without caveats. Although the figures in the table should be treated with caution, they do offer an indication of the magnitude and make-up of flows by country of origin.
China is the country from which most new immigrants to OECD countries originate. It accounted for about one in ten migrants in 2013. It is hardly surprising to see China top the list of countries of origin given the size of its population. More remarkable is to see India appear in fourth position only, with 4.4% of the flows and an expatriation rate to OECD countries twice lower than China.
Freedom of movement within the EU result in Romania and Poland supplying the second- and third-largest contingents of immigrants in 2013 – at 5.5% and 5.3%, respectively. The figures are stable compared to 2012 or even 2011, but well below their level in the mid-2000s, especially for Romania. Among the top ten countries of origin, emigration from Mexico and the Philippines to OECD countries was down on 2012, but rose steeply in Italy with almost twice as many Italians emigrating to another OECD country in 2013 as in 2007. Outflows from several other OECD countries – such as Spain, France and the United States – also exhibited a rising trend over the period. Overall, intra-OECD immigration accounted for about one-third of the total in 2013.
Migration from Europe to OECD countries has increased since 2009, making Europe the region of origin that accounted for the highest share of flows, at over 39%, in 2013 (32% for the EU alone). Migration from Asia peaked in 2011, but Asian citizens still represent approximately one-third of migrants to OECD countries. The weight of other regions (Americas, Africa) in OECD immigration has been stable since 2011.