City of
Fort Walton
Beach
2020 Impact Fee and Connection Fee
Study
August 11, 2020 Mr. Daniel Payne
Public Works & Utility Services Director City of Fort Walton Beach
107 Miracle Strip Pkwy SW Fort Walton Beach, FL 32548
Subject: 2020 Impact Fee and Connection Fee Study Dear Mr. Payne,
Enclosed is the 2020 impact fee and connection fee study report for your use and reference. The attached report includes technical sections regarding the calculation of each of the impact fees and additional background information. If you should have any questions, please do not hesitate to contact me at 407-960-1806. We appreciate the opportunity to work with you and the City on this important project.
Respectfully Submitted,
Joe Williams Manager
Table of Contents
SECTION 1 – INTRODUCTION... 1
INTRODUCTION ... 1
IMPACT FEE BACKGROUND ... 2
FINDINGS AND RECOMMENDATIONS ... 4
SECTION 2 – WATER IMPACT FEE ... 5
INTRODUCTION ... 5
EXISTING WATER IMPACT FEES ... 5
IMPACT FEE METHODOLOGIES ... 5
DESIGN OF WATER IMPACT FEE ... 6
WATER IMPACT FEE CALCULATION ... 8
WATER IMPACT FEE COMPARISON ... 8
SECTION 3 – WASTEWATER IMPACT FEE ... 10
INTRODUCTION ... 10
EXISTING WASTEWATER IMPACT FEES ... 10
IMPACT FEE METHODOLOGIES ... 10
DESIGN OF WASTEWATER IMPACT FEE ... 10
WASTEWATER IMPACT FEE CALCULATION ... 12
WASTEWATER IMPACT FEE COMPARISON ... 13
SECTION 4 – CONNECTION FEES ... 14
INTRODUCTION ... 14
EXISTING WATER CONNECTION FEES ... 14
WATER CONNECTION FEE CALCULATION ... 14
EXISTING WASTEWATER CONNECTION FEES ... 15
List of Tables and Figures
Table 1: Existing and Calculated Single Family Residential Impact Fees ... 1
Table 2: Existing and Calculated Water Connection Fee (3/4-inch Meter) ... 2
Figure 1: Combined Impact Fee Comparison – Single Family Residential ... 3
Table 3: Water Level of Service per ERC ... 6
Table 4: Water Fixed Asset Valuation ... 7
Table 5: Water Impact Fee Calculation ... 8
Figure 2: Water Impact Fee Comparison – Single Family Residential ... 9
Table 6: Wastewater Level of Service per ERC ... 11
Table 7: Wastewater Fixed Asset Valuation ... 11
Table 8: Wastewater Impact Fee Calculation ... 12
Figure 3: Wastewater Impact Fee Comparison – Single Family Residential... 13
Table 9: Existing Water Connection Fees ... 14
Table 10: Water Connection Fee Calculation – Inside City ... 15
Table 11: Water Connection Fee Calculation – Inside City Cont. ... 15
Table 12: Existing Wastewater Connection Fees ... 16
Table 13: Water Connection Fee Comparison – Inside City 3/4-Inch Meter ... 16
Table 14: Sanitary Sewer Connection Fee Comparison – Single-Family Residential ... 17
List of Exhibits
Exhibit 1: Existing & Calculated Water & Wastewater Impact Fees Exhibit 2: Water Service Connection Fees Cost Buildup
Section 1
–
Introduction
Introduction
The City of Fort Walton Beach, Florida (City) is located in the northwestern part of the state and provides utility service to approximately 9,800 potable water customers and 9,300 wastewater customers throughout the service area, which are largely within City limits. There are a limited number of water customers located outside of City limits. The City has retained Raftelis Financial Consultants, Inc. (Raftelis) to review and update the City’s water and wastewater impact fees along with the water connection fees. Impact fees are an important source of income for municipalities to fund infrastructure costs related to growth. The study herein is based on the costs to provide the necessary infrastructure to meet the demands of growth based on data specific to each service and related to the
City’s characteristics. The calculated impact fees set forth in this study are consistent with Florida case law, Florida
Statutes, and generally acceptable impact fee methodologies.
In recent years the City has adopted and extended ordinances that provide for reduced impact fee levels. The most recent extension was through Ordinance 2021, that provides for a 75% reduction to the water and wastewater impact fees for connections within City limits effective January 28, 2020 for the period of one year. The City is in a situation where vacant land available for new development is minimal and growth will primarily result from increased density from re-development and some infill development. While impact fees can still be a valuable source of revenue, the City is not anticipating major utility expansion needs.
The report herein outlines the methodologies, assumptions, and considerations in the development of the water and wastewater impact fee calculation. The following table summarizes the City’s existing single family residential impact fees compared to the calculated impact fees based on the analysis in this report.
Table 1: Existing and Calculated Single Family Residential Impact Fees Impact Fee Existing [1] Calculated Difference
Water $700.00 $1,880.00 $1,180.00
Wastewater $807.00 $600.00 ($207.00)
Total $1,507.00 $2,480.00 $973.00
[1] Amount shown is for the full fee level, prior to the 75% reduction.
As shown above, the calculated water impact fee level is higher than the existing levels, while the calculated wastewater impact fee is reduced. It is important to note that the calculated impact fee levels represent the maximum amount that can be justified through the approach used for this study. The City has the authority to adopt a fee level lower than and up to the maximum fee calculated, as shown on Table 1. In total, the single family residential fee level can be increased by $973 per dwelling unit.
The calculated water connection fees are based on the labor, materials and equipment required to connect a new water meter to the distribution system. This is a cost that is passed on to each new connection, at the time of connection, as a one-time fee. The purpose of charging this fee is to not burden existing customers with the unique and additional cost of each new connection. The calculated and existing water connection fee for a typical single family service connection of a 3/4-inch meter is provided on the table below and can be increased up to $1,071.
Table 2: Existing and Calculated Water Connection Fee (3/4-inch Meter)
Impact Fee Existing Calculated Difference
Water 3/4-inch Meter $700.00 $1,071.00 $371.00
Impact Fee Background
Impact fees are one-time charges established as a means to recover in whole or in part, the costs associated with infrastructure and capital equipment needed to accommodate the demands generated by new development. Such capital costs generally include the construction of improvements together with general plant, engineering, administration, surveying, land, legal and financing costs for utility fees. Historically, impact fees in Florida were a result of home rule powers with the requirements associated with the development, administration, accounting and expenditure governed by case law. However, in 2006, Section 163.31801 was added to the Florida Statues, which placed specific requirements and limitations on that home rule authority. Florida Statutes Section 163.31801 F.S., as amended most recently in 2019, is currently as follows:
163.31801 Impact fees; short title; intent; minimum requirements; audits; challenges.—
(1) This section may be cited as the “Florida Impact Fee Act.”
(2) The Legislature finds that impact fees are an important source of revenue for a local government to use in funding the infrastructure necessitated by new growth. The Legislature further finds that impact fees are an outgrowth of the home rule power of a local government to provide certain services within its jurisdiction. Due to the growth of impact
fee collections and local governments’ reliance on impact fees, it is the intent of the Legislature to ensure that, when
a county or municipality adopts an impact fee by ordinance or a special district adopts an impact fee by resolution, the governing authority complies with this section.
(3) At a minimum, an impact fee adopted by ordinance of a county or municipality or by resolution of a special district must satisfy all of the following conditions:
(a) The calculation of the impact fee must be based on the most recent and localized data.
(b) The local government must provide for accounting and reporting of impact fee collections and expenditures. If a local governmental entity imposes an impact fee to address its infrastructure needs, the entity must account for the revenues and expenditures of such impact fee in a separate accounting fund.
(c) Administrative charges for the collection of impact fees must be limited to actual costs.
(d) The local government must provide notice not less than 90 days before the effective date of an ordinance or resolution imposing a new or increased impact fee. A county or municipality is not required to wait 90 days to decrease, suspend, or eliminate an impact fee.
(e) Collection of the impact fee may not be required to occur earlier than the date of issuance of the building permit for the property that is subject to the fee.
(f) The impact fee must be proportional and reasonably connected to, or have a rational nexus with, the need for additional capital facilities and the increased impact generated by the new residential or commercial construction. (g) The impact fee must be proportional and reasonably connected to, or have a rational nexus with, the expenditures of the funds collected and the benefits accruing to the new residential or nonresidential construction. (h) The local government must specifically earmark funds collected under the impact fee for use in acquiring, constructing, or improving capital facilities to benefit new users.
(i) Revenues generated by the impact fee may not be used, in whole or in part, to pay existing debt or for previously approved projects unless the expenditure is reasonably connected to, or has a rational nexus with, the increased impact generated by the new residential or nonresidential construction.
(4) The local government must credit against the collection of the impact fee any contribution, whether identified in a proportionate share agreement or other form of exaction, related to public education facilities, including land dedication, site planning and design, or construction. Any contribution must be applied to reduce any education-based impact fees on a dollar-for-dollar basis at fair market value.
(5) If a local government increases its impact fee rates, the holder of any impact fee credits, whether such credits are granted under s. 163.3180, s. 380.06, or otherwise, which were in existence before the increase, is entitled to the full benefit of the intensity or density prepaid by the credit balance as of the date it was first established. This subsection
(6) Audits of financial statements of local governmental entities and district school boards which are performed by a certified public accountant pursuant to s. 218.39 and submitted to the Auditor General must include an affidavit signed by the chief financial officer of the local governmental entity or district school board stating that the local governmental entity or district school board has complied with this section.
(7) In any action challenging an impact fee or the government’s failure to provide required dollar-for-dollar credits for the payment of impact fees as provided in s. 163.3180(6)(h)2.b., the government has the burden of proving by a preponderance of the evidence that the imposition or amount of the fee or credit meets the requirements of state legal precedent and this section. The court may not use a deferential standard for the benefit of the government.
(8) A county, municipality, or special district may provide an exception or waiver for an impact fee for the development or construction of housing that is affordable, as defined in s. 420.9071. If a county, municipality, or special district provides such an exception or waiver, it is not required to use any revenues to offset the impact. (9) This section does not apply to water and sewer connection fees.
Based on the criteria provided above, the impact fees herein will: 1) include local current costs of improvements associated with the capacities needed to serve new growth; 2) be calculated based on the rational nexus of new development and the need for additional capital facilities; 3) not reflect costs of improvements associated with the renewal and replacement (R&R) of existing capital assets or correction of deficiencies in level of service attributed to existing development; and 4) not include costs of operation and maintenance of the capital improvements and equipment.
This section provides only a general background regarding impact fees. Certain circumstances and issues regarding the interpretation of specific statutes or case law should be addressed by qualified legal counsel.
Figure 1: Combined Impact Fee Comparison – Single Family Residential
As shown above, the City’s calculated water and wastewater impact fees are comparable to the impact fees charged
by other nearby communities. The City’s combined impact fee level of $2,480 is below the $4,404 average of the other utilities. The primary factor contributing to the City’s lowers fees is the lack of wastewater treatment assets, as discussed later in this report.
$725 $1,507 $1,746 $1,900 $2,296 $2,447 $2,480 $2,813 $3,630 $4,000 $4,000 $4,127 $4,780 $7,100 $7,380 $7,603 $7,917 $8,000
$0 $1,000 $2,000 $3,000 $4,000 $5,000 $6,000 $7,000 $8,000 $9,000
DeFuniak Springs Fort Walton Beach - Existing City of Chipley City of Marianna City of Panama City E.C.U.A. - Mainland Fort Walton Beach - Calculated Bay County City of Tallahassee City of Valparaiso Okaloosa County City of Panama City Beach Destin Gulf Breeze City of Niceville South Walton Regional Utilities
Findings and Recommendations
The following is a summary of the observations and recommendations following our investigation, analyses, and preparation of this report:
1. The establishment of impact fees must satisfy the rational nexus requirements as determined by case law and Florida Statutes. The impact fees must be reasonably related to the cost of providing capital facilities/ equipment needed to accommodate new growth. The impact fees collected must be used by the City to address the capital costs related to serving new development. Based on the information made available by the City, the calculated impact fees are designed to meet these precedents and the requirements set forth in Florida Statutes Section 163.31801.
2. The fees developed within this report reflect recovery of identified costs and the City has discretion to phase-in or otherwise adopt less than the fully calculated fees. However, the adoption of fees less than the fully calculated rates should be applied to all land uses equally in order to maintain the calculations herein in correct proportion. Adopting less than the calculated rates would increase the reliance on existing utility customers, general fund, and/or other revenue sources to meet the demands of growth.
3. Pursuant to Florida Statute Section 163.31801, the City must provide notice no less than 90 days before the effective date of an ordinance or resolution imposing a new or increased impact fee.
4. In compliance with Florida Statutes the City should collect and maintain revenue from each type of utility impact fee in designated sub-accounts, and use such fees on those facilities designated for each purpose.
5. The water connection fees have been calculated based on data provided by City staff. The City should consider implementation of this fee as calculated in Section 4 to ensure full and equitable cost recovery for each new service connection.
6. The City should restructure the application of water and wastewater connection fees to eliminate the per unit basis for multi-unit connections and should eliminate the front footage calculation for wastewater connection fees.
Section 2
–
Water Impact Fee
Introduction
Water impact fees are one-time charges collected from new water customers or developers to recover a proportional share of the capital costs incurred by the City to provide water capacity for new customers. This capacity may be already constructed, funded, and available in existing facilities, or the service capacity may be planned and included as future capital projects in a capital improvement plan (CIP). Impact fees are an important funding mechanism to ensure justifiable cost recovery and to limit the burden of water ratepayers funding growth-related projects.
This section of the report includes a review of the City’s existing water impact fee and discusses the updated calculation of the water impact fees. Additionally, this section includes a comparison of the existing and calculated fees with other nearby utilities.
Existing Water Impact Fees
The City’s existing water impact fees were last updated in 2004 and are charged to new customers for connection to
the City’s water system. Single family residential customers are charged $700.00 for each new dwelling unit, and
commercial, industrial, and all other residential customers are assessed the impact fee as shown in Exhibit 1 at the end of this report.
Impact Fee Methodologies
There are numerous approaches to determining impact fees that have been adopted by water utilities across the state of Florida and the country. However, two approaches are most often used and are recognized in the industry as cost-justified by the American Water Works Association (AWWA) and Water Environmental Federation (WEF)1. These
two approaches are the System Buy-In method and the Incremental Cost method.
Under the System Buy-In method, impact fees are based upon the “buy-in” concept that existing users, through service charges and other up-front charges, have developed a valuable public capital facility. This method is appropriate for utility systems, or components of utility systems, with additional capacity already in place, and provides an estimate of the cost of providing a unit of capacity based upon the net equity of the existing assets. This method calculates a fee based upon the proportional cost of each user’s share of the existing system capacity available for new customers. The costs of the facilities are based on a review of fixed asset records and can be based on original asset costs, or may include escalation of the original asset costs to current dollars. Excluded from the calculation are local service lines that are dedicated to serving only existing customers, vehicle and minor equipment costs, and assets contributed by or paid for by developers.
The Incremental Cost method focuses on the cost of adding additional facilities to serve new customers. It is most appropriate in situations where additional capacity and/or trunk line extensions/expansions to provide service to new customers and the costs of the capacity can be tied to an approved CIP or master plan. Under this method, it is important that any proposed capital projects required to address deficiencies in the existing facilities be excluded
from the determination of the impact fee. This includes projects required to meet new or existing regulatory requirements and/or renewals and replacements of existing facilities.
The impact fee calculated in this report is based on the System Buy-In method since this approach takes into consideration that the City has a significant investment in existing assets, currently has available capacity in these existing facilities, and is not planning for any major plant or line capacity expansion projects.
Design of Water Impact Fee
Two significant components need to be addressed in the design of the water impact fees: 1) the level of service to be apportioned to the applicants that request system capacity; and 2) the amount of capital costs to be recovered from a new customer requesting service. Both of these issues are related to the level of the impact fee expressed on an equivalent residential connection (ERC) basis which represents the average capacity required to service a typical individually metered single family residential account.
Level of Service Requirements
Level of service (LOS) is an indicator of the amount of service provided by, or proposed to be provided by, a facility based on and related to the operational characteristics of the facility. LOS indicates the capacity per unit of demand for each public facility. The LOS commonly used for water service is the amount of flow (usually gallons) allocable to each ERC expressed on a daily basis. The LOS generally represents the amount of capacity allocable to an ERC, whether such capacity is actually used or not (commonly referred to as “readiness to serve”). An ERC is representative of the average capacity required to service a typical individually metered single family residential account. This class of users typically utilizes a 5/8” or 3/4” meter and represents the largest customer class served by a public utility and generally the lowest level of usage requirements for a specifically metered account.
The following table summarizes the level of service standards that were incorporated into this water impact fee analysis. As shown below, the LOS per ERC is 350 gallons per day.
Table 3: Water Level of Service per ERC
Service
Gallons per Day per ERC
Water 350
Capital Costs Recovered Buy-In Value
Water impact fees typically include the growth-related infrastructure costs associated with water supply, treatment, and transmission. The City has made a substantial investment in these types of facilities with capacity available for new users. According to the City’s Water Use Permit (WUP), the City is authorized to make an average annual withdrawal of 3.600 million gallons per day (MGD) of groundwater from the Floridan aquifer for public supply use, 0.054 MGD of groundwater from the Sand and Gravel aquifer for golf course irrigation use, and 0.193 MGD of groundwater from the Sand and Gravel aquifer for landscape irrigation use, for a combined total of 3.847 MGD. The historical 3-year average for water production, according to the 2018 Comprehensive Annual Financial Report (CAFR), is 2.415 MGD. Since capacity is available to serve the anticipated near-term growth in the City’s water service area, it is appropriate to include the value of existing facilities in the water impact fee calculation.
The value of existing assets was determined based on two primary sources including the City’s current fixed asset records as of September 30, 2019 and GIS data for the City’s water transmission lines along with current cost estimates per linear foot of installation. The fixed asset records included a complete listing of water assets with its asset number, purchase cost (Original Cost), accumulated depreciation, date installed, and asset life (in months). In reviewing the fixed asset records, the assets associated with transmission lines and distribution lines were excluded from the analysis. Since the lines from the fixed asset records are removed from the analysis, it is appropriate to add in the replacement cost of the lines based on the GIS and current installation cost data.
The original costs from the fixed asset records, for the remaining assets, were then escalated to current values based on the Engineering News Record (ENR) construction cost index. The ENR index provides an annual average index of construction and material costs which can be measured year after year to determine the relative cost of materials purchased in prior years to present costs. For the existing assets, the approached used is to develop the replacement cost new less depreciation (RCNLD), which subtracts the modified accumulated depreciation (adjusted for the cost index) from the current replacement cost.
Finally, the cost for lines added back to the calculation was adjusted to reflect the RCNLD value. This was achieved by reviewing the line information from the fixed assets to determine the average percentage that these assets had been depreciated to-date, which was then applied against the replacement value identified.
The water fixed assets were also classified by functional categories such as treatment and transmission to identify which of the assets are part of the major system backbone infrastructure and thus should be part of the water impact fee calculation. Local service lines that are dedicated to serving only existing customers, vehicle and minor equipment costs, and assets contributed by or paid for by developers are not included in the water impact fee calculation. Table 4 summarizes the value of existing water assets with capacity available to serve new customers:
Table 4: Water Fixed Asset Valuation
Description RCNLD Treatment $12,481,560 Transmission 11,017,465 Total $23,499,025
As provided on the table, the water system is comprised of approximately $23.5 million based on an RCNLD valuation method.
Debt Service
The City has two outstanding debt issues on the utility system: a Utility System Revenue Refunding Note, Series 2015 (Series 2015 Note) and a Florida Water Pollution Control Financing Corporation Clean Water State Revolving Loan WW284100 (SRF Loan). These debt issues have been utilized by the utility to align the funding of capital assets with the anticipated service life of such assets. This enables debt service to be shared by existing and future users over time. The repayment of debt service is funded by the user rates and charges since these are collected on a monthly basis and are typically consistent from year to year. Reliance on impact fees to pay large portions of annual debt service does not lead to financially prudent planning since the revenue generated can fluctuate drastically from year to year. That being said, since annual debt service is primarily funded through the monthly user rates and charges it is common to provide a credit on the impact fees. The purpose of this debt credit is to avoid having new connections pay for these assets through impact fees and then again as they become ratepayers through the monthly rates. The amount of user fee credits that are applied towards the impact fee are determined by the net present value (NPV) of both the principal and interest costs on outstanding debt. Each of the loans has been allocated between water and
wastewater pursuant to the project funding identified and are in alignment with how the utility has historically allocated the payment of these loans for rate setting purposes, as provided below:
Description Water Wastewater Total Series 2015 Note 44.8% 55.2% 100.0% SRF Loan 0.0% 100.0% 100.0%
Additionally, an important step in calculating the impact fee is to add the financing costs associated with the outstanding debt mentioned above. The addition of the net present value of the remaining interest costs is important since it represents the carrying costs of the assets. The principal portion of the debt is already reflected in the asset values accumulated on Table 4. The user fee credit will be reflected on the table illustrating the water impact fee calculation.
Water Impact Fee Calculation
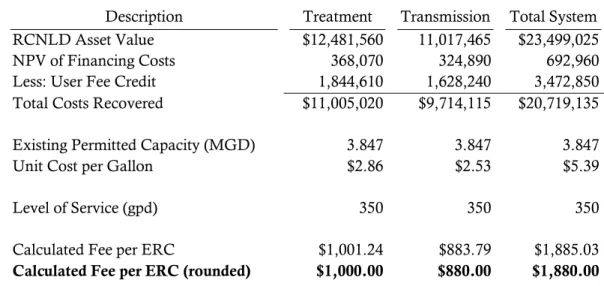
To determine the unit cost of capacity the sum of the City’s water system assets, the NPV of financing costs, and the user fee credits are divided by the total permitted capacity of 3.847 MGD. This calculation produces a unit cost expressed in gallons per day. Then, multiplying the unit cost per gallon by the City’s established level of service results in the calculated water impact fee per ERC. Table 5 illustrates this process under the System Buy-In approach:
Table 5: Water Impact Fee Calculation
Description Treatment Transmission Total System RCNLD Asset Value $12,481,560 11,017,465 $23,499,025
NPV of Financing Costs 368,070 324,890 692,960
Less: User Fee Credit 1,844,610 1,628,240 3,472,850
Total Costs Recovered $11,005,020 $9,714,115 $20,719,135
Existing Permitted Capacity (MGD) 3.847 3.847 3.847
Unit Cost per Gallon $2.86 $2.53 $5.39
Level of Service (gpd) 350 350 350
Calculated Fee per ERC $1,001.24 $883.79 $1,885.03
Calculated Fee per ERC (rounded) $1,000.00 $880.00 $1,880.00
As shown on the table above the total calculated water impact fee is $1,880 per ERC, representing an increase as compared to the existing fee of $700.00. This calculation represents the maximum water impact fee per ERC that can be supported using the methodology described in this report.
Water Impact Fee Comparison
Figure 2 provides a comparison of the City’s existing and calculated water impact fees to similar fees charged by other surrounding communities.
Figure 2: Water Impact Fee Comparison – Single Family Residential
Comparing the impact fees with other representative utilities can provide insights regarding a utility’s expansion needs and the pricing policies related to recovering these capital improvements. However, care should be taken in drawing conclusions from such a comparison, as lower fees may not necessarily represent a community with less expansion-related capital needs. Some communities may choose not to update their impact fees often or may choose to adopt impact fees below the true cost to provide an additional unit of capacity as a result of policy decisions. Other factors also affect the level of these impact fees including but not limited to, geographical location, anticipated demand, customer constituency, and the fee-setting methodology.
$275 $506
$600 $630
$700 $710 $800
$845 $1,046
$1,138 $1,500
$1,880 $1,880 $1,900
$3,093 $3,200
$3,320
$4,550
$- $500 $1,000 $1,500 $2,000 $2,500 $3,000 $3,500 $4,000 $4,500 $5,000
DeFuniak Springs City of Chipley City of Marianna City of Tallahassee Fort Walton Beach - Existing Bay County Okaloosa County E.C.U.A. - Mainland City of Panama City City of Panama City Beach City of Valparaiso Fort Walton Beach - Calculated Destin Gulf Breeze Regional Utilities Inlet Beach South Walton City of Niceville
Section 3
–
Wastewater Impact
Fee
Introduction
Wastewater impact fees are one-time charges assessed against new customers or developers to recover a proportional share of the capital costs incurred by the City to provide capacity for new customers. This capacity may be already constructed, funded, and available in existing facilities, or the service capacity may be planned and included as future capital projects in a CIP. Impact fees are an important funding mechanism to ensure justifiable cost recovery and to limit the burden of ratepayers funding growth-related projects.
This section of the report summarizes the basis for the update of the City’s calculated wastewater impact fees.
Included is a review of the City’s existing wastewater impact fees, a discussion of the derivation of the calculated
impact fees, and a comparison of the existing and calculated fees with other nearby utilities.
Existing Wastewater Impact Fees
The City’s existing wastewater impact fees were last updated in 2004 and are charged to new customers for
connection to the City’s sewer system. Single family residential customers are charged $807.00 for each new dwelling
unit. Commercial, industrial, and all other residential customers are assessed the impact fee based on the established factor as shown in Exhibit 1 at the end of this report.
Impact Fee Methodologies
As mentioned in Section 2. Water Impact Fee, there are numerous approaches to determining impact fees that have been adopted by utilities across the state of Florida and the country. However, two approaches are most often used and are recognized in the industry as cost-justified by the AWWA and WEF2. These two approaches are the System
Buy-In method and the Incremental Cost method. A brief description of these two approaches may be found in Section 2. The calculated wastewater impact fees discussed in this report are based on the System Buy-In method since this approach takes into consideration that the City has a significant investment in existing assets and currently there is available capacity in these existing facilities.
Design of Wastewater Impact Fee
With respect to designing wastewater impact fees, generally there are two significant components that need to be addressed: 1) the level of service to be apportioned to the applicants that request system capacity; and 2) the amount of capital costs to be recovered from a new customer requesting service. Both of these issues are related to the level of the impact fee expressed on an ERC basis which represents the average capacity required to service a typical individually metered single family residential account.
Level of Service Requirements
The previous section discusses LOS standards for water. A similar approach applies for wastewater impact fees. Table 6 summarizes the level of service standards incorporated into this wastewater impact fee analysis. As shown in the table below, the LOS per ERC is 300 gallons per day.
Table 6: Wastewater Level of Service per ERC Service Gallons per Day
Wastewater 300
Capital Costs Recovered Buy-In Value
Wastewater impact fees typically include the growth-related infrastructure costs associated with wastewater collection and treatment. The City currently does not own and operate a wastewater treatment plant, but instead purchases treatment from Okaloosa County (County). As a result, only the value of the existing collection facilities is included in the wastewater impact fee calculation. This value was determined based on obtaining the City’s current fixed asset records as of September 30, 2019 and GIS data for the City’s wastewater collection lines along with current cost estimates per linear foot of installation. The fixed asset records included a complete listing of wastewater assets with its asset number, purchase cost (Original Cost), accumulated depreciation, date installed, and asset life (in months). In reviewing the fixed asset records, the assets associated with collection lines were excluded from the analysis. Since the lines from the fixed asset records are removed from the analysis, it is appropriate to add in the replacement cost of the lines based on the GIS and current installation cost data.
The cost for lines developed based on GIS and current installation cost information were then adjusted to reflect the RCNLD value. This was achieved by reviewing the line information from the fixed assets to determine the average percentage that these assets had been depreciated to-date, which was then applied against the replacement value identified.
The fixed assets were also classified by functional categories to identify which of the assets are part of the major system backbone infrastructure and thus should be part of the wastewater impact fee calculation. Local service lines that are dedicated to serving only existing customers, vehicle and minor equipment costs, and assets donated by or paid for by developers are not included in the wastewater impact fee calculation. Table 7 summarizes the value of existing wastewater assets with capacity available to serve new customers:
Table 7: Wastewater Fixed Asset Valuation Description RCNLD
Treatment N/A
Collection $19,250,507
Total $19,250,507
As provided on the table, the wastewater collection system is comprised of approximately $19.3 million based on an RCNLD valuation method.
Debt Service
As mentioned in the prior section, the City has two outstanding debt issues on the utility system including the Series 2015 Note and the SRF Loan. These debt issues have been utilized by the utility to align the funding of capital assets with the anticipated service life of such assets. The amount of user fee credits that are applied towards the impact fee are determined by the net present value (NPV) of both the principal and interest costs on outstanding debt. Each of the loans has been allocated between water and wastewater pursuant to the project funding identified and are in alignment with how the utility has historically allocated the payment of these loans for rate setting purposes, as identified in the previous section.
Additionally, an important step in calculating the impact fee is to add the financing costs associated with the outstanding debt mentioned above. The addition of the net present value of the remaining interest costs is important since it represents the carrying costs of the assets. The principal portion of the debt is already reflected in the asset values accumulated on Table 7. The user fee credit will be reflected on the table illustrating the wastewater impact fee calculation.
Wastewater Impact Fee Calculation
Typically, to determine the unit cost of capacity under this fee-setting methodology, the total recoverable costs are divided by the permitted capacity at the wastewater treatment plant. However, because the City currently does not own and operate its own wastewater treatment plant, the current flows sent to the County were forecast for a 10-year period based on historic growth levels and used as a proxy for the permitted capacity. Based on fiscal years
2017-2019 billed wastewater flows from the County, the City’s 3-year historical average flow is 2.234 MGD. Using the
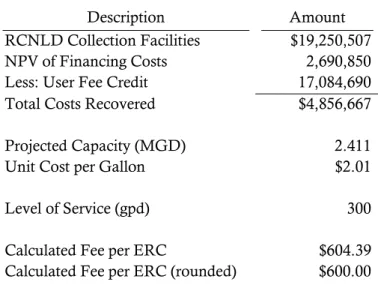
customer growth projections identified in the most recent utility rate study, the 10-year projected flow to the County will increase to 2.411 MGD. The RCNLD of the City’s wastewater collection assets, the NPV of financing costs and the user fee credits are divided by the projected flow of 2.411 MGD. This calculation produces a unit cost expressed in gallons per day. Then, multiplying the unit cost per gallon by the City’s established level of service results in the calculated wastewater impact fee per ERC. Table 8 illustrates this process under the System Buy-In approach:
Table 8: Wastewater Impact Fee Calculation
Description Amount
RCNLD Collection Facilities $19,250,507
NPV of Financing Costs 2,690,850
Less: User Fee Credit 17,084,690
Total Costs Recovered $4,856,667
Projected Capacity (MGD) 2.411
Unit Cost per Gallon $2.01
Level of Service (gpd) 300
Calculated Fee per ERC $604.39
Calculated Fee per ERC (rounded) $600.00
As shown on Table 8, the calculated wastewater impact fee is $600.00 per ERC compared to the existing fee of $807.00, which represents a decrease of $207.00. This represents the maximum wastewater impact fee per ERC that can be supported using the methodology described in this report.
Wastewater Impact Fee Comparison
Figure 3 provides a comparison of the City’s existing and calculated wastewater impact fees to similar fees charged by other surrounding communities. The City’s calculated wastewater impact fee of $600 is well below the $2,779 average of the other surrounding communities, largely due to the lack of a treatment plant.
Figure 3: Wastewater Impact Fee Comparison – Single Family Residential
Comparing the impact fees with other representative utilities can provide insights regarding a utility’s expansion needs and the pricing policies related to recovering these capital improvements. However, care should be taken in drawing conclusions from such a comparison, as lower fees may not necessarily represent a community with less expansion-related capital needs. Some communities may choose not to update their impact fees often or may choose to adopt impact fees below the true cost to provide an additional unit of capacity as a result of policy decisions. Other factors also affect the level of these impact fees including but not limited to, geographical location, anticipated demand, customer constituency, and the fee-setting methodology.
$450 $600 $807 $1,240 $1,250 $1,300 $1,602 $2,103 $2,500 $2,830 $2,900 $2,989 $3,000 $3,200 $4,283 $4,800 $4,825 $5,200
$- $1,000 $2,000 $3,000 $4,000 $5,000 $6,000
DeFuniak Springs Fort Walton Beach - Calculated Fort Walton Beach - Existing City of Chipley City of Panama City City of Marianna E.C.U.A. - Mainland Bay County City of Valparaiso City of Niceville Destin City of Panama City Beach City of Tallahassee Okaloosa County South Walton
Inlet Beach Regional Utilities Gulf Breeze
Section 4
–
Connection Fees
Introduction
Raftelis was tasked with reviewing and updating the City’s water connection fees. This section includes a review and calculation of this miscellaneous fee based on current costs provided by City staff. Additionally, this section includes a comparison of the City’s existing connection fees to other local utilities.
Existing Water Connection Fees
The City’s existing water connection fees were last updated in 2019, pursuant to Resolution No. 2019-15, and are
charged to customers for connecting into any and all City-owned water mains. The water connection fee covers the cost of bringing water service to the property line of the customer’s property. The existing fees are charged according
to the customer’s water meter size and whether the customer is located inside or outside the City. The table below
provides the existing water connection fees:
Table 9: Existing Water Connection Fees
Description Inside City Outside City
3/4" Meter or Smaller $700.00 $840.00
1" Meter $800.00 $960.00
1.5" Meter $1,050.00 $1,260.00
2" Meter $1,300.00 $1,560.00
4" Meter $5,100.00 $6,120.00
6" Meter $8,100.00 $9,720.00
Over 8" Meters At Cost (no less than $9,050)
At Cost (no less than $10,860) Multiple Taps (excludes water meter) $550 per unit, plus
cost of meter
$550 per unit, plus cost of meter
Fire Sprinkler Tap - 2" $1,250.00 $1,250.00
Fire Sprinkler Tap - 4" $2,000.00 $2,000.00
Fire Sprinkler Tap - 6" $3,000.00 $3,000.00
Hydrant & Valve Assembly
(Additional) $2,200.00 $2,200.00
Water Line Extensions/Relocations At Cost At Cost
Cinco Bayou Inside City costs, plus
25%
Inside City costs, plus 25%
Water Connection Fee Calculation
Using data obtained from City staff, Raftelis calculated the costs associated with the water connection fee. The cost
of providing the service was determined using a “bottom-up” approach (or activity-based costing), meaning costs for
the service was developed based on labor, material and equipment costs to provide the service. For labor costs, staff provided input on the time required to conduct the service and the type of personnel involved in completing each
service. Wage rates for each type of personnel were also provided by staff based on existing hourly rates. These hourly rates are assumed to include some allowance to cover benefits such as payroll taxes, employee insurance, and retirement expenses. Staff provided the necessary material costs to perform the water connection which included costs for meters, meter boxes, piping, and other materials. Hourly rates for the equipment (i.e., trucks, excavators, air compressors, etc.) necessary to provide the service were based on FEMA’s Schedule of Equipment Rates for 2019. The labor, material and equipment costs for each meter size were then totaled to determine the cost to provide the service.
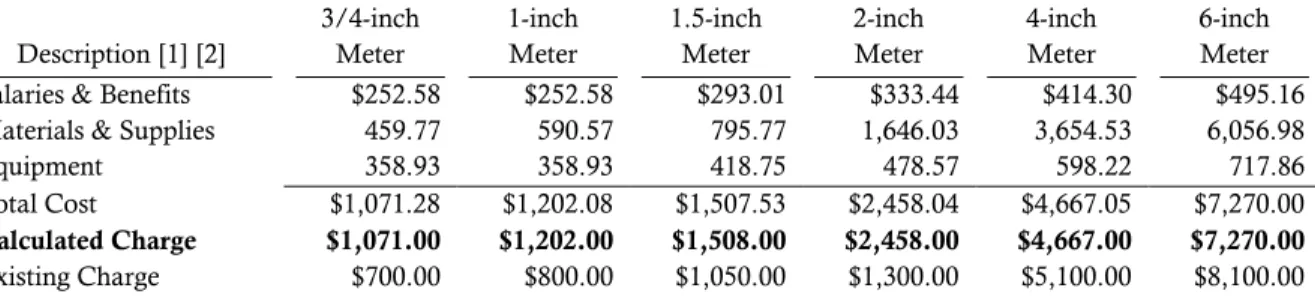
The tables below provide a summary of the cost build-up associated with the water connection fee. Further detail on the cost build-up for each of the water connection fees can be found in Exhibit 2.
Table 10: Water Connection Fee Calculation – Inside City
Description [1] [2]
3/4-inch Meter 1-inch Meter 1.5-inch Meter 2-inch Meter 4-inch Meter 6-inch Meter Salaries & Benefits $252.58 $252.58 $293.01 $333.44 $414.30 $495.16 Materials & Supplies 459.77 590.57 795.77 1,646.03 3,654.53 6,056.98
Equipment 358.93 358.93 418.75 478.57 598.22 717.86
Total Cost $1,071.28 $1,202.08 $1,507.53 $2,458.04 $4,667.05 $7,270.00
Calculated Charge $1,071.00 $1,202.00 $1,508.00 $2,458.00 $4,667.00 $7,270.00
Existing Charge $700.00 $800.00 $1,050.00 $1,300.00 $5,100.00 $8,100.00
__________
[1] Total costs shown. Detailed schedule of labor, materials and equipment provided in Exhibit 2. [2] For meters greater than 6-inch, the price will be based on cost.
Table 11: Water Connection Fee Calculation – Inside City Cont.
Description [1]
Fire Sprinkler Tap – 2-inch
Fire Sprinkler Tap – 4-inch
Fire Sprinkler Tap – 6-inch
Hydrant & Valve Assembly Salaries & Benefits $293.01 $333.44 $373.87 $131.29 Materials & Supplies 974.53 1,419.24 1,217.78 2,615.71
Equipment 554.27 633.45 712.64 237.55
Total Cost $1,821.81 $2,386.13 $2,304.29 $2,984.55
Calculated Charge $1,822.00 $2,386.00 $2,304.00 $2,985.00
Existing Charge $1,250.00 $2,000.00 $3,000.00 $2,200.00
__________
[1] Total costs shown. Detailed schedule of labor, materials and equipment provided in Exhibit 2.
As shown on the tables above, the fee calculation is tied to the size of the meter and the level of effort required for each type of installation, which is fairly common between different locations and land use types. It is recommended that all hotel/multi-family (multi-unit) connections be charged pursuant to the meter size used for service. If the meter size needed is larger than provided on the tables above, the fee should be based on actual cost. Additionally, should a location need more than one water meter, applying the fee for each meter installed is appropriate.
Existing Wastewater Connection Fees
The City’s existing wastewater connection fees were last updated in 2016, pursuant to Resolution No. 2016-11, and
are charged to customers for connecting into any and all City-owned wastewater lines. The wastewater connection fee covers the cost of connecting from the customer’s property line to the wastewater collection line adjacent to the property. The existing fees are charged according to the customer’s connection size, square footage, and/or number
of units, depending on the type of use of the property. The table below provides the existing wastewater connection fees:
Table 12: Existing Wastewater Connection Fees
Description Rate
Front Footage – exceeds 100 feet wide* $10.00 per front foot 4 inch flat tap fee (single family)* $1,000 per unit 6 inch flat tap fee (single family)* $1,250 per unit 4 inch commercial tap (per 4,000 sqft building space) $1,000 6 inch commercial tap (per 4,000 sqft building space) $1,250 8 inch commercial tap (per 4,000 sqft building space) $1,500
Hotels/Multi-family (per unit) $1,000 per unit
Sewer Extensions At cost
Miscellaneous Sewer Requests At cost
*Fee is determined by whichever calculation is greater.
For the wastewater connection fees, it is recommended that the City review the basis of the charges to eliminate the front footage, commercial building square footage, and the number of hotel/multi-family units. Instead, the charge should be based on the average cost for each type/size of connection if there is commonality between each connection, or based on an “At cost” structure if each connection is unique.
Water and Sanitary Sewer Connection Fee Comparison
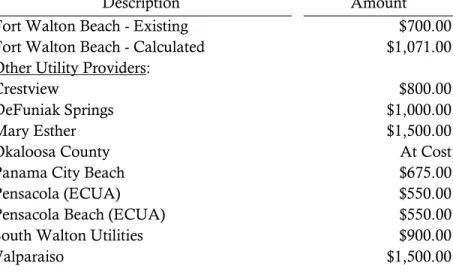
The tables below provide a comparison of the City’s water and sanitary sewer connection fees to similar fees charged by other surrounding communities. The water comparison provided is based on a customer with a 3/4-inch meter, and the sanitary sewer comparison is based on a single-family residential customer.
Table 13: Water Connection Fee Comparison – Inside City 3/4-Inch Meter
Description Amount
Fort Walton Beach - Existing $700.00
Fort Walton Beach - Calculated $1,071.00
Other Utility Providers:
Crestview $800.00
DeFuniak Springs $1,000.00
Mary Esther $1,500.00
Okaloosa County At Cost
Panama City Beach $675.00
Pensacola (ECUA) $550.00
Pensacola Beach (ECUA) $550.00
South Walton Utilities $900.00
Table 14: Sanitary Sewer Connection Fee Comparison – Single-Family Residential
Description Amount
Fort Walton Beach $1,000.00
Other Utility Providers:
Callaway [1] $200.00
Crestview $1,020.00
DeFuniak Springs $1,000.00
Mary Esther $2,500.00
Okaloosa County At Cost
Panama City Beach $500.00
Pensacola (ECUA) At Cost
Pensacola Beach (ECUA) At Cost
South Walton Utilities $900.00
Valparaiso $2,500.00
__________
[1] Connection charge is the greater of $200 or the actual cost of making such connection.
Exhibit 1:
Existing & Calculated Water and
Wastewater Impact Fees
City of Fort Walton Beach
2020 Impact Fee and Connection Fee Study
Exhibit 1: Existing & Calculated Water & Wastewater Impact Fees
Existing Calculated
Type of Establishment [1] ERC Unit Factor Water Wastewater Total Water Wastewater Total
Residential
Single Family Per Dwelling 1.000 $700.00 $807.00 $1,507.00 $1,880.00 $600.00 $2,480.00
Multi-Family Per Dwelling Unit 0.800 $560.00 $645.60 $1,205.60 $1,504.00 $480.00 $1,984.00
Adult Living (Assisted Living) Per Bed 0.500 $350.00 $403.50 $753.50 $940.00 $300.00 $1,240.00 House Boat/Live in Boat Per Dock Slip 1.000 $700.00 $807.00 $1,507.00 $1,880.00 $600.00 $2,480.00 Transient Lodging (Hotel/Motel) Per Unit/Room 0.500 $350.00 $403.50 $753.50 $940.00 $300.00 $1,240.00 Bed & Breakfast Per Establishment 1.000 $700.00 $807.00 $1,507.00 $1,880.00 $600.00 $2,480.00
Plus Per Bedroom for rent 0.250 $175.00 $201.75 $376.75 $470.00 $150.00 $620.00
Commercial
Auditorium Per Seat 0.019 $13.30 $15.33 $28.63 $35.72 $11.40 $47.12
Barber/Beauty Shop Per Chair 0.357 $249.90 $288.10 $538.00 $671.16 $214.20 $885.36
Bowling Alley Per Lane 0.333 $233.10 $268.73 $501.83 $626.04 $199.80 $825.84
Laundromats (Self-service) Per Machine 1.330 $931.00 $1,073.31 $2,004.31 $2,500.40 $798.00 $3,298.40 Dry Cleaning Per 100 sq. ft. 1.900 $1,330.00 $1,533.30 $2,863.30 $3,572.00 $1,140.00 $4,712.00 Automotive Repair & Maint. Stores Per Bay 0.500 $350.00 $403.50 $753.50 $940.00 $300.00 $1,240.00
Gas Sales Per Bay 1.132 $792.40 $913.52 $1,705.92 $2,128.16 $679.20 $2,807.36
Plus Per Wash Bay 3.663 $2,564.10 $2,956.04 $5,520.14 $6,886.44 $2,197.80 $9,084.24
Plus Per Toilet 1.132 $792.40 $913.52 $1,705.92 $2,128.16 $679.20 $2,807.36
Car Wash Self Service Per Bay 3.200 $2,240.00 $2,582.40 $4,822.40 $6,016.00 $1,920.00 $7,936.00
Office Building Per 1,000 sq. ft. 0.350 $245.00 $282.45 $527.45 $658.00 $210.00 $868.00
Food Service
Restaurant, Conventional Per Seat 1.000 $700.00 $807.00 $1,507.00 $1,880.00 $600.00 $2,480.00
Restaurant, (24 hours) Per Seat 0.167 $116.90 $134.77 $251.67 $313.96 $100.20 $414.16
Restaurant, (Fast Food) Per Seat 0.050 $35.00 $40.35 $75.35 $94.00 $30.00 $124.00
City of Fort Walton Beach
2020 Impact Fee and Connection Fee Study
Exhibit 1: Existing & Calculated Water & Wastewater Impact Fees
Existing Calculated
Type of Establishment [1] ERC Unit Factor Water Wastewater Total Water Wastewater Total
Other
Theater Per Seat 0.009 $6.30 $7.26 $13.56 $16.92 $5.40 $22.32
Dinner Theater Per Seat 0.075 $52.50 $60.53 $113.03 $141.00 $45.00 $186.00
Dental Office Per Chair 2.143 $1,500.10 $1,729.40 $3,229.50 $4,028.84 $1,285.80 $5,314.64
Medical Office Per Exam Room 0.571 $399.70 $460.80 $860.50 $1,073.48 $342.60 $1,416.08
Medical Clinic Per Exam Room 0.571 $399.70 $460.80 $860.50 $1,073.48 $342.60 $1,416.08
Church Per Seat 0.009 $6.30 $7.26 $13.56 $16.92 $5.40 $22.32
Schools (Middle & High) Per Student 0.071 $49.70 $57.30 $107.00 $133.48 $42.60 $176.08
Schools (Elem., Day Care, Pre-K) Per Student 0.046 $32.20 $37.12 $69.32 $86.48 $27.60 $114.08
Schools (Boarding) Per Student 0.286 $200.20 $230.80 $431.00 $537.68 $171.60 $709.28
[1] For establishments not listed above, the following formula shall be used: Water: Average Daily Demand / 350 gpd
Exhibit 2:
Water Service Connection Fee
Cost Buildup
City of Fort Walton Beach
2020 Impact Fee and Connection Fee Study
Exhibit 2: Water Service Connection Fees Cost Buildup
Description Amount Notes
- -
-3/4-Inch Meter
Salaries & Benefits:
Foreman I $102.63 3.0 hours @ $34.21 per hour
Equipment Operator 83.70 3.0 hours @ $27.90 per hour
Service Worker 56.25 3.0 hours @ $18.75 per hour
Customer Service Rep. 10.00 0.50 hours @ $20.00 per hour
Total Salaries & Benefits $252.58
Materials & Supplies:
Meter Cost $225.00
Other Materials 234.77
Total Materials & Supplies $459.77
Equipment:
Truck 2652 $53.73 3.0 hours @ $17.91 per hour
Truck 2695 76.38 3.0 hours @ $25.46 per hour
Mini Excavator 165.90 3.0 hours @ $55.30 per hour
Air Compressor 62.92 3.0 hours @ $20.97 per hour
Total Equipment $358.93
Subtotal $1,071.28
Admin. & Overhead 0.00 .00% add-on cost
Total Cost 3/4-inch Meter $1,071.28 Existing Inside-City Fee $700.00 1-Inch Meter
Salaries & Benefits:
Foreman I $102.63 3.0 hours @ $34.21 per hour
Equipment Operator 83.70 3.0 hours @ $27.90 per hour
Service Worker 56.25 3.0 hours @ $18.75 per hour
Customer Service Rep. 10.00 0.50 hours @ $20.00 per hour
Total Salaries & Benefits $252.58
Materials & Supplies:
Meter Cost $355.80
Other Materials 234.77
Total Materials & Supplies $590.57
Equipment:
Truck 2652 $53.73 3.0 hours @ $17.91 per hour
Truck 2695 76.38 3.0 hours @ $25.46 per hour
Mini Excavator 165.90 3.0 hours @ $55.30 per hour
Air Compressor 62.92 3.0 hours @ $20.97 per hour
Total Equipment $358.93
Subtotal $1,202.08
Admin. & Overhead 0.00 .00% add-on cost
Total Cost 1-inch Meter $1,202.08 Existing Inside-City Fee $800.00
City of Fort Walton Beach
2020 Impact Fee and Connection Fee Study
Exhibit 2: Water Service Connection Fees Cost Buildup
Description Amount Notes
- -
-1 -1/2-Inch Meter
Salaries & Benefits:
Foreman I $119.74 3.50 hours @ $34.21 per hour
Equipment Operator 97.65 3.50 hours @ $27.90 per hour
Service Worker 65.63 3.50 hours @ $18.75 per hour
Customer Service Rep. 10.00 0.50 hours @ $20.00 per hour
Total Salaries & Benefits $293.01
Materials & Supplies:
Meter Cost $561.00
Other Materials 234.77
Total Materials & Supplies $795.77
Equipment:
Truck 2652 $62.69 3.50 hours @ $17.91 per hour
Truck 2695 89.11 3.50 hours @ $25.46 per hour
Mini Excavator 193.55 3.50 hours @ $55.30 per hour
Air Compressor 73.41 3.50 hours @ $20.97 per hour
Total Equipment $418.75
Subtotal $1,507.53
Admin. & Overhead 0.00 .00% add-on cost
Total Cost 1 1/2-inch Meter $1,507.53 Existing Inside-City Fee $1,050.00 2-Inch Meter
Salaries & Benefits:
Foreman I $136.84 4.0 hours @ $34.21 per hour
Equipment Operator 111.60 4.0 hours @ $27.90 per hour
Service Worker 75.00 4.0 hours @ $18.75 per hour
Customer Service Rep. 10.00 0.50 hours @ $20.00 per hour
Total Salaries & Benefits $333.44
Materials & Supplies:
Meter Cost $550.00
Other Materials 1,096.03
Total Materials & Supplies $1,646.03
Equipment:
Truck 2652 $71.64 4.0 hours @ $17.91 per hour
Truck 2695 101.84 4.0 hours @ $25.46 per hour
Mini Excavator 221.20 4.0 hours @ $55.30 per hour
Air Compressor 83.89 4.0 hours @ $20.97 per hour
Total Equipment $478.57
Subtotal $2,458.04
Admin. & Overhead 0.00 .00% add-on cost
Total Cost 2-inch Meter $2,458.04 Existing Inside-City Fee $1,300.00
City of Fort Walton Beach
2020 Impact Fee and Connection Fee Study
Exhibit 2: Water Service Connection Fees Cost Buildup
Description Amount Notes
- -
-4-Inch Meter
Salaries & Benefits:
Foreman I $171.05 5.0 hours @ $34.21 per hour
Equipment Operator 139.50 5.0 hours @ $27.90 per hour
Service Worker 93.75 5.0 hours @ $18.75 per hour
Customer Service Rep. 10.00 0.50 hours @ $20.00 per hour
Foreman II 0.00 0.0 hours @ $27.07 per hour
Total Salaries & Benefits $414.30
Materials & Supplies:
Meter Cost $2,127.09
Other Materials 1,527.44
Total Materials & Supplies $3,654.53
Equipment:
Truck 2652 $89.55 5.0 hours @ $17.91 per hour
Truck 2695 127.30 5.0 hours @ $25.46 per hour
Mini Excavator 276.50 5.0 hours @ $55.30 per hour
Air Compressor 104.87 5.0 hours @ $20.97 per hour
Total Equipment $598.22
Subtotal $4,667.05
Admin. & Overhead 0.00 .00% add-on cost
Total Cost 4-inch Meter $4,667.05 Existing Inside-City Fee $5,100.00
City of Fort Walton Beach
2020 Impact Fee and Connection Fee Study
Exhibit 2: Water Service Connection Fees Cost Buildup
Description Amount Notes
- -
-6-Inch Meter
Salaries & Benefits:
Foreman I $205.26 6.0 hours @ $34.21 per hour
Equipment Operator 167.40 6.0 hours @ $27.90 per hour
Service Worker 112.50 6.0 hours @ $18.75 per hour
Customer Service Rep. 10.00 0.50 hours @ $20.00 per hour
Foreman II 0.00 0.0 hours @ $27.07 per hour
Total Salaries & Benefits $495.16
Materials & Supplies:
Meter Cost $4,286.90
Other Materials 1,770.08
Total Materials & Supplies $6,056.98
Equipment:
Truck 2652 $107.46 6.0 hours @ $17.91 per hour
Truck 2695 152.76 6.0 hours @ $25.46 per hour
Mini Excavator 331.80 6.0 hours @ $55.30 per hour
Air Compressor 125.84 6.0 hours @ $20.97 per hour
Total Equipment $717.86
Subtotal $7,270.00
Admin. & Overhead 0.00 .00% add-on cost
Total Cost 6-inch Meter $7,270.00 Existing Inside-City Fee $8,100.00
City of Fort Walton Beach
2020 Impact Fee and Connection Fee Study
Exhibit 2: Water Service Connection Fees Cost Buildup
Description Amount Notes
- -
-Fire Sprinkler Tap - 2-Inch
Salaries & Benefits:
Foreman I $119.74 3.50 hours @ $34.21 per hour
Equipment Operator 97.65 3.50 hours @ $27.90 per hour
Service Worker 65.63 3.50 hours @ $18.75 per hour
Customer Service Rep. 10.00 0.50 hours @ $20.00 per hour
Total Salaries & Benefits $293.01
Materials & Supplies $974.53
Equipment:
Truck 2652 $62.69 3.50 hours @ $17.91 per hour
Truck 2695 89.11 3.50 hours @ $25.46 per hour
Mini Excavator 193.55 3.50 hours @ $55.30 per hour
Air Compressor 73.41 3.50 hours @ $20.97 per hour
Skid Steer 135.52 3.50 hours @ $38.72 per hour
Total Equipment $554.27
Subtotal $1,821.81
Admin. & Overhead 0.00 .00% add-on cost
Total Cost Fire Sprinkler Tap -
2-Inch $1,821.81
Existing Inside-City Fee $1,250.00 Fire Sprinkler Tap - 4-Inch
Salaries & Benefits:
Foreman I $136.84 4.0 hours @ $34.21 per hour
Equipment Operator 111.60 4.0 hours @ $27.90 per hour
Service Worker 75.00 4.0 hours @ $18.75 per hour
Customer Service Rep. 10.00 0.50 hours @ $20.00 per hour
Foreman II 0.00 0.0 hours @ $27.07 per hour
Total Salaries & Benefits $333.44
Materials & Supplies $1,419.24
Equipment:
Truck 2652 $71.64 4.0 hours @ $17.91 per hour
Truck 2695 101.84 4.0 hours @ $25.46 per hour
Mini Excavator 221.20 4.0 hours @ $55.30 per hour
Air Compressor 83.89 4.0 hours @ $20.97 per hour
Skid Steer 154.88 4.0 hours @ $38.72 per hour
Total Equipment $633.45
Subtotal $2,386.13
Admin. & Overhead 0.00 .00% add-on cost
Total Cost Fire Sprinkler Tap -
4-Inch $2,386.13
City of Fort Walton Beach
2020 Impact Fee and Connection Fee Study
Exhibit 2: Water Service Connection Fees Cost Buildup
Description Amount Notes
- -
-Fire Sprinkler Tap - 6-Inch
Salaries & Benefits:
Foreman I $153.95 4.50 hours @ $34.21 per hour
Equipment Operator 125.55 4.50 hours @ $27.90 per hour
Service Worker 84.38 4.50 hours @ $18.75 per hour
Customer Service Rep. 10.00 0.50 hours @ $20.00 per hour
Foreman II 0.00 0.0 hours @ $27.07 per hour
Total Salaries & Benefits $373.87
Materials & Supplies $1,217.78
Equipment:
Truck 2652 $80.60 4.50 hours @ $17.91 per hour
Truck 2695 114.57 4.50 hours @ $25.46 per hour
Mini Excavator 248.85 4.50 hours @ $55.30 per hour
Air Compressor 94.38 4.50 hours @ $20.97 per hour
Skid Steer 174.24 4.50 hours @ $38.72 per hour
Total Equipment $712.64
Subtotal $2,304.29
Admin. & Overhead 0.00 .00% add-on cost
Total Cost Fire Sprinkler Tap -
6-Inch $2,304.29
City of Fort Walton Beach
2020 Impact Fee and Connection Fee Study
Exhibit 2: Water Service Connection Fees Cost Buildup
Description Amount Notes
- -
-Hydrant & Valve Assembly
Salaries & Benefits:
Foreman I $51.32 1.50 hours @ $34.21 per hour
Equipment Operator 41.85 1.50 hours @ $27.90 per hour
Service Worker 28.13 1.50 hours @ $18.75 per hour
Customer Service Rep. 10.00 0.50 hours @ $20.00 per hour
Foreman II 0.00 0.0 hours @ $27.07 per hour
Total Salaries & Benefits $131.29
Materials & Supplies:
Fire Hydrant Cost $1,725.00
Other Materials 890.71
Total Materials & Supplies $2,615.71
Equipment:
Truck 2652 $26.87 1.50 hours @ $17.91 per hour
Truck 2695 38.19 1.50 hours @ $25.46 per hour
Mini Excavator 82.95 1.50 hours @ $55.30 per hour
Air Compressor 31.46 1.50 hours @ $20.97 per hour
Skid Steer 58.08 1.50 hours @ $38.72 per hour
Total Equipment $237.55
Subtotal $2,984.55
Admin. & Overhead 0.00 .00% add-on cost
Total Cost Hydrant & Valve
Assembly $2,984.55
![Table 1: Existing and Calculated Single Family Residential Impact Fees Impact Fee Existing [1] Calculated Difference](https://thumb-us.123doks.com/thumbv2/123dok_us/8527667.2292377/5.918.201.732.709.804/existing-calculated-single-family-residential-existing-calculated-difference.webp)