European Cluster Observatory
European Cluster
Excellence Scoreboard
Pilot Version
The views expressed in this report, as well as the information included in it, do not necessarily reflect the
opinion or position of the European Commission and in no way commit the institution.
Extension of the European Cluster Observatory,
Promoting better policies to develop world-class clusters in Europe
Contract N° 71/PP/ENT/CIP/11/N04C031
European Cluster Excellence Scoreboard
Pilot Version
Authors: Laurent Probst, Erica Monfardini, Laurent Frideres, and Nuray Unlu Bohn, PwC Luxembourg.
Coordination: Enterprise and Industry Directorate-General, Directorate D – “SMEs and
Entrepreneurship”, Unit D5 – “SMEs: Clusters & Emerging Industries
Coordination: Enterprise and Industry Directorate-General, Directorate D – “SMEs and
Entrepreneurship”, Unit D5 – “SMEs: Clusters & Emerging Industries”.
European Union, July 2012.
This work is part of a service contract for the
Enterprise and Industry Directorate-General
of the European Commission.
Executive summary
Executive summary
The European Cluster Excellence Scoreboard Pilot Version applies the scoreboard methodology for measuring regional strength in emerging industries developed under the European Cluster Observatory to three emerging industries in the fields of creative industries, eco industries and mobile services. The pilot scoreboard is composed of three key elements: the strength of the regional business environment (framework conditions), firm strength, and effective business support services (part of cluster management excellence). Empirical results for the scoreboard were compiled through a questionnaire survey with 741 respondents (of which 568 are from firms) across 10 identified regional hotspots, namely: Berlin, Catalonia (Barcelona), North Holland (Amsterdam) and Inner London for creative industries; the Capital Region of Denmark (Copenhagen), Lombardy (Milan) and Provence-Alpes-Côte d’Azur (Marseille) for eco industries; and Attiki (Athens), South Finland (Helsinki) and Vienna for mobile services.
According to the survey results, the three most important factors boosting the regional strength of emerging industries are the market knowledge and innovation capacity of firms, their human capital, and their entrepreneurial nature. As far as the regional business environment is concerned, financial and knowledge factors are viewed most important. Business support services are, overall, less important compared to the regional business environment and the strength of firms. Of the different business support services assessed, support for finding external collaboration partners, support for access to finance and support for internationalisation are rated highest.
Significant weaknesses in the regional business environments can be observed across the 10 regions. Most notable is the lack of available financing. Stakeholders in all regions rated financing as insufficient. Lombardy, Catalonia and Attiki (Athens) rank lowest for this factor. Regulatory and policy as well as support framework conditions also score overwhelmingly negatively. Only the Capital Region of Denmark and South Finland have slightly positive scores for these two factors. The outlook on the market is also negative overall. North Holland, Inner London, Berlin, South Finland and Vienna score slightly positively for this factor but all of the southern European regions surveyed have a negative outlook on their markets.
The three factors deemed most important for the strength of firms – market knowledge and innovation capacity, human capital and entrepreneurship – are also rated highest in terms of their availability. There is, however, a significant gap between importance and availability for these and for the other factors. Internationalisation and access to finance score the lowest amongst the factors measuring the strength of firms. The northern European regions score better in terms of firm strength compared to the southern regions included in the survey.
Effective business support services are lacking across all the regions included in the survey with most stakeholders stating that there is insufficient availability of effective services in their region. The two factors where firm strength was rated lowest are also those where corresponding business support services are widely unavailable: support for access to finance and support for internationalisation. The two regions with the most significant gaps for this element are Catalonia and Attiki (Athens).
This pilot scoreboard is part of a number of reports prepared in the framework of the extension of the European Cluster Observatory. The methodology applied by this scoreboard to measure regional strength in emerging industries is described in more detail in a separate methodology report. The definitions of emerging industries are detailed in the methodology report for the classification of the most active, significant and relevant new emerging industrial sectors. Emerging industries can be defined as the establishment of an entirely new industrial value chain, or the radical reconfiguration of an existing one, driven by a disruptive idea (or convergence of ideas), leading to turning these ideas/opportunities into new products/services with higher added value. The scoreboard results are complemented by three case studies on industry-specific framework conditions for the development of world-class clusters in creative industries, eco industries and mobile services. The methodology for the case studies is described in a separate report on the identification and benchmarking of ideal framework conditions. Furthermore, a policy roadmap prepared by the European Forum for Clusters in Emerging Industries (EFCEI) introduces recommendations for actions for new linkages to promote the development of emerging industries through clusters in Europe. All reports – together with further maps by country, industry and indicators – can be found at
Table of Contents
Table of contents
1. Introduction 7 1.1. Analytical framework 7 1.2. Methodology 8 1.3. Evidence base 8 1.4. Respondent profiles 9 1.4.1. Firms 91.4.2. Policy makers, government agencies and regional development agencies 11
1.4.3. Cluster management organisations 12
1.4.4. Business support organisations 14
1.4.5. Investors 15
1.4.6. Research, academia or technology transfer organisations 18
1.5. Analytical structure of the pilot scoreboard 19
2. Factors boosting the strength of emerging industries 20
2.1. The importance of the strength of the regional business environment (framework conditions) 20
2.2. The importance of the strength of firms 22
2.3. The importance of the availability of business support services 24
2.4. Summary of findings 26
3. Characteristics of the regional business environment (framework conditions) 27
3.1. Comparing emerging industries: the strength of regional business environments 28
3.1.1. Creative industries: regional business environment scores by region 30
3.1.2. Eco industries: regional business environment scores by region 31
3.1.3. Mobile services: regional business environment scores by region 32
3.2. Comparing the strength of regional business environments: regional rankings by factor 33
3.3. Summary of findings 36
4. Indicators of firm strength 37
4.1. Comparing emerging industries: firm strength in the different regions 38
4.1.1. Creative industries: firm strength scores by region 40
4.1.2. Eco industries: firm strength scores by region 41
4.1.3. Mobile services: firm strength scores by region 42
4.2. Comparing firm strength: regional rankings by factor 43
Table of Contents
5.1. Comparing emerging industries: the availability of effective business support services 47
5.1.1. Creative industries: availability of effective business support services scores by region 49
5.1.2. Eco industries: availabilty of effective business support services scores by region 50
5.1.3. Mobile services: availabilty of effective business support services scores by region 51
5.2. Comparing the availability of effective business support services: regional rankings by type of service 52
5.3. Summary of findings 55
6. Firm performance (output indicators) 56
6.1. Comparing emerging industries: firm performance 57
6.1.1. Creative industries: firm performance scores by region 58
6.1.2. Eco industries: firm performance scores by region 59
6.1.3. Mobile services: firm performance scores by region 60
6.2. Comparing firm performance indicators: scores by region 61
6.3. Comparing cluster firms with non-cluster firms 64
6.4. Summary of findings 68
7. Aggregate scores and indicators 69
7.1. Regional rankings for the different elements measuring regional strength in emerging industries 70
7.1.1. Rankings based on availability scores 70
7.1.2. Rankings based on composite indicators measuring both importance and availability 72
7.2. Scores measuring regional strength of emerging industries 74
7.2.1. Importance scores for different factors by region 74
7.2.2. Availability scores for different factors by region 75
7.2.3. Composite indicators assessing importance and availability of different factors by region 76
7.3. Comparing composite indicator scores and firm performance 77
8. Conclusions 79
Appendix A. - Scorecard for creative industries in Berlin 80
A.1. Dimensions of strength in emerging industries 80
A.2. Composite indicators 81
Appendix B. - Scorecard for creative industries in Catalonia (Barcelona) 82
B.1. Dimensions of strength in emerging industries 82
B.2. Composite indicators 83
Appendix C. - Scorecard for creative industries in North Holland (Amsterdam) 84
C.1. Dimensions of strength in emerging industries 84
C.2. Composite indicators 85
Table of Contents
D.1. Dimensions of strength in emerging industries 86
D.2. Composite indicators 87
Appendix E. - Scorecard for eco industries in the Capital Region of Denmark (Copenhagen) 88
E.1. Dimensions of strength in emerging industries 88
E.2. Composite indicators 89
Appendix F. - Scorecard for eco industries in Lombardy (Milan) 90
F.1. Dimensions of strength in emerging industries 90
F.2. Composite indicators 91
Appendix G. - Scorecard for eco industries in Provence-Alpes-Côte d’Azur (Marseille) 92
G.1. Dimensions of strength in emerging industries 92
G.2. Composite indicators 93
Appendix H. - Scorecard for mobile services in Attiki (Athens) 94
H.1. Dimensions of strength in emerging industries 94
H.2. Composite indicators 95
Appendix I. - Scorecard for mobile services in South Finland (Helsinki) 96
I.1. Dimensions of strength in emerging industries 96
I.2. Composite indicators 97
Appendix J. - Scorecard for mobile services in Vienna 98
J.1. Dimensions of strength in emerging industries 98
Introduction
1. Introduction
1.1.
Analytical framework
The objective of the pilot version of the European Cluster Excellence Scoreboard is to measure regional strength in emerging industries in order to assess and identify in what way clusters can provide support for the development of emerging industries. This pilot scoreboard focuses on a selection of hotspots, i.e. regions which are in an advanced stage of development for a given emerging industry. In order to obtain results that are comparable across industries, the scoreboard focuses on general indicators that apply to all emerging industries, with no particular focus on a specific emerging industry.
The scoreboard indicators measure three key elements of regional strength in emerging industries (Figure 1): regional business environment (framework conditions), firm strength, and business support services (part of cluster management excellence). Effective business support services when provided by a cluster management organisation are one aspect of cluster management excellence but it should be noted that there are additional
benchmarking indicators for cluster management excellence that are not included in the scoreboard1. The three
key elements will be assessed along seven different dimensions: finance, industrial, market, cultural (including human capital and entrepreneurship), knowledge, regulatory & policy, support, and output & performance. Figure 1: Typology of indicators to measure regional strength in emerging industries
KEY ELEMENTS
Regional business environment (framework
conditions) Firm strength
Business support services (part of cluster management
excellence)
DIMEN
SIO
N
S
Finance Financial framework conditions Access to funding Supporting access to finance
Industrial Industrial framework conditions National and international partnerships Internationalisation
Supporting internal networking Supporting partnership initialisation with external
partners
Supporting internationalisation
Market Market framework conditions
Cultural Cultural framework conditions Human capital
Entrepreneurship
Supporting talent search and retention
Supporting entrepreneurship
Knowledge Knowledge framework conditions Market knowledge and innovation
capacity
Supporting research, development and innovation
(RDI)
Regulatory &
policy Regulatory and policy framework conditions Support Support framework conditions Output &
performance Profitability and productivity
The indicators are focused primarily on enablers or inputs for regional strength. Output is measured at the firm level in terms of profitability and productivity. Output at the regional or emerging industry level is assessed by aggregating firm-level output data at the level of a given region or emerging industry. Business support services
Introduction
are measured in terms of the availability of excellent services at the regional level and, in the case of clusters, in terms of the quality of services provided by the cluster management organisation to the cluster participants.
1.2.
Methodology
The methodology for the European Cluster Excellence Scoreboard (ECES) is detailed in depth in the scoreboard
methodology report2. A survey-based approach was proposed in the methodology report in order to collect very
specific, targeted and timely data on the key indicators and critical success factors for measuring the strength of regions in each emerging industry. The stakeholder groups targeted by the survey include firms, policy makers, cluster management organisations, business support organisations, investors and academia.
The questionnaire survey for the scoreboard included five main sections: (a) a profile or the respondent and organisation, (b) factors boosting the strength of emerging industries, (c) characteristics of the regional business environment, (d) indicators of firm strength, (e) effective business support services, and (f) firm performance indicators. The specific questions asked for each set of indicators are listed at the start of the relevant chapter analysing the results.
1.3.
Evidence base
The pilot survey for the ECES was conducted between February and April 2013. Based on the recommendations of experts at the third meeting of the European Forum for Clusters in Emerging Industries (EFCEI) in November 2012, the number of hotspots surveyed for the pilot scoreboard was reduced to 10 in order to increase the number of respondents per hotspots and thus reliability and representativeness of the survey results. To increase reliability, the survey was also restricted to three of the seven identified emerging industries, namely: creative industries, eco industries and mobile services.
Potential respondents were approached by email and asked to fill in an online questionnaire made available in five languages: English, German, French, Italian and Spanish. Two reminders were sent to follow up on the initial invitation. The response rate varied between different regions and stakeholder groups. Overall it reached around 10 percent of the targeted population. The final number of respondents significantly exceeds the estimated 350-450 responses proposed in the scoreboard methodology (Table 1).
Introduction
Table 1: Number of respondents per region and stakeholder group
Region Firms Policy CMOs Business support Investors Academia Total
C reat iv e ind u st ri es Berlin 67 2 1 7 4 6 87 Catalonia (Barcelona) 60 4 1 2 1 4 72 North Holland (Amsterdam) 28 1 2 12 6 5 54 Inner London 48 3 5 3 3 62 Eco ind u st ri es Capital Region of Denmark (Copenhagen) 34 3 2 6 2 4 51 Lombardy (Milan) 55 3 3 6 3 4 74 Provence-Alpes-Côte d’Azur (Marseille) 31 2 1 1 2 37 Mo bi le servi
ces Attiki (Athens) 85 2 2 3 2 12 106
South Finland (Helsinki) 103 4 5 6 5 1 124
Vienna 57 5 3 3 1 5 74
Total 568 29 19 51 28 46 741
1.4.
Respondent profiles
1.4.1.
Firms
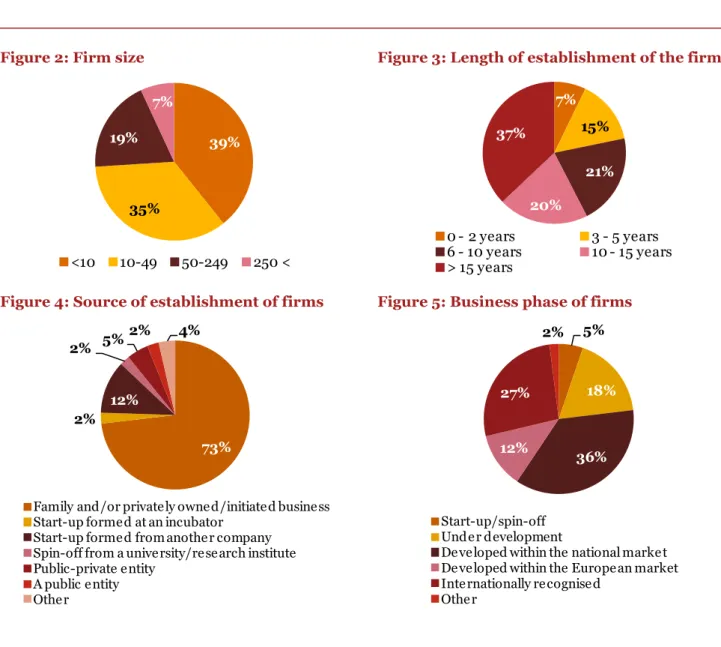
The vast majority of firm respondents represent small and medium-sized enterprises (SMEs) and nearly three quarters SMEs with fewer than 50 employees (Figure 2). Seven percent of respondents are from start-ups (0-2 years) and 15% from young firms (3-5 years) – see Figure 3. The majority of surveyed firms have been established for more than 10 years. Family and/or privately owned or initiated businesses make up nearly three quarters of responses (Figure 4). Start-ups established from another firm make up 12% of respondents. Most surveyed firms are in a more advanced phase of business development with 36% developed within the national market, 12% within the European market and 27% internationally recognised (Figure 5).
Introduction
Figure 2: Firm size Figure 3: Length of establishment of the firm
Figure 4: Source of establishment of firms Figure 5: Business phase of firms 39% 35% 19% 7% <10 10-49 50-249 250 < 7% 15% 21% 20% 37% 0 - 2 years 3 - 5 years 6 - 10 years 10 - 15 years > 15 years 73% 2% 12% 2% 5% 2% 4%
Family and/or privately owned/initiated business Start-up formed at an incubator
Start-up formed from another company Spin-off from a university/research institute Public-private entity A public entity Other 5% 18% 36% 12% 27% 2% Start-up/spin-off Under development
Developed within the national market Developed within the European market Internationally recognised
Introduction
1.4.2.
Policy makers, government agencies and regional
development agencies
Amongst the policy maker, government agency or regional development agency respondents about half are involved in policy making and/or implementation at the regional and national levels, two in five at the EU/supranational level and one in four at the local level (Figure 6). Two thirds of the policy stakeholders reported that there are interim evaluations in place in their region (Figure 7). The figure is at about half for ex-post and ex-ante evaluations.
Figure 6: Level(s) of involvement in policy
making and/or implementation Figure 7: Evaluation processes in place in the region
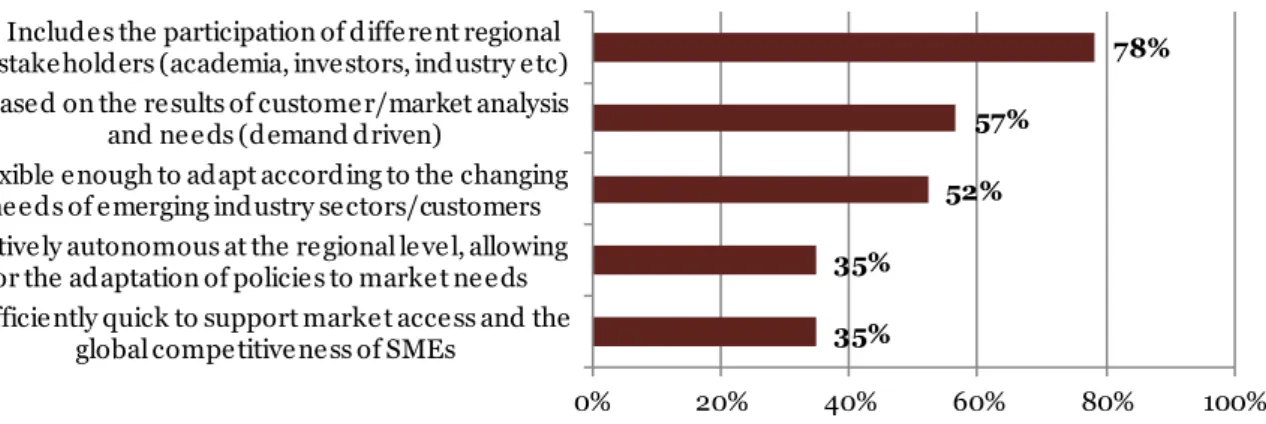
The participation of different regional stakeholders is part of the policy making process for 78% of respondents (Figure 8). The level of regional autonomy and the speed at which the policy process can support market access and the global competitiveness of SMEs is a less common characteristic at 35%. It is worth highlighting that only half of the respondents considered the policy making process in their region to be flexible enough to adapt to the changing needs of emerging industries.
Figure 8: Characteristics of the policy making process that respondents are involved in
The vast majority of respondents reported that there are comprehensive or partial policy in place for cluster development, internationalisation, access to finance, innovation for goods and services, entrepreneurship,
26% 39% 52% 52% 0% 20% 40% 60% 80% 100% Local level EU/supranational level National level Regional level
Percentage of respondents involved in policy making at each level
52% 52% 65% 0% 20% 40% 60% 80% 100% Ex-ante evaluations Ex-post evaluations Interim evaluations
Percentage of respondents indicating that their region has the given
evaluation processes in place
35% 35% 52% 57% 78% 0% 20% 40% 60% 80% 100%
Sufficiently quick to support market access and the global competitiveness of SMEs
Relatively autonomous at the regional level, allowing for the adaptation of policies to market needs Flexible enough to adapt according to the changing
needs of emerging industry sectors/customers Based on the results of customer/market analysis
and needs (demand driven)
Includes the participation of different regional stakeholders (academia, investors, industry etc)
Percentage of respondents indicating that the policy making process in their region displays the following characteristics
Introduction
market access and human capital development (Figure 9). The most comprehensive policies are for cluster development and internationalisation.
Figure 9: Policies currently in place in the region
1.4.3.
Cluster management organisations
The cluster management organisations (CMOs) surveyed have all been established for at least 3 years (Figure 10). Most of the clusters are assessed as being in the developing phase and about one quarter as mature (Figure 11). Self-financing (e.g. membership fees, services provided, own financial resources) is the most common form of financing (Figure 12). Public financing accounts for around a quarter of surveyed CMOs.
Figure 10: Length of establishment of the CMO Figure 11: Life cycle of the cluster
0% 20% 40% 60% 80% 100% Human capital development
Market access Entrepreneurship Innovation for goods and services Access to finance Internationalisation Cluster development
Percentage of respondents indicating that there are currently policies in place their region for the following
Yes, comprehensive. Yes, partial No, none.
29%
53%
18%
3 - 5 years ago 6 - 10 years ago
> 15 years ago
71% 23%
6%
Introduction
Figure 12: Financing structure of the CMO
The governance characteristics for around two thirds of surveyed CMOs include the involvement of stakeholders in the identification of cluster strategies and performance monitoring based on key performance indicators (Figure 13). Only a small percentage has a scientific advisory committee and representatives of other clusters on the board.
Figure 13: Governance characteristics of the surveyed CMOs
Lack of support for financing is the most significant challenge identified by the CMOs (Figure 14). Additional challenges that were identified are to secure the long-term involvement of both public and private partners and to ensure sufficient staffing levels.
41% 12% 12% 6% 29% Self-financing
Public Financing – Regional Public Financing – National
Private Financing (excluding membership fees) Other 18% 18% 29% 47% 59% 59% 65% 71% 0% 20% 40% 60% 80% 100%
Representatives from other regional/national clusters on the board for boosting collaboration
Presence of a Scientific Advisory Committee composed representatives from academia
Representatives of investors on the board Presence of an Advisory Committee composed of
industry representatives
Representatives of regional authorities and policy makers on the board
Feedback from the board and advisory committees is integrated into the cluster strategy
Performance monitoring is based on objectives and key performance indicators Involvement of stakeholders in the identification
of cluster strategies
Percentage of respondents indicating that the following governance characteristics apply to their organisation
Introduction
Figure 14: Major challenges identified by the surveyed CMOs
1.4.4.
Business support organisations
The business support organisations surveyed include business incubators, accelerators, coworking spaces, techno parks, business networks, business associations and other business support organisations. The majority of the surveyed organisations have fewer than 10 employees and almost 9 in 10 have fewer than 50 employees (Figure 15). Around half of the organisations have been established for more than 10 years (Figure 16). Self-financing accounts for 52% of the Self-financing structures of the organisations and 27% receive public Self-financing at the regional or national levels (Figure 17).
Figure 15: Organisation size Figure 16: Length of establishment of the organisation 12% 18% 18% 35% 47% 53% 0% 20% 40% 60% 80% 100% Other Lack of private funding for the development of the
organisation and stragegy implementation Difficulties in collaborating with other clusters
(nationally and/or internationally) Lack of involvement of cluster stakeholders in
strategy development and implementation Difficulties in assessing cluster performance (due
to e.g. a lack of commonly agreed methods) Lack of regional/national/supra-national support for financing and development of the organisation
Percentage of respondents indicating that their organisation is facing the following major challenges
55% 34% 2% 9% <10 10-49 50-249 250 < 4% 18% 28% 14% 36% 0 - 2 years 3 - 5 years 6 - 10 years 10 - 15 years > 15 years
Introduction
Figure 17: Financing structure of the organisation
1.4.5.
Investors
Just over half of the surveyed investors are from venture capital firms with smaller shares of business angels, commercial banks and investment/development agencies (Figure 18). The majority of surveyed investors are investing in the creative industries (Figure 19). One third is investing in mobile services and one quarter in eco industries. Other industries targeted include traditional manufacturing and fast-moving consumer goods (FMCG).
Figure 18: Investor profiles Figure 19: Share of surveyed investors
currently investing in each emerging industry
Prior experience investing in a particular industry is the most important prerequisite for investors (Figure 20). High returns on investment are also important. The level of risk for a particular industry is not determinant factor for the surveyed investors. The potential for high growth and growth in sales was amongst other reasons cited. 52% 16% 11% 19% 2% Self-financing
Public Financing – Regional Public Financing – National
Private Financing (excluding membership fees) Other 56% 15% 11% 7% 11%
Venture capital firm Business angel Commercial bank
Regional Investment/Development Agency Other 46% 8% 21% 25% 25% 33% 42% 58% 0% 20% 40% 60% 80% Others Maritime industries Personalised medicine Eco industries Experience industries Mobile services Mobility industries Creative industries
Introduction
Figure 20: Reasons for investing in particular industries
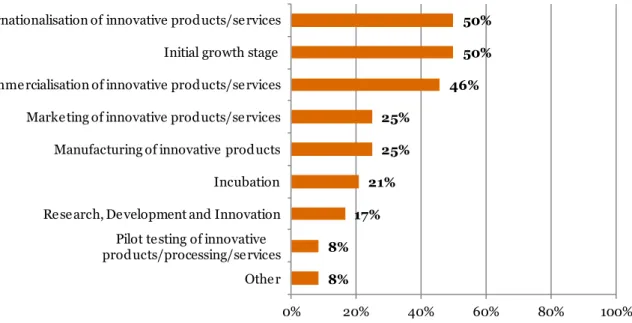
The preferred stages for investment are the initial growth stage as well as the internationalisation and commercialisation stages of innovative products and services (Figure 21). The research, development and innovation and pilot test stages are less popular.
Figure 21: Preferred stage(s) of the company life cycle for investment
The single most critical factor when investing in a company, identified by all of the surveyed investors, is the quality of the entrepreneur and top management (Figure 22). The market knowledge of the entrepreneur and top management is also seen as critical by two thirds of respondents. The uniqueness of the technology or business concept is seen as critical by half. Less critical are the involvement of a company in a cluster and supportive regional and national policies.
13% 4% 8% 54% 79% 0% 20% 40% 60% 80% 100% Others Low levels of risk for a particular industry Attendance at investors' awareness …
High returns on investment Due to previous experiences in these industries
Percentage of respondents indicating that they are investing in particular industries for the following reasons
8% 8% 17% 21% 25% 25% 46% 50% 50% 0% 20% 40% 60% 80% 100% Other Pilot testing of innovative products/processing/services Research, Development and Innovation Incubation Manufacturing of innovative products Marketing of innovative products/services Commercialisation of innovative products/services Initial growth stage Internationalisation of innovative products/services
Percentage of respondents indicating a preference for investing in the following stages of the company life cycle
Introduction
Figure 22: Most critical factors when investing in a company
The most important skills and qualities sought for in an entrepreneur are leadership and vision as well as market knowledge (Figure 23). A global vision for internationalisation, communication and collaboration skills, and a successful track record in a related business area are also important. Less sought after are a successful track record in a business of similar maturity and financial skills.
Figure 23: Skills and qualities sought for in an entrepreneur
4% 4% 8% 21% 21% 33% 50% 63% 100% 0% 20% 40% 60% 80% 100% Other Supportive regional and national policies Involvement in a cluster Maturity of the company Reputation of the company Solidity of the intellectual property Uniqueness of the technology or business concept Market knowledge of the entrepreneur / top
management
Quality of the entrepreneur / top management
Percentage of respondents indicating that the following factors are the most critical when investing in a company
21% 25% 33% 42% 46% 54% 54% 67% 71% 0% 20% 40% 60% 80% 100%
Financial skills (fund raising, fund management, etc)
Successful track record in a business of similar maturity
Analytical skills Management skills Successful track record in a related business area Communication and collaborative skills Global vision for internationalisation Market knowledge (market access, market needs,
etc)
Leadership and vision
Percentage of respondents indicating that the following skills and qualities are what they are most looking for in an entrepreneur
Introduction
1.4.6.
Research, academia or technology transfer organisations
Around two thirds of the respondents for academia stakeholders are currently working for a university and one fifth for a research centre or institute (Figure 24). Other educational institutions make up 6% of respondents and technology transfer organisations 4%.
Figure 24: Institutional representation
In terms of collaboration activities, joint RDI with other institutions is rated highest in terms of intensity by the respondents, followed by joint projects and joint publications (Figure 25). Joint ventures with industry are less significant in terms of intensity.
Figure 25: Intensity of different types of collaboration activities (average scores)
The research agendas of the respondents are mostly, although not completely, aligned with different development targets and focus areas, with average alignment scores above three on a five point scale (Figure 26). The scores are higher for global, EU and national targets compared to objectives at the cluster level and regional economic development priorities.
63% 21% 6% 4% 6% University Research Centre/Institute Educational Institution
Technology Transfer Organisation (TTO) Other
1 1.5 2 2.5 3 3.5 4 4.5 5
Joint ventures with industry Joint publications with other
institutions
Joint projects (e.g. FP7 projects) Joint RDI with universities, research
institutions or industry
very high very low
Introduction
Figure 26: Extent to which research agendas are aligned with different targets, focus areas, objectives and priorities (average scores)
1.5.
Analytical structure of the pilot scoreboard
Chapter 2 presents the results for the importance of different factors for boosting the strength of emerging
industries. These factors relate to the three key elements covered by the scoreboard: the strength of the regional business environment, the strength of firms, and the importance of the availability of business support services. Results are presented for each element for all emerging industries combined, as separate scores for the three emerging industries, and for firm and non-firm respondents.
Chapter 3 investigates the strength of regional business environments in terms of the availability of different
underpinning components. Availability is assessed for the three different emerging industries and as perceived by firm and no-firm stakeholders. Results are presented in the form of spider charts reporting the scores for all factors by region and as ranked bar charts for comparing the strength of different framework conditions across
regions. Chapters 4 and 5 provide the same assessment on the availability of different factors as chapter 3 but
focused on the two other elements focused on indicators of firm strength and effective business support services.
Chapter 6 deals with the output indicators for firm performance. The latter is measured as growth in
employment, annual revenues, output, profits, and the number of innovative products and services. Results are presented using stacked bar charts showing the percentage of firms having experienced a decrease, no change or increases (slight, moderate or significant) for the five performance indicators over the three year period prior to the survey. Firm performance is compared for the different indicators by region and for the same indicators between regions. This chapter also includes a comparative analysis of the performance of firms participating in a cluster initiative with the performance of firms not participating in a cluster initiative.
Chapter 7 presents aggregate importance and availability scores and composite indicators for the different
elements and factors boosting the strength of emerging industries. It provides regional rankings based on availability scores and based on composite indicators (measuring both importance and availability) for the three key elements of the scoreboard. This chapter also includes tables listing all the importance scores, availability scores, and composite indicator scores for the different elements and factors by region. The final section focuses on comparing the indicator scores for regional business environments and business support services with firm performance scores.
The appendices consist in two-page scorecards for each of the 10 hotspots. The scorecards regroup the key
charts measuring the strength in emerging industries for each regional hotspot on the first page and provide a brief summary and recommendations. The second page of each scorecard graphically presents the scores for the composite indicators, summarising the strength of each regional hotspot for the three key elements as well as overall for the three elements combined.
1 1.5 2 2.5 3 3.5 4 4.5 5
Priority areas identified in the regional economic development strategy The strategic vision and objectives of
your regional cluster(s) National development priorities and
targets
Research focus areas identified at the EU level
Global societal, environmental and/or energy targets
completely not at all
Factors boosting the strength of emerging industries
2. Factors boosting the strength of
emerging industries
This chapter investigates the importance of different factors for boosting the strength of emerging industries
including: (i) the strength of regional business environments (framework conditions), (ii) the strength of firms, and (iii) the availability of business support services. All the graphs in this chapter measure importance on a scale of 1 to 5, where 1 is the least important and 5 is the most important.
2.1.
The importance of the strength of the regional business
environment (framework conditions)
The importance of different dimensions of strength of regional business environments or framework conditions was assessed with the following question:
How would you rate the importance of the following factors for the strength of your regional
business environment? Respondents were asked to rate the importance of the following factors on a
scale of 1 to 5, where 1 is the least important and 5 is the most important.
Financial – presence of actors providing funds to support firms, the availability of funds meeting the
specific funding needs of your industry, the ease with which funds can be accessed
Industrial – critical mass of other companies in your industry and related industries, well established
support structure like incubators and accelerators, communications and transport infrastructure
Market – a critical mass of consumers, a consumer driven market, ease of exchanging goods and
services, the level of collaboration and competition, ease of establishing and running a business
Cultural - a set of shared attitudes, values, goals and practices in the region, an entrepreneurial
culture, a strong regional labour force with qualified workers for a range of skills
Knowledge – higher education and research institutions in industry specific fields, technology
transfer organisations and shared technology platforms, sector specific courses or training
Regulatory and policy – presence of a favourable regulatory environment, alignment of different
policies to support the growth of specific industries, public consultations in the policy making process
Support – presence of measures to boost the growth of specific industries through training, business
and legal advice, supporting knowledge transfer, access to finance, internationalisation, etc.
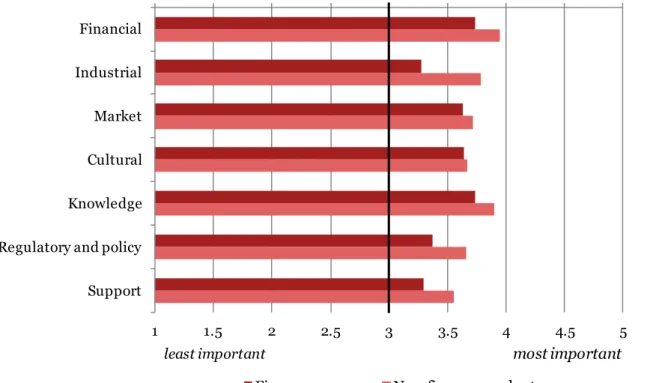
Financial and knowledge factors are deemed most important for the strength of regional business environments (Figure 27). The scores for all dimensions are above 3, indicating that overall, they are seen as important. Support is rated as least important.
Factors boosting the strength of emerging industries
Figure 27: Importance of different factors for the strength of the regional business environment (framework conditions): all emerging industries
There are some variations between the three emerging industries in terms of how stakeholders view the importance of different factors for the strength of the regional business environment (Figure 28). For the creative industries, the cultural factors rank highest overall, followed by market and financial factors. Regulatory and policy factors are seen as less important for the creative industries. For the eco industries, on the other hand, regulatory and policy ranks higher as the second most important factor after financial.
Figure 28: Importance of different factors for the strength of the regional business environment (framework conditions): scores by emerging industry
A comparison of the ratings assigned by firm and non-firm respondents shows that non-firm respondents rated all seven factors as more important compared to firm respondents (Figure 29). The most significant differences can be observed for the industrial, regulatory and policy and support factors.
1 1.5 2 2.5 3 3.5 4 4.5 5
Support Industrial Regulatory and policy Cultural Market Knowledge Financial
most important
least important most important
least important 1 1.5 2 2.5 3 3.5 4 4.5 5 Financial Industrial Market Cultural Knowledge Regulatory and policy Support
Creative industries Eco industries Mobile services
most important least important
Factors boosting the strength of emerging industries
Figure 29: Importance of different factors for the strength of the regional business environment (framework conditions): scores for firm and non-firm respondents
2.2.
The importance of the strength of firms
The importance of different dimensions of the strength of firms was assessed with the following question:
How would you rate the importance of the following factors for the successful growth and
sustainable development of your firm? Respondents were asked to rank the importance of the
following factors on a scale of 1 to 5, where 1 is the least important and 5 is the most important.
Access to funding
National and international partnerships
Internationalisation (exports to and/or presence in other countries)
Human capital (employees with experience and expertise)
Entrepreneurship
Market knowledge and innovation capacity
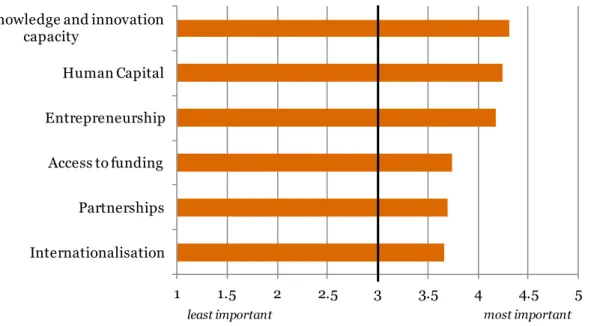
Market knowledge and innovation capacity, human capital and entrepreneurship all received average scores above 4, indicating that these three factors are very important for the strength of firms (Figure 30). Access to funding, partnerships and internationalisation ranked lower with most respondents rating their importance for firm strength at around 3.6.
1 1.5 2 2.5 3 3.5 4 4.5 5 Financial Industrial Market Cultural Knowledge Regulatory and policy Support
Firms Non-firm respondents
most important least important
Factors boosting the strength of emerging industries
Figure 30: Importance of different factors for firm strength: all emerging industries
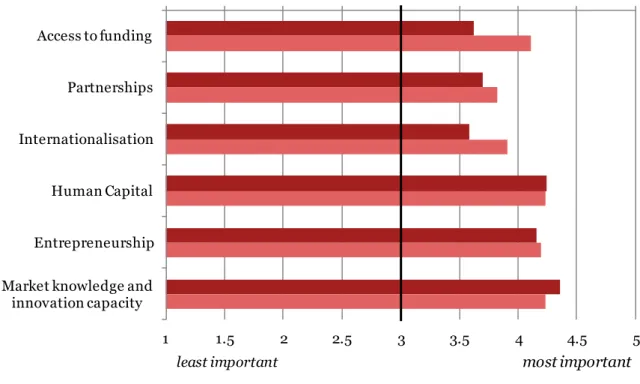
Overall, the ratings for the importance of firm strength factors are quite consistent (Figure 31). Access to funding and internationalisation are more important for the eco industries compared to mobile services and the creative industries. Partnerships are more important for mobile services compared to the other two emerging industries. There is little difference in the way in which different emerging industry stakeholders rated market knowledge and innovation capacity.
Figure 31: Importance of different factors for firm strength: scores by emerging industry
Market knowledge and innovation capacity are rated somewhat higher by firms compared to non-firm respondents (Figure 32). The importance of human capital and entrepreneurship was rated similarly. A notable difference can be observed for access to funding, which non-firm respondents rated significantly higher
1 1.5 2 2.5 3 3.5 4 4.5 5 Internationalisation Partnerships Access to funding Entrepreneurship Human Capital Market knowledge and innovation
capacity most important least important 1 1.5 2 2.5 3 3.5 4 4.5 5 Access to funding Partnerships Internationalisation Human Capital Entrepreneurship Market knowledge and
innovation capacity
Creative industries Eco industries Mobile services
most important least important
Factors boosting the strength of emerging industries
compared to firm respondents. Internationalisation and partnerships are also seen as more important by non-firm stakeholders.
Figure 32: Importance of different factors for firm strength: scores for firm and non-firm respondents
2.3.
The importance of the availability of business support
services
The importance of different dimensions of the strength of firms was assessed with the following question:
How would you rate the importance of the following business support services being
available in your region? Respondents were asked to rank the importance of the following factors on a
scale of 1 to 5, where 1 is the least important and 5 is the most important.
Support for access to funding
Support for information exchanges and matchmaking amongst firms in the region
Support for collaborative R&D and/or technology transfer
Support for human resource development
Support for entrepreneurship development
Support for networking and finding external cooperation partners
Support for internationalisation
Business support services are seen as important overall as all types of services rank above 3. Support for external networking, access to finance and internationalisation are the business support services that are rated as most important for all emerging industries (Figure 33). Support for internal networking and support for HR development are viewed as less important.
1 1.5 2 2.5 3 3.5 4 4.5 5 Access to funding Partnerships Internationalisation Human Capital Entrepreneurship Market knowledge and innovation capacity
Firms Non-firm respondents
most important least important
Factors boosting the strength of emerging industries
Figure 33: Importance of the availability of different business support services for all emerging industries
There are some differences in the importance attached to different types of business support services by stakeholders from different emerging industries (Figure 34). Business support services appear to be most important for the eco industries, for which stakeholders rated all except one type of service higher than the other emerging industries. These services are least important for the creative industries. The differences are most significant for support for collaborative RDI and for support for access to finance, which are more important for the eco industries compared to the other two emerging industries.
Figure 34: Importance of business support services: scores by emerging industry
1 1.5 2 2.5 3 3.5 4 4.5 5
Supporting HR development Supporting internal networking Supporting collaborative RDI Supporting entrepreneurship Supporting internationalisation Supporting access to finance Supporting external networking
most important least important 1 1.5 2 2.5 3 3.5 4 4.5 5 Supporting access to finance Supporting internal networking Supporting external networking Supporting internationalisation Supporting HR development Supporting entrepreneurship Supporting collaborative RDI
Creative industries Eco industries Mobile services
most important least important
Factors boosting the strength of emerging industries
Non-firm respondents rated all types of business support services as more important compared to firm respondents (Figure 35). The biggest differences are for supporting access to finance and supporting collaborative RDI.
Figure 35: Importance of business support services: scores for firm and non-firm respondents
2.4.
Summary of findings
The importance of three different elements for boosting the strength of emerging industries was assessed for the pilot scoreboard: the strength of the regional business environment, the strength of firms and the availability of business support services. All the factors rated for the different elements received average scores above 3 on a scale of 1 to 5, indicating that they are seen as important for the strength of emerging industries. Overall, the importance of factors for the strength of firms was rated highest for market knowledge and innovation capacity, human capital and entrepreneurship, all of which received average scores above 4. Financial and knowledge factors are most important for the strength of the regional business environment. The importance of business support services was rated lowest overall. Support for external networking and for internationalisation as well as support for access to finance were rated highest amongst the different types of business support services.
There is a degree of consistency in the way in which different emerging industries rate the importance of different elements and factors although some notable differences can be observed. One noteworthy difference in rating is for regulatory and policy, which is significantly more important for eco industries. Business support services are also more important overall for the eco industries compared to the two other emerging industries. With only a couple of exceptions, non-firm respondents rated the importance of the different factors higher compared to firm respondents, with the most significant difference being observed for business support services. 1 1.5 2 2.5 3 3.5 4 4.5 5 Supporting access to finance Supporting internal networking Supporting external networking Supporting internationalisation Supporting HR development Supporting entrepreneurship Supporting collaborative RDI
Firms Non-firm respondents
most important least important
Characteristics of the regional business environment (framework conditions)
3. Characteristics of the regional
business environment (framework
conditions)
This chapter investigates the availability of different factors that underpin the strength of regional business
environments (framework conditions). All the graphs in this chapter measure availability on a scale of 1 to 5. Values below 3 indicate that stakeholders disagreed that a given factor was available within the region and values above 3 indicate that it was available.
Respondents were asked to rate their level of agreement with a series of statements related to the different dimensions of strength of regional business environments. The questions were as follows:
For all the statements on this page, please rate on a scale of 1 to 5, where 1 is ‘strongly disagree’ and 5 is ‘strongly agree’.
Financial characteristics
◦ In your region, there are sufficient funds available to companies.
◦ In your region, funding can be accessed in good time and with ease.
◦ In your region, there are effective support systems for accessing different types of funding
(business plan development support, signposting of funding opportunities, etc.).
Industrial characteristics
◦ Your region has a critical mass of companies in our sector or related sectors.
◦ Your region has well established technology parks, co-working spaces, incubators and/or
accelerators to boost the development of the industrial base.
◦ Your region has a good infrastructure (communication, energy, transport, etc.).
Market characteristics
◦ In your region, it is straightforward and not too costly to establish and run a business.
◦ In your region, there is a critical mass of customers and demand in your industry and the market
is consumer-driven.
◦ In your region, facilities are available for pre-commercial testing.
Cultural characteristics
◦ Your region has a qualified labour force and workers are available for a range of skills (managerial,
commercial, research, engineering, ICT).
◦ Your region provides incentives for boosting entrepreneurship and attracting and retaining talents
(financial resources, support programmes, etc.).
◦ Your region has an entrepreneurial culture.
Knowledge characteristics
◦ In your region, there are universities and/or research institutions undertaking research,
development and innovation activities related to your industry.
◦ In your region, there are established technology transfer organisations, design centres and similar
organisations.
◦ In your region, there are institutions providing relevant industry-specific training and coaching
(including vocational training).
Regulatory and policy characteristics
◦ Your region has a favourable regulatory environment.
◦ Your region has policies that favour the emergence and transformation of industries and that are
aligned with national and European policies.
◦ Your region undertakes public and industrial consultations as part of the policy making process.
Characteristics of the regional business environment (framework conditions)
◦ In your region, a sufficiently wide range of measures is available to support the development and
internationalisation of companies.
◦ In your region, a regional innovation and/or development agency with an established track record
is assisting firms effectively in fundraising and business development.
◦ In your region, adequate industry specific support measures have been put in place.
◦ In your region, support is available for entrepreneurs in the crucial phases of the business
lifecycle.
3.1.
Comparing emerging industries: the strength of
regional business environments
Financial, support and regulatory and policy factors rank lowest in terms of availability for all three emerging industries (Figure 36). The ratings for these three factors as well as for the market factor are unfavourable with score below 3. Industrial, knowledge and cultural factors are rated favourably although with relatively low score overall.
Figure 36: Availability of different factors for the strength of regional business environments (framework conditions) by emerging industry
Firm respondents rated the strength of regional business environments lower for all dimensions compared to non-firm respondents (Figure 37). The margin between the views of these different stakeholders is particularly wide for the knowledge and support dimensions.
1 1.5 2 2.5 3 3.5 4 4.5 5 Financial Industrial Market Cultural Knowledge Regulatory and policy Support
Creative industries Eco industries Mobile services
agree disagree
Characteristics of the regional business environment (framework conditions)
Figure 37: Availability of different factors for the strength of regional business environments (framework conditions) according to firm and non-firm respondents
The following spider charts present the results for the availability scores of the regional business environment for all factors by regions grouped into the three emerging industries for which they were identified as a hotspot. The charts for Catalonia (Barcelona) and Attiki (Atthens) show that their business environments are viewed as the least homogenous regional business environments with some factors such as financial and regulatory and policy factors representing particular weaknesses compared to other factors that are viewed stronger.
1 1.5 2 2.5 3 3.5 4 4.5 5 Financial Industrial Market Cultural Knowledge Regulatory and policy Support
Firms Non-firm respondents
agree disagree
Characteristics of the regional business environment (framework conditions)
3.1.1.
Creative industries: regional business environment scores by
region
Figure 38: Berlin Figure 39: Catalonia (Barcelona)
Figure 40: North Holland (Amsterdam) Figure 41: Inner London
1 2 3 4 5 Financial Industrial Market Cultural Knowledge Regulatory and policy Support 1 2 3 4 5 Financial Industrial Market Cultural Knowledge Regulatory and policy Support 1 2 3 4 5 Financial Industrial Market Cultural Knowledge Regulatory and policy Support 1 2 3 4 5 Financial Industrial Market Cultural Knowledge Regulatory and policy Support
Characteristics of the regional business environment (framework conditions)
3.1.2.
Eco industries: regional business environment scores by
region
Figure 42: Capital Region of Denmark
(Copenhagen) Figure 43: Lombardy (Milan)
Figure 44: Provence-Alpes-Côte d’Azur
1 2 3 4 5 Financial Industrial Market Cultural Knowledge Regulatory and policy Support 1 2 3 4 5 Financial Industrial Market Cultural Knowledge Regulatory and policy Support 1 2 3 4 5 Financial Industrial Market Cultural Knowledge Regulatory and policy Support
Characteristics of the regional business environment (framework conditions)
3.1.3.
Mobile services: regional business environment scores by
region
Figure 45: Attiki (Athens) Figure 46: South Finland (Helsinki)
Figure 47: Vienna 1 2 3 4 5 Financial Industrial Market Cultural Knowledge Regulatory and policy Support 1 2 3 4 5 Financial Industrial Market Cultural Knowledge Regulatory and policy Support 1 2 3 4 5 Financial Industrial Market Cultural Knowledge Regulatory and policy Support
Characteristics of the regional business environment (framework conditions)
3.2.
Comparing the strength of regional business
environments: regional rankings by factor
The following graphs rank the regional scores for the different dimensions of strength in regional business environments. The Capital Region of Denmark achieves the highest score for four of the framework conditions (industrial, cultural, regulatory and policy and support). South Finland is in the top three for all except the cultural framework conditions. Attiki ranks consistently in the bottom two and Catalonia in the bottom three. Figure 48: Financial framework conditions
Figure 49: Industrial framework conditions
1 1.5 2 2.5 3 3.5 4 4.5 5
Catalonia (Barcelona) Attiki (Athens) Lombardy (Milan) Average (all regions) North Holland (Amsterdam) Capital Region of Denmark (Copenhagen) Berlin Inner London South Finland (Helsinki) Provence-Alpes-Côte d’Azur (Marseille) Vienna agree disagree agree disagree 1 1.5 2 2.5 3 3.5 4 4.5 5 Attiki (Athens) Provence-Alpes-Côte d’Azur (Marseille) Catalonia (Barcelona) Lombardy (Milan) Average (all regions) Vienna Berlin Inner London South Finland (Helsinki) North Holland (Amsterdam) Capital Region of Denmark (Copenhagen)
agree disagree
Characteristics of the regional business environment (framework conditions)
Figure 50: Market framework conditions
Figure 51: Cultural framework conditions
1 1.5 2 2.5 3 3.5 4 4.5 5
Attiki (Athens) Catalonia (Barcelona) Provence-Alpes-Côte d’Azur (Marseille) Lombardy (Milan) Average (all regions) Capital Region of Denmark (Copenhagen) Berlin Vienna South Finland (Helsinki) North Holland (Amsterdam) Inner London
agree disagree
1 1.5 2 2.5 3 3.5 4 4.5 5
Provence-Alpes-Côte d’Azur (Marseille) Attiki (Athens) Catalonia (Barcelona) Vienna Average (all regions) North Holland (Amsterdam) South Finland (Helsinki) Inner London Berlin Lombardy (Milan) Capital Region of Denmark (Copenhagen)
agree disagree
Characteristics of the regional business environment (framework conditions)
Figure 52: Knowledge framework conditions
Figure 53: Regulatory and policy framework conditions
1 1.5 2 2.5 3 3.5 4 4.5 5
Attiki (Athens) Provence-Alpes-Côte d’Azur (Marseille) Catalonia (Barcelona) Inner London Average (all regions) North Holland (Amsterdam) Lombardy (Milan) Vienna South Finland (Helsinki) Capital Region of Denmark (Copenhagen) Berlin agree disagree 1 1.5 2 2.5 3 3.5 4 4.5 5 Catalonia (Barcelona) Attiki (Athens) Provence-Alpes-Côte d’Azur (Marseille) Lombardy (Milan) Average (all regions) Vienna Berlin Inner London North Holland (Amsterdam)
South Finland (Helsinki) Capital Region of Denmark (Copenhagen)
agree disagree
Characteristics of the regional business environment (framework conditions)
Figure 54: Support framework conditions
3.3.
Summary of findings
Knowledge, industrial and cultural factors are rated as slight strengths in the regional business environments surveyed for the pilot scoreboard. Regulatory and policy, support, market and financial factors are rated as weaknesses with average scores below 3.
Industrial factors are rated stronger for the creative industries and for the market factor there is a particular weakness for the eco industries. Aside from these two aspects for the creative and eco industries, the strength of the regional business environment is rated fairly similarly by stakeholders across all three emerging industries. Non-firm respondents rate the strength of regional business environments consistently higher than firm respondents. The difference is particularly marked for knowledge, support, and regulatory and policy factors. There are significant differences in the strength of regional business environments across the 10 regions surveyed. No region ranks favourably for all factors. Financial framework conditions are the weakest, scoring unfavourable in all regions and very low for Catalonia and Attiki. Support framework conditions and regulatory and policy framework conditions are also unfavourable in all but two regions (the Capital Region of Denmark and South Finland). The highest scores are obtained for industrial and knowledge framework conditions. There is a particularly notable difference in market framework conditions between the northern and southern regions. Attiki, Catalonia, Provence-Alpes-Côte d’Azur and Lombardy have weak market scores below the average for all regions. Inner London, North Holland, South Finland, Vienna and Berlin on the other hand have positive, although only slightly positive, market scores.
1 1.5 2 2.5 3 3.5 4 4.5 5
Attiki (Athens) Catalonia (Barcelona) Provence-Alpes-Côte d’Azur (Marseille) Average (all regions) Lombardy (Milan) Berlin Inner London North Holland (Amsterdam) Vienna South Finland (Helsinki) Capital Region of Denmark (Copenhagen)
agree disagree
Indicators of firm strength
4. Indicators of firm strength
This chapter investigates the availability of different factors that underpin the strength of firms. All the graphs
in this chapter measure availability on a scale of 1 to 5. Values below 3 indicate that stakeholders disagreed that a given factor was available within the region and values above 3 indicate that it was available.
Respondents were asked to rate their level of agreement with a series of statements related to the different dimensions of firm strength. Respondents rated the extent to which a given characteristic applies to their firm (or firms in their region). The questions were as follows:
For all the statements on this page, please rate on a scale of 1 to 5, where 1 is ‘strongly disagree’ and 5 is ‘strongly agree’.
Access to funding
◦ Your firm reinvests a significant share of its revenues into its activities.
◦ Your firm has sufficient access to public funding.
◦ Your firm has sufficient access to private funding.
◦ Your firm is able to raise funds in an acceptable time frame.
National and international contracts
◦ Your firm has established contracts with other firms or institutions in the region or within the
cluster.
◦ Your firm has contracts with companies in different sectors.
◦ Your firm has contracts with companies based in other countries.
Internationalisation
◦ Your firm has been successful in attracting foreign investment.
◦ Your firm has been successful in exporting its products and/or services to several foreign
countries.
◦ Your firm is benefitting from having established operations in several other countries.
Human Capital
◦ Your firm has been able to attract and retain talents.
◦ Your firm takes advantage of the experience and expertise of its employees.
◦ Your firm offers attractive wages adapted to the local cost of living.
Entrepreneurship
◦ Your firm’s leadership team has a strong track record in raising funds.
◦ Your firm’s leadership team includes one or several serial entrepreneurs.
◦ Your firm’s leadership regularly reviews and adapts its strategic plans based on changing
customer needs.
Market knowledge and innovation capacity
◦ Your firm identifies and seizes market opportunities and manages new market entries effectively.
◦ Your firm is effective at transforming ideas and innovations into products and services.
Indicators of firm strength
4.1.
Comparing emerging industries: firm strength in the
different regions
The main firm strengths identified are human capital and market knowledge and innovation capacity (Figure 55). Entrepreneurship and national and international agreements are also rated somewhat favourably. Internationalisation, which was rated as the least important of the factors for firm strength, also ranks lowest in terms of availability with an unfavourable rating for all three emerging industries. Access to funding is judged neither as strength nor as a weakness of firms. Overall, the scores between different industries are quite similar. National and international agreements and internationalisation rank more favourable for mobile services and the eco industries respectively.
Figure 55: Availability of different factors for the strength of firms by emerging industry
Firm respondents assess the strengths of firms more favourably overall compared to non-firm respondents (Figure 56). The difference is most significant for human capital and it is also notable for entrepreneurship and market knowledge and innovation capacity. For internationalisation, firms identified this as a weakness whereas other stakeholders saw this factor as a slight strength for firms in their region.
1 1.5 2 2.5 3 3.5 4 4.5 5 Access to funding National and international agreements Internationalisation Human Capital Entrepreneurship Market knowledge and
innovation capacity
Creative industries Eco industries Mobile services
agree disagree
Indicators of firm strength
Figure 56: Availability of different factors for the strength of firms according to firm and non-firm respondents
The following spider charts present the results for the firm strength for all factors by regions grouped into the three emerging industries for which they were identified as a hotspot. The charts show that, overall, the assessment of firm strengths is rather positive across all regions, while access to finance and internationalisation show in general as the least positive factors.
1 1.5 2 2.5 3 3.5 4 4.5 5 Access to funding National and international agreements Internationalisation Human Capital Entrepreneurship Market knowledge and innovation capacity
Firms Non-firm respondents
agree disagree