Individual differences in risk-taking tendencies modulate the neural
processing of risky and ambiguous decision-making in adolescence
N.E. Blankenstein
a,b,*, E. Schreuders
a,b, J.S. Peper
a,b, E.A. Crone
a,b,
A.C.K. van Duijvenvoorde
a,baDepartment of Developmental and Educational Psychology, Institute of Psychology, Leiden University, The Netherlands bLeiden Institute for Brain and Cognition, The Netherlands
A R T I C L E I N F O
Keywords:
Individual differences Risk taking Ambiguity Adolescence fMRI
A B S T R A C T
Although many neuroimaging studies have investigated adolescent risk taking, few studies have dissociated be-tween decision-making under risk (known probabilities) and ambiguity (unknown probabilities). Furthermore, which brain regions are sensitive to individual differences in task-related and self-reported risk taking remains elusive. We presented 198 adolescents (11–24 years, an age-range in which individual differences in risk taking are prominent) with an fMRI paradigm that separated decision-making (choosing to gamble or not) and reward outcome processing (gains, no gains) under risky and ambiguous conditions, and related this to task-related and self-reported risk taking. We observed distinct neural mechanisms underlying risky and ambiguous gambling, with risk more prominently associated with activation in parietal cortex, and ambiguity more prominently with dorsolateral prefrontal cortex (PFC), as well as medial PFC during outcome processing. Individual differences in task-related risk taking were positively associated with ventral striatum activation in the decision phase, spe-cifically for risk, and negatively associated with insula and dorsomedial PFC activation, spespe-cifically for ambiguity. Moreover, dorsolateral PFC activation in the outcome phase seemed a prominent marker for individual differ-ences in task-related risk taking under ambiguity as well as self-reported daily-life risk taking, in which greater risk taking was associated with reduced activation in dorsolateral PFC. Together, this study demonstrates the importance of considering multiple risk-taking measures, and contextual moderators, in understanding the neural mechanisms underlying adolescent risk taking.
Introduction
Adolescence, defined as the developmental phase between childhood
and adulthood, is often described as a period marked by increases in risky behaviors such as excessive alcohol use and reckless driving, and a strong
need for exploration (Crone and Dahl, 2012; Steinberg, 2008).
Theoret-ical models have explained this rise in risk-taking behavior by long-lasting development of subcortical and cortical brain regions and their connections, in which regions involved in affective processing and reward sensitivity peak in reactivity during adolescence, whereas cortical brain regions supporting cognitive control undergo a more protracted
development (Casey et al., 2008; Somerville et al., 2011; Crone and Dahl,
2012; Casey 2015). Although a wealth of research has focused on the neural mechanisms underlying adolescent risk taking, few studies have systematically investigated the relation with actual risk-taking behavior
either inside or outside the laboratory. These studies report conflicting
findings, have relatively small sample sizes, or focus on only one or two
brain regions-of-interest (for an excellent review, seeSherman et al.,
2017). Furthermore, although adolescence may be a period of
height-ened risk-taking tendencies on average, not all adolescents are risk takers (Bjork and Pardini, 2015), and risk-taking tendencies vary substantially between adolescents. Thus, including predictors of behavior on the in-dividual level may be key in understanding what drives adolescent risk taking. In this study we investigated the neural mechanisms underlying individual differences in adolescent risk taking, using task-related and self-report measures of risk-taking tendencies in a large adolescent sample.
A number of brain regions have been associated with individual
dif-ferences in risk-taking tendencies in adolescence (Sherman et al., 2017).
For instance, a greater ventral striatum (VS) response when receiving monetary rewards has been associated with a greater self-reported drive
to pursuit rewards, fun-seeking tendencies (Braams et al., 2015; Van
* Corresponding author. Department of Developmental and Educational Psychology, Institute of Psychology, Leiden University, Wassenaarseweg 52, 2333 AK, Leiden, The Netherlands. E-mail address:[email protected](N.E. Blankenstein).
Contents lists available atScienceDirect
NeuroImage
journal homepage:www.elsevier.com/locate/neuroimage
https://doi.org/10.1016/j.neuroimage.2018.01.085
Received 8 September 2017; Received in revised form 19 December 2017; Accepted 30 January 2018 Available online 3 February 2018
Duijvenvoorde et al., 2014), the likelihood of engaging in real-life risky
behaviors (Galvan et al., 2007), and increased frequencies of illicit drug
use, binge drinking, and sexual risky behaviors (Bjork and Pardini, 2015;
Braams, Peper, van der Heide, Peters and Crone, 2016). The ventrome-dial prefrontal cortex (VMPFC), closely interacting with the VS, has been
additionally related to measures of reward sensitivity in adolescents (van
Duijvenvoorde et al., 2015) as well as with greater risk preferences in
adults (Blankenstein et al., 2017; Engelmann and Tamir, 2009).
Conversely, reduced risk-taking tendencies in laboratory choice tasks have been related to increased anterior insula and dorsomedial prefrontal
cortex (DMPFC) activation, regions that are typically related to conflict
and uncertainty in decision making, and to the integration of cognitive
and affective neural signals (Smith et al., 2014; van Duijvenvoorde et al.,
2015; Van Leijenhorst et al., 2010). Finally, reduced activation in the lateral prefrontal cortex (LPFC), a key region involved in self-control (Dixon, 2015), has been associated with greater laboratory risk taking
in young adults (Gianotti et al., 2009). In contrast, studies with
adoles-cents have shown that longitudinal declines in LPFC activation were associated with declines in self-reported frequency of real-life risky
be-haviors (such as getting high or drunk at parties;Qu et al., 2015). Taken
together, these studies highlight candidate regions sensitive to individual differences in risk-taking tendencies, yet none of these studies have included a substantial adolescent sample size, nor provided a compre-hensive overview of task-related, and self-reported, measures of risk taking.
Importantly, the majority of these studies used fMRI paradigms that
present explicit risky (e.g., the Columbia Card Task;van Duijvenvoorde
et al., 2015), rather than ambiguous risky, choice contexts. That is, while explicit risk presents known probabilities (such as in a coin toss, in which
the chance of ‘tails’ is known: 50%), ambiguity presents unknown
probabilities (such as texting while driving: the chance of causing an
accident, for example, is unknown; Tversky and Kahneman, 1992).
However, the majority of risky situations in daily life presents ambiguous risk. Indeed, in adolescence, the tendency to gamble under ambiguity, but not risk, has been associated with individual differences in real-life
risk-taking behavior, such that a higher‘tolerance’to ambiguity was
related to higher levels of reckless behavior such as speeding and having
unprotected sex (Blankenstein, Crone, van den Bos and van
Duijven-voorde, 2016; Tymula et al., 2012), and rebellious behavior such as
staying out late (van den Bos and Hertwig, 2017). This may suggest that
behavior under ambiguity is a better reflection of adolescent risk taking
in real life (Blankenstein et al., 2016; Tymula et al., 2012; van den Bos
and Hertwig, 2017). Possibly, a tolerance to ambiguity in adolescence is important for accomplishing important goals prominent in adolescence, such as exploring new environments, and gathering information about
the world (e.g.,Crone and Dahl, 2012; Hartley and Somerville, 2015).
Consequently, distinguishing the mechanisms underlying risk and am-biguity coding in adolescence is pivotal given that these may have different relations with observed risk-taking behavior in adolescence. To date, the neural mechanisms underlying risky versus ambiguous decision-making have not been investigated in adolescence, nor have these been related to individual differences in risk-taking tendencies in adolescence.
Taken together, we aimed to elucidate individual differences in task-related and self-reported risk-taking behavior in relation to brain acti-vation in risky and ambiguous decision contexts, in 198 adolescents aged
11–24 years, an age range in which individual differences in daily life
risk-taking are most prominent (Bjork and Pardini, 2015; Willoughby
et al., 2013). We applied the same paradigm as has been previously
re-ported in a different sample of young adults (Blankenstein et al., 2017),
which allows to study choice (choosing to gamble or not) and reward processing (gains versus no gains) under risk and ambiguity. In line with this prior study with adults, we expected few overall differences between
risky and ambiguous gambling (Blankenstein et al., 2017, but seeHsu
et al., 2005; Huettel et al., 2006), although we expected that the DMPFC would particularly distinguish between risky and ambiguous outcomes
(Blankenstein et al., 2017). Particularly, we expected that individual differences in risk-taking tendencies would be positively associated with activation in VS and VMPFC, and negatively with DMPFC, insula, and
LPFC. Given the mixedfindings on the LPFC, this relation could also be
reversed (i.e., enhanced activation with greater risk taking;Qu et al.,
2015; Telzer et al., 2013). Second, given that behavior under ambiguity,
but not risk, has been related to real-life risk-taking tendencies (
Blan-kenstein et al., 2016; Tymula et al., 2012; van den Bos and Hertwig,
2017), we expected these brain-behavior associations to be more
pro-nounced under conditions of ambiguity than risk.
Methods
Participants
Two hundred and sixteen right-handed individuals (110 females, 106 males) between 11 and 24 years old participated in this study.
Partici-pants were part of a longitudinal study (‘Braintime’, which included
three time points each separated by a two-year interval), and were recruited through schools and local advertisements. The data of the
current study were collected at the third time point, and this was thefirst
time the current task was presented. Eighteen participants were excluded from analyses because they were either diagnosed with a psychiatric
disorder (n¼5), exceeded movement in the MRI scanner with more than
3 mm (n¼1), loss of data (n¼3), or because of too few trials in which
the gambling option was chosen (i.e., fewer thanfive gambles in either
the risky or ambiguous condition,n¼9; see‘Wheel of fortune task’). The
final sample therefore included 198 healthy participants (94 female, 104
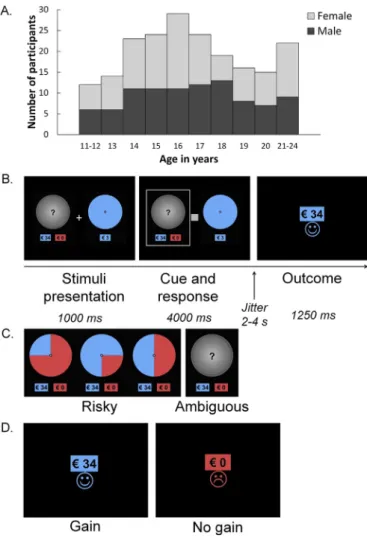
male,MAge¼17.15,SDAge¼2.75, range 11.94–24.68 years, seeFig. 1A).
IQ fell in the normal range, as estimated on previous time points of the
longitudinal Braintime study (T1: M¼110.08, SD ¼ 9.54; T2:
M¼107.84,SD¼10.17), using subtests of the WISC-III (participants
8-to 15-years old) or WAIS-III (participants 16 and older), and did not
correlate with age (see alsoBraams et al., 2015; Peters et al., 2016).
This study was approved by the institutional review board of the University Medical Center. Adult participants and parents of underage participants provided written informed consent, and underage partici-pants provided written assent. All anatomical scans were cleared by a radiologist and no abnormalities were reported. Participants were screened for MRI contra indications and psychiatric or neurological disorders and had normal or corrected-to-normal vision.
Wheel of fortune task
Participants played a child-friendly wheel of fortune task (seeFig. 1
and Blankenstein et al., 2017). Participants made a series of choices between pairs of wheels. One wheel represented a safe option (i.e., a 100% chance of winning 3 Euro), whereas the other option represented a
gambling option which could yield more money (i.e.,€31,€32,€33, or
€34) but could also yield nothing (€0). The gambling option could either
be risky (probabilities were known) or ambiguous (probabilities were
unknown), and the safe option was a sure gain of€3 on every trial. In the
risky wheels, gain probabilities were presented as the portions of the wheels in blue, whereas no gain probabilities were presented as the
portions of the wheel in red. Of the risky trials, 30 trials reflected a
gamble with a 50% gain probability, 8 trials reflected a gamble with a
75% gain probability, and 8 trials reflected a gamble with a 25% gain
probability (Fig. 1C). In the ambiguous trials, the wheel was covered with
a grey lid showing a question mark (Fig. 1C). Participants played 46
ambiguous trials and 46 risky trials, which were presented inter-mixed. After the choice, participants were presented with the reward
outcome (Fig. 1D; gain, no gain). The task was programmed such that the
no gains was randomized for each participant, and the computer randomly (without replacement) selected one of the four possible
amounts (€31,€32,€33, or€34) to present on a trial-by-trial basis. The
outcome for gains was presented with the amount in blue over a smiley
face, and the outcome for no gains was presented with€0 in red over a
sad face. Finally, the expected value (i.e., the probability*amount) of the gambling options was much higher than the safe option (which was
consistently€3). This was done to encourage gambling behavior, so that
participants had a sufficient number of trials for the comparisons of brain
activation of gambling under risk and under ambiguity, their corre-sponding reward outcomes, and associations with individual differences in risk-taking tendencies.
The task was presented in the scanner via E-prime (Psychology Software Tools). Participants were presented with the pairs of wheels presenting a gamble and safe option. Gamble and safe options were randomly displayed on the left or right side of the screen on a trial-by-trial basis. After 1000 msec a grey square appeared in the center of the screen, prompting the participants to respond. A response had to be given within a 3000 msec interval. Participants responded with their
right index finger (to select the wheel on the left) and right middle
finger (to select the wheel on the right). A grey selection frame around
the chosen wheel confirmed the response, and remained visible for the
duration of the 3000 msec interval. If participants failed to respond
within 3000 msec, the words‘TOO LATE’appeared in the center of the
screen for 1250 ms, after which the next trial began. On average, 0.99% of the trials did not include a response, and these trials were excluded from all analyses. The choice phase was separated from the outcome
phase by afixation cross of 2–4 sec (jittered, with increments of 500
msec). The reward outcomes (gain, no gain, or safe gain) were pre-sented for 1250 msec. The inter-trial-intervals and the optimal trial
sequence were determined with OptSeq (Dale, 1999), with jittered
in-tervals varying between 0 and 9350 ms. In addition, each trial was
preceded by a 500 ms fixation cross, which was not part of the
inter-trial-interval.
Questionnaires
To test for associations between brain activation during decision-making under risk and ambiguity and indices of real-life risk taking, 192 participants completed the Adolescent Risk-Taking Questionnaire
(ARQ;Gullone et al., 2000). In particular, we focused on thebehavior
scale of this questionnaire, which assesses the frequency of engaging in risky activities in real life with four subscales: Thrill-seeking (Cronbach's
α¼.205), Rebellious (α¼.888), Reckless (α¼.497), and Antisocial
behavior (α¼.508). Participants indicated on a 5-point Likert scale how
often they engaged in risky activities (with 1 indicatingnever and 5
indicatingvery often). Examples include‘Snow skiing’(Thrill-seeking),
‘Staying out late’(Rebellious),‘Having unprotected sex’(Reckless), and
‘Cheating’(Antisocial).
To test for associations with self-reported reward approach and avoidant behavior, 182 participants completed the Behavioral Inhibi-tion System/Behavioral ActivaInhibi-tion System quesInhibi-tionnaire (BIS/BAS; Carver and White, 1994). The BIS/BAS questionnaire is comprised of four subscales: BAS Drive (a measure of persistence in the pursuit of
goals,α¼.750), BAS Fun seeking (a measure of desire for rewards and
the willingness to approach rewards,α¼.512), BAS Reward
Respon-siveness (a measure of responses to rewards and reward anticipation,
α¼.659), and BIS (a measure of punishment sensitivity, α¼.779).
Participants indicated on a 4-point Likert scale the degree to which
statements were applicable to them with (with 1 indicatingvery true
and 4 indicatingvery false). Examples include‘When I want something I
usually go all-out to get it’ (BAS Drive), ‘I'm always willing to try
something new if I think it will be fun’(BAS Fun seeking),‘When I get
something I want, I feel excited and energized’(BAS Reward
respon-siveness), and ‘I worry about making mistakes’ (BIS). Items were
recoded such that higher scores indicates more approach (BAS) or avoidant (BIS) behavior.
Procedure
Participants received instructions about the MRI session in a quiet laboratory room, and were accustomed to the MRI environment with a mock scanner. Next participants received instructions about the wheel of fortune task, and practiced ten trials on a laptop. We explained the
participants that the ambiguous wheel could reflect a gamble of any of
the risky probabilities (i.e., 25%, 50%, 75%). In addition, we explained that the computer would randomly select the outcomes of three trials, of which the average amount was paid out in addition to the standard payout fee. Eventually, the computer selectively drew a gain, a no gain, and a safe gain outcome (or a gain and two no gain outcomes if the participant never chose the safe option). This draw
amounted to an additional rounded payout of€11 or €12 for each
participant.
The wheel of fortune task lasted approximately 18 min, in two runs of 9 min each, win a short break in between. Participants could respond
with their right index and middlefingers using a button box that was
attached to the participant's leg. The task was followed by a
high-definition structural scan, which lasted approximately 5 min.
Participants completed the ARQ and BIS/BAS questionnaire at home,
online via Qualtrics (www.qualtrics.com), before the scan date. Adult
participants received €60 and underage participants received€30 for
their participation, in addition to their winnings in the wheel of fortune
task (€11 or€12), and small presents.
Fig. 1. A.Number of participants across age per gender.B.Example trial of the wheel of fortune task showing an ambiguous trial with gain as reward
MRI data acquisition
We used a 3T Philips scanner (Philips Achieva TX) with a standard whole-head coil. Functional scans were acquired during two runs of 246 dynamics each, using T2* echo-planar imaging (EPI). The volumes
covered the whole brain (repetition time (TR) ¼ 2.2 s; echo time
(TE) ¼ 30 ms; sequential acquisition, 38 slices; voxel size
2.752.752.75 mm;field of view (FOV)¼220220114.68 mm).
Thefirst two volumes were discarded to allow for equilibration of T1
saturation effects. A high-resolution 3D T1 scan for anatomical reference
was obtained after the wheel of fortune task (TR¼9.76 msec, TE¼4.59
msec, 140 slices, voxel size¼0.875 mm, FOV¼224177168 mm).
MRI data analyses
Preprocessing
We analyzed the data with SPM8 (Wellcome Department of Cognitive Neurology, London). Images were corrected for slice timing acquisition and rigid body motion. Functional volumes were spatially normalized to T1 templates. Translational movement parameters never exceeded 3 mm
(<1 voxel) in any direction for any participant or scan (movement range:
0.31–0.19 mm, M¼0.065, SD¼0.028). The normalization algorithm
used a 12-parameter affine transform with a nonlinear transformation
involving cosine basis function, and resampled the volumes to 3 mm3
voxels. Templates were based on MNI305 stereotaxic space. The func-tional volumes were spatially smoothed using a 6 mm full width at half maximum (FWHM) isotropic Gaussian kernel.
General-linear model
We used the general linear model (GLM) in SPM8 to perform
statis-tical analyses on individual participants’data. The fMRI time series were
modeled as a series of two events convolved with a canonical hemody-namic response function (HRF): the choice phase and the outcome phase. First, the onset of the choice phase was modeled with a duration of
response (1000 msecþresponse time; seeFig. 1). Events were modeled
separately for gambling under risk and gambling under ambiguity, and for choosing the safe option under risk and choosing the safe option under ambiguity, which resulted in four conditions: Risk Gamble, Am-biguity Gamble, Risk Safe, and AmAm-biguity Safe. Second, the onset of the outcome phase was modeled with zero duration. We modeled the out-comes (gain, no gain, and safe gain) following a risky or ambiguous gamble, or safe choice, which resulted in six conditions in the outcome phase: Risk Gain, Risk No Gain, Ambiguity Gain, Ambiguity No Gain, Risk Gain Safe, and Ambiguity Gain Safe. In the current study we were particularly interested in brain activation during gambling, and brain activation during reward processing following a gamble.
Trials on which participants did not respond were modeled separately as a covariate of no interest. In addition, we included six motion
parameters as noise regressors. The least-squares parameter estimates of
the height of the best-fitting canonical HRF for each condition separately
were used in pairwise contrasts. These pairwise comparisons resulted in
subject-specific contrast images, which were used for the second-level
group analyses. We conducted all second-level group and regression
analyses with Family Wise Error (FWE) cluster correction (p<.05, using
a primary voxel-wise threshold ofp<.001, uncorrected;Blankenstein
et al., 2017; Woo et al., 2014). We used the MarsBaR toolbox (Brett et al., 2002;http://marsbar.sourceforge.net) to visualize patterns of activation
in clusters identified in the whole-brain regressions. Finally, the
co-ordinates of local maxima are reported in MNI space.
Analyses with individual differences. First, we included a GLM to test for associations between brain activation and individual differences in gambling behavior in the wheel of fortune task (i.e., task-related risk-taking tendencies). A second model was included to test for associations with ARQ and BIS/BAS scores (i.e., self-reported risk-taking tendencies).
Task-related risky and ambiguous gambling were both included in thefirst
model so that when testing for unique effects of risky gambling, we controlled for ambiguous gambling (i.e., this was a covariate of no inter-est), and vice versa. The same approach was used for the ARQ and BIS/BAS questionnaire, in which we entered all subscales of both questionnaires in one model. Due to the absence of correlations between task behavior and self-report measures, including all individual-difference measures in one
GLM did not change any of the reportedfindings. Finally, although age was
not included as a regressor of interest in our primary models, we ran our models with and without age (linear) as a covariate, and report in the text
which results remain significant when controlling for age. In addition, we
exploratively report effects of age in the corresponding tables.
Results
Behavioral results
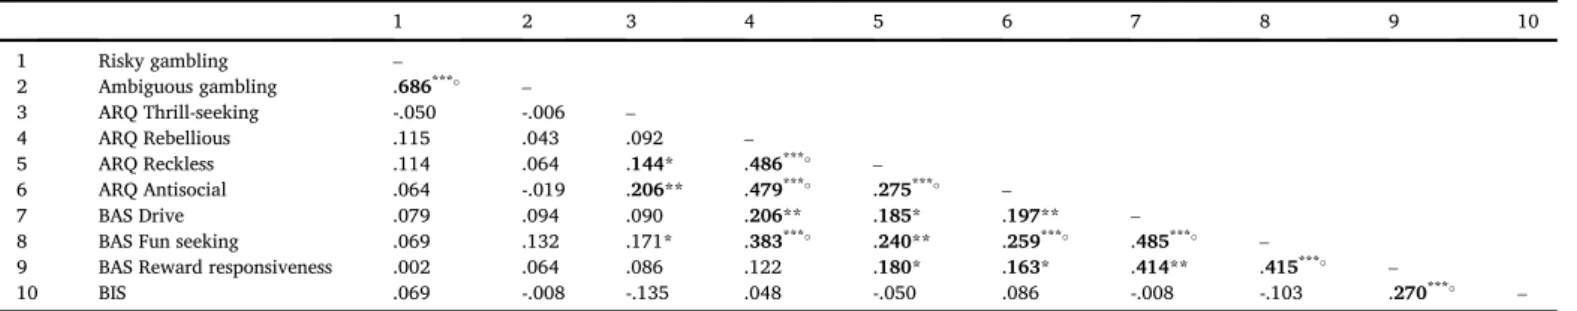
Table 1summarizes the correlations between the behavioral mea-sures (wheel of fortune task, ARQ, and BIS/BAS). In the wheel of fortune
task (n¼198), a paired samplest-test showed that participants gambled
a comparable proportion of times under risk and under ambiguity
(t(197)¼ .158,p¼.116,Mrisk¼.74,SDrisk¼.21, rangerisk¼.22–1.00,
Mambig¼.76,SDambig¼.25, rangeambig¼.11–1.00), although there were
individual differences in gambling behavior (seeFig. 2A). A correlation
analysis showed that gambling under risk and ambiguity were correlated
(r ¼.686,p<.001;Table 1). Furthermore, a paired samplest-test on
reaction times showed that when choosing to gamble, participants
responded significantly slower in ambiguous than in risky trials
(t(197)¼ 5.41, p<.001, Mrisk¼585.81, SDrisk¼193.51, M
am-big¼645.36,SDambig¼213.63). Finally, given the presence of outcome
feedback in the task, we tested for changes in behavior under risk and
Table 1
Correlation matrix of the behavioral measures, showing Pearson'sr.
1 2 3 4 5 6 7 8 9 10
1 Risky gambling –
2 Ambiguous gambling .686*** –
3 ARQ Thrill-seeking -.050 -.006 –
4 ARQ Rebellious .115 .043 .092 –
5 ARQ Reckless .114 .064 .144* .486*** –
6 ARQ Antisocial .064 -.019 .206** .479*** .275*** –
7 BAS Drive .079 .094 .090 .206** .185* .197** –
8 BAS Fun seeking .069 .132 .171* .383*** .240** .259*** .485*** –
9 BAS Reward responsiveness .002 .064 .086 .122 .180* .163* .414** .415*** –
10 BIS .069 -.008 -.135 .048 -.050 .086 -.008 -.103 .270*** –
Note.Risky and ambiguous gambling:n¼198, ARQ:n¼192, BIS/BAS:n¼182, ARQ and BIS/BAS:n¼179. Correlation is significant with Bonferroni correction for multiple comparisons.
ambiguity across time. To this end, we divided gambling behavior across four task bins of 11 or 12 trials per bin, per condition (risk and ambi-guity). A within (task bin) * between (risk vs ambiguity) subjects ANOVA
with age as a covariate showed a significant interaction effect between
condition and task bin (F(3, 576)¼5.84,p<.001,η2¼.03;Fig. 2B), in
which gambling increased slightly across task bins in the ambiguous (F(3,
579)¼18.83, p<.001,η2¼.09) but not in the risky condition (F(3,
579)¼1.11,p¼.35).
Correlation analyses on the ARQ questionnaire (n¼192) showed that
the subscales were all moderately correlated, with the exception of
Thrill-seeking and Rebellious behavior (Table 1). With respect to the BIS/BAS
questionnaire (n¼182), we observed that BAS Drive, BAS Fun seeking,
and BAS Reward responsiveness were moderately correlated, and that BAS Reward responsiveness was additionally correlated with BIS. Furthermore,
correlation analyses between the ARQ and BIS/BAS scores (n ¼ 179)
showed that ARQ Rebellious was correlated with BAS Drive and BAS Fun seeking, and that ARQ Reckless and ARQ Antisocial were both correlated with all BAS subscales. Finally, task behavior was not related to any of the
self-report measures (Table 1). Age effects on all behavioral measures are
reported in the supplementary materials (Appendix A1).
fMRI results
Whole-brain contrasts
Choice phase. First, we investigated which brain regions showed greater
activation during gambling under risk versus ambiguity. The contrast
Risk Gamble>Ambiguity Gamble revealed greater activation for risk
compared to ambiguity in the bilateral precentral gyrus, right VLPFC, and
posterior parietal cortex (PPC;Fig. 3A,Table 2). The reversed contrast
(Ambiguity Gamble>Risk Gamble) resulted in left DLPFC, bilateral
temporal lobe, inferior parietal cortex (angular gyrus) and precuneus
activation (Fig. 3B,Table 2). When exploratively testing for effects of age,
only activation in the superior parietal lobe increased with age for
gambling under ambiguity compared with risk (see Table A1;
Figure A1A).
Although in the current study we were interested in contrasting risky and ambiguous gambling, an additional interesting analysis may be to compare gambling versus choosing safe across risk and ambiguity. We
report the results of this analysis in the supplementary materials (
Ap-pendix A2; Table A2; Figure A2).
Outcome phase. To test which regions coded reward outcomes, wefirst
calculated the contrast Gain>No Gain. This contrast resulted in robust
activation in bilateral striatum, VMPFC, PPC, and angular gyrus (Fig. 3C,
Table 3). When exploring age effects on this contrast, we observed greater superior parietal and motor cortex activation for younger ages (Table A3; Figure A3).
To more specifically examine which regions differentially coded
reward outcomes following a risky versus ambiguous gamble, we ran a whole-brain condition (risk, ambiguity) * reward outcome (gain, no
gain) ANOVA. This resulted in a significant interaction effect in the MPFC
Fig. 2. A. Correlation between proportion gambling under risk and proportion gambling under ambiguity in the wheel of fortune task.B.Proportion gambling across time (task bins) for the ambiguous (black line) and risky (grey line) conditions. The y-axis is displayed from 0.5 to 1 to more clearly illustrate the interaction effect.
(Fig. 3D;Table 3). To understand the direction of this interaction effect, we plotted the parameter estimates of this region for risk and ambiguity,
and gain and no gain, separately (Fig. 3D, right panel). From this plot it
can be seen that this interaction is particularly driven by reward out-comes following an ambiguous gamble. That is, the difference in brain activation in the MPFC between gain and no gain following an ambig-uous gamble is larger than this difference following a risky gamble. We also tested whether the effects observed in the whole-brain ANOVA on reward outcomes in the MPFC were associated with age, by extracting the parameter estimates of this ROI for the difference scores and
corre-lating these with age. No significant relations were observed (allp's>.1).
Associations with individual-differences measures
Regressions with task behavior: choice phase. Our main interest was to examine relations between brain activation during risky and ambiguous decision-making and individual differences in risk-taking tendencies. First we examined whether individual differences in gambling behavior in the wheel of fortune task were associated with different activation patterns during risky and ambiguous gambling, respectively. We
observed a positive effect of risky gambling on the Risk Gamble>
Am-biguity Gamble contrast in the VS (Fig. 4A,Table 4). That is, participants
who gambled more frequently on risky trials (controlling for gambling in ambiguous trials) showed greater activation in this region during risk
compared with ambiguity (Fig. 4A, right panel).
In the reversed contrast (Ambiguity Gamble>Risk Gamble), we
observed a negative effect of ambiguous gambling (controlled for risky
gambling) in bilateral insula, DMPFC, and dorsal ACC/SMA (Fig. 4B,
Table 4). Specifically, these analyses show that participants who gambled less frequently on ambiguous trials in general, showed greater activation
in these regions for Ambiguity Gamble>Risk Gamble when choosing to
gamble (Fig. 4B, right panel).
When we included age as an additional covariate in these analyses, these effects remained the same.
Regressions with task behavior: outcome phase. Similarly, as for the choice phase, we investigated effects of gambling in the wheel of fortune task on
the reward outcome phase (Gain>No Gain, collapsed across risky and
ambiguous conditions). A whole-brain regression with risky and
ambiguous gambling behavior as predictors showed a specific negative
effect of ambiguous gambling in the right DLPFC and right superior
temporal gyrus (extending into the posterior insula;Fig. 5A,Table 5).
These effects remained the same when including age as an additional covariate.
We used an ROI approach to test whether the DLPFC activation differed between reward outcome processing following a risky or an ambiguous gamble. This was not the case: the partial correlations be-tween ambiguous gambling (controlling for risky gambling) and DLPFC
did not differ significantly between reward processing following risk or
ambiguity (Fisher'sZ¼1.35,p¼.17; Ambiguity Gain>Ambiguity No
Gain:r¼ .302,p<.001; Risk Gain>Risk No Gain:r¼ .183,p¼.01).
This result indicates that those participants who gambled less frequently in the ambiguous trials showed greater activation in this region when processing rewards, but this was not driven by processing rewards after
risk or ambiguity (Fig. 5A, right panel).
Regressions with self-reported risk-taking behavior: choice phase. To test which regions were associated with self-reported risk-taking measures, we included ARQ and BIS/BAS subscales in a whole-brain regression. No Table 2
MNI coordinates of Local Maxima Activated for the contrasts Risk Gamble>Ambiguity Gamble, and the reversed contrast. Results were FWE cluster-corrected (p<.05).
Area of activation MNI coordinates T pFWE Volume
x y z
Risk Gamble>Ambiguity Gamble R middle occipital gyrus,
including bilateral parietal lobe, bilat. temporal gyrus, bilat. postcentral gyrus
33 85 16 17.32 <.001 9 196
L calcarine gyrus 0 85 1 15.43
R calcarine gyrus 12 91 4 14.65
R precental gyrus 48 5 31 8.96 <.001 302 R middle frontal gyrus 27 4 52 7.22 <.001 217 R superior frontal gyrus 24 2 70 3.32
R inferior frontal gyrus (pars triangularis)
51 38 13 6.04 <.001 235 R inferior frontal gyrus (pars
triangularis)
45 41 1 4.21
Ambiguity Gamble>Risk Gamble
R angular gyrus 57 67 34 7.25 <.001 307 L angular gyrus 42 64 31 4.09 <.001 346 R rolandic operculum,
including R superior temporal gyrus, R postcentral gyrus, R posterior insula
54 19 16 5.00 <.001 206
R rolandic operculum 45 19 16 4.85 R superior temporal gyrus 60 10 5 4.00
R precuneus 3 55 34 4.89 <.001 202
L middle cingulate cortex 12 49 37 4.67
L middle temporal gyrus 69 40 2 4.33 .025 81 L middle temporal gyrus 63 28 2 3.84
L middle frontal gyrus, including L superior frontal gyrus
30 20 49 4.47 <.001 177 36 11 58 3.90
21 29 52 3.60
Note:L¼left; R¼right; bilat¼bilateral. Anatomical labels are based on the Automated Anatomical Labeling (AAL) atlas.
Table 3
MNI coordinates of Local Maxima Activated for the contrast Gain>No Gain, irrespective of risk and ambiguity (FWE voxel-corrected,p<.05 and presented here withk>10) and the interaction effect of condition (risk, ambiguity) * reward outcome (Gain, No Gain; FWE cluster-corrected,p<.05).
Area of activation MNI coordinates T pFWE Volume
x y z
Gain>No Gain, voxel-corrected
R caudate nucleus 12 17 5 15.51 <.001 11 259
L caudate nucleus 9 17 5 13.73
L anterior cingulate cortex, including bilat. superior medial gyrus, R mid orbital gyrus, bilat. middle frontal gyrus, bilat. precuneus
6 44 1 10.83
L inferior gyrus, including L superior temporal gyrus
54 49 11 7.68 <.001 664 L middle temporal gyrus 63 7 17 6.96
L inferior temporal gyrus 60 58 11 6.75
R angular gyrus 42 73 40 7.12 <.001 230
R angular gyrus 39 67 55 5.82
R superior parietal lobe 33 76 52 5.30 R superior temporal gyrus,
including R fusiform gyrus
63 4 1 7.02 <.001 556 R middle temporal gyrus 63 4 23 6.92
R superior temporal gyrus 66 4 8 6.74
R putamen 30 13 7 5.97 <.001 58
L precentral gyrus 48 2 22 5.55 .001 24
Interaction effect Condition * Outcome, cluster-corrected L superior medial gyrus,
including R superior medial gyrus, R superior frontal gyrus, R anterior cingulate cortex
3 38 31 5.59 <.001 536
R superior frontal gyrus 18 50 40 4.38 R middle frontal gyrus 21 59 28 4.19
activation in hypothesized regions was observed during the choice phase
(Risk Gamble>Ambiguity Gamble or vice versa). The only clusters that
survived thresholding was a positive relation with BAS Drive and BAS Fun seeking in parietal and motor brain regions during Ambiguity
Gamble>Risk Gamble (summarized inTable 6). When including age as
an additional covariate, only the effect of BAS Drive survived cluster correction.
Regressions with self-reported risk-taking behavior: outcome phase. A similar regression was performed testing for effects of ARQ and BIS/BAS
sub-scales on the general contrast Gain>No Gain. First, we observed a
negative effect of ARQ Rebellious behavior in the bilateral DLPFC (Fig. 5B;Table 7). Specifically, this indicates that those participants who
show more rebellious behavior in daily life, showed significantly less
activation in the DLPFC when processing reward outcomes. Similar, but less pronounced, results were observed when including age as a covariate.
We tested whether this activation pattern was driven by outcome processing in the risky or ambiguous condition. When comparing the partial correlations between Rebellious behavior (controlling for the other ARQ and BIS/BAS subscales) and DLPFC activation in the risky,
with the ambiguous condition, we observed no significant differences
between these conditions (left DLPFC: Fisher's Z¼.72, p¼.47, right
DLPFC:Z¼.06,p¼.95; ambiguity: left DLPFCr¼ .307,p<.001, right
DLPFC:r¼ .258,p¼.001, risk: left DLPFC:r¼ .239,p¼.002, right
DLPFC:r¼ .252,p¼.001;Fig. 5B, right panel). This shows that the
negative association between rebellious behavior and reward outcome processing did not depend on whether the reward was preceded by a risky or ambiguous gamble.
With respect to BAS Drive, a greater tendency to work for rewards was also associated with an attenuated left DLPFC response when
pro-cessing rewards (Fig. 5C,Table 7). These effects remained the same when
including age as an additional covariate.
Again we tested whether this activation pattern was driven by outcome processing in the risky or ambiguous condition. Similar to the association with Rebellious behavior, we observed that the association
with BAS Drive did not differ (Z¼ .104 p ¼.92) between rewards
following a risky (r ¼ .243,p¼.001) and ambiguous gamble (r ¼
.233,p¼.002,Fig. 5C, right panel).
Discussion
This study investigated the neural mechanisms underlying individual differences in risk-taking tendencies during risky and ambiguous decision-making in a large adolescent sample with a wide age range
(11–24 years). We specifically focused on two indices of risk taking:
task-related (gambling under risk and ambiguity) and self-reported indices of risk taking (the frequency of engaging in real-life risky behaviors and trait reward sensitivity). The analyses resulted in a number of main
findings. First, we discovered that risky versus ambiguous gambling are
reflected in different patterns of brain activation. Second, individual
differences in task-related risk-taking recruited different regions depending on whether the context was risky or ambiguous. Finally,
in-dividual differences in self-reported risk-taking were primarily reflected
in activation during reward outcome processing. The discussion is
organized alongside these mainfindings.
Neural mechanisms underlying risky and ambiguous decision-making
First, we investigated the neural correlates of gambling and reward
Fig. 4. A.The positive effect of risky gambling on Risk Gamble>Ambiguity Gamble in the ventral striatum. A higher frequency of gambling under risk was associated with increased ventral striatum activation during Risk
Gamble>Ambiguity Gamble.B.The negative effect of ambiguous gambling
on Ambiguity Gamble>Risk Gamble. Increased gambling behavior under
ambiguity was associated with an attenuated DMPFC and bilateral insula
response. The graphs are for illustrative purposes only. P.E.¼
param-eter estimate.
Table 4
MNI coordinates of Local Maxima Activated for the results of regressions with gambling behavior on Risk Gamble>Ambiguity Gamble and the reversed contrast. Results were FWE cluster-corrected (p<.05).
Area of activation MNI coordinates T pFWE Volume
x y z
Positive effect of risky gambling on Risk Gamble>Ambiguity Gamble
L caudate nucleus 15 2 25 4.86 <.001 170
R caudate nucleus 6 14 5 4.15 .008 105
Negative effect of ambiguous gambling on Ambiguity Gamble>Risk Gamble L anterior cingulate cortex 9 35 19 6.44 <.001 429 R anterior cingulate cortex 6 38 25 5.38
L superior medial gyrus 9 32 31 5.06 L supplementary motor area,
including R supplementary motor area, bilat. superior medial gyrus, bilat. superior frontal gyrus, R middle cingulate cortex
9 11 52 5.13 <.001 392 3 26 52 5.11
0 17 64 4.56
L insula lobe 27 26 4 4.88 .005 116
L insula lobe 30 11 14 4.49
L insula lobe 30 20 11 4.32
L inferior frontal gyrus (pars orbitalis)
36 26 5 3.53
R insula lobe 33 29 2 4.62 .005 117
R inferior frontal gyrus (pars orbitalis)
39 20 20 3.93
R inferior frontal gyrus (pars orbitalis)
42 29 17 3.46
processing under risk and ambiguity, using a previously validated fMRI
gambling paradigm (Blankenstein et al., 2017). Previous neuroimaging
studies in adults have questioned whether risk and ambiguity are
re-flected by the same underlying neural mechanisms, given that risk and
ambiguity preferences may separately influence risk-taking behavior
(Tversky and Kahneman, 1992). Although some have predominantly observed overlap in the neural correlates underlying valuation under risk
and ambiguity (Blankenstein et al., 2017; Levy et al., 2010), others have
observed distinct neural patterns between these decision contexts (Hsu
et al., 2005; Huettel et al., 2006), which may particularly arise when
including individuals’preferences for risk and ambiguity (Blankenstein
et al., 2017). When contrasting risky and ambiguous gambling, we observed that risk resulted in greater neural activation in the right ventral LPFC, bilateral precentral gyrus, and parietal cortex, whereas ambiguity resulted in greater activation in left dorsal LPFC and temporal lobe. Activation in the former set of regions may possibly serve the executive processing of explicit probabilities presented during risky trials as found
in prior studies with adults (Blankenstein et al., 2017; Huettel et al.,
2005; Huettel et al., 2006), but do not concur with adultfindings of risk
preferences in the striatum or OFC (Blankenstein et al., 2017; Engelmann
and Tamir, 2009; Hsu et al., 2005). The regions that were particularly
activated during gambling under ambiguityfit well with earlierfindings
of ambiguity coding in the LPFC in adults (Huettel et al., 2006).
We further addressed the question whether outcomes were processed differently after gambling in a risky or ambiguous context. Although VS and MPFC were generally activated in response to rewards irrespective of
Fig. 5. A.The negative effect of gambling under ambiguity on Gain>No
Gain.B.The negative effect of ARQ Rebellious behavior on Gain>No Gain.C.
The negative effect of BAS Drive on Gain>No Gain. Activation was similar for
both conditions (see graphs, right panels). P.E.¼parameter estimate.
Table 5
MNI coordinates of Local Maxima Activated for the negative effect of ambiguous gambling on Gain>No Gain. Results were FWE cluster-corrected (p<.05).
Area of activation MNI coordinates T pFWE Volume
x y z
L superior temporal gyrus, L posterior insula
54 19 13 4.74 <.001 531 L postcentral gyrus 54 13 40 4.44
R superior frontal gyrus 24 20 58 5.67 .007 102 R middle frontal gyrus 45 26 37 3.82
R middle frontal gyrus 42 35 43 3.65 R precentral gyrus, including R
supplementary motor area, R postcentral gyrus
39 19 58 4.73 <.001 505
R paracentral lobule 3 31 58 4.33 R posterior insula lobe,
including R superior temporal gyrus, R precentral gyrus, R postcentral gyrus, R inferior frontal gyrus (pars opercularis).
36 7 13 4.26 <.001 244
R rolandic operculum 45 7 19 4.25 R rolandic operculum 48 16 13 4.17
Note:L¼left; R¼right; bilat¼bilateral. Anatomical labels are based on the Automated Anatomical Labeling (AAL) atlas.
Table 6
MNI coordinates of Local Maxima Activated for the results of regressions with ARQ and BIS/BAS subscales on Ambiguity Gamble>Risk Gamble. Results were FWE cluster-corrected (p<.05).
Area of activation MNI coordinates T pFWE Volume
x y z
Positive effect of BAS Drive on Ambiguity Gamble>Risk Gamble
R inferior parietal lobe 54 52 46 4.18 .02 70 Positive effect of BAS Fun seeking on Ambiguity Gamble>Risk Gamble
R supramarginal gyrus, including R postcentral gyrus
63 28 49 3.87 .048 56
R supramarginal gyrus 51 31 40 3.58 R supramarginal gyrus 54 34 49 3.51
Note:L¼left; R¼right; bilat¼bilateral. Anatomical labels are based on the Automated Anatomical Labeling (AAL) atlas.
Table 7
MNI coordinates of Local Maxima Activated for the results of the regression with ARQ and BIS/BAS subscales on Gain>No Gain. Results were FWE cluster-corrected (p<.05).
Area of activation MNI coordinates T pFWE Volume
x y z
Negative effect of ARQ Rebellious on Gain>No Gain
R middle frontal gyrus 39 14 52 5.02 .006 112 R middle frontal gyrus 39 26 37 3.93
L precental gyrus 36 2 61 4.41 .001 148
L middle frontal gyrus 36 5 52 4.25 L middle frontal gyrus 27 14 43 3.89
R paracentral lobule 6 34 73 4.06 .025 80
R precuneus 6 46 67 3.82
R precentral gyrus 15 22 64 3.56 Negative effect of BAS Drive on Gain>No Gain
L inferior parietal lobule 57 52 40 4.45 .006 110
L angular gyrus 42 55 25 3.62
L supramarginal gyrus 60 52 28 3.56
L middle frontal gyrus 42 23 49 4.43 .022 83 L middle frontal gyrus 39 11 49 3.47
L middle frontal gyrus 33 20 43 3.46
a risky or ambiguous decision context, a more dorsal region of the MPFC was particularly activated during rewards following ambiguous, compared with risky, gambles. A similar pattern has been observed in
prior work with adults (although slightly more dorsal;Blankenstein et al.,
2017), and was interpreted as a general signal of uncertainty coding,
being particularly present in ambiguous decision contexts (based on a
search in NeuroSynth, an online meta-analysis database;Yarkoni et al.,
2011). Alternatively, the MPFC has been implicated in performance
monitoring and feedback integration following risky decisions (
McCor-mick and Telzer, 2017a; van Noordt and Segalowitz, 2012; Xue et al.,
2009), which would concur with a learning signal over time that is
greater in ambiguous compared to risky contexts. Although behavior did not change profoundly in both decision contexts, gambling increased slightly over time for ambiguous trials. Future studies may therefore further investigate the role of the MPFC in learning (e.g., behavioral adjustment) versus resolving outcome uncertainty under risky and ambiguous conditions, for instance by using a paradigm in which
out-comes influence subsequent decisions in a learning context, and using
varying levels of ambiguity.
Relations with task-related and self-reported risk-taking
Our main interest was to relate individual differences in risk-taking tendencies to brain activation during risky and ambiguous decision-making during adolescence, given that this is a time marked by a rise
in risk-taking tendencies (Steinberg, 2008). To this end we included
participants from a wide age range, in which individual differences in
risk-taking tendencies are most prominent (Bjork and Pardini, 2015;
Willoughby et al., 2013). Although participants were encouraged to gamble by presenting gambling options higher in expected value than the safe option, there was substantial variability in risky and ambiguous gambling behavior, allowing the investigation of these individual-difference measures in relation to brain activation.
First, during the choice phase, a higher frequency of gambling under risk (but not ambiguity) was associated with increased activation in the VS in the risky condition only, whereas a greater tendency to gamble under ambiguity (but not risk) was related to reduced DMPFC and insula activation in the ambiguous condition only. Generally, we replicated prior research showing that enhanced risk-taking is associated with
greater striatum activation (Galvan et al., 2007), and reduced DMPFC
and insula activation (van Duijvenvoorde et al., 2015; Van Leijenhorst
et al., 2010). However, we now show that these neural correlates differed
across task conditions. Speculatively, thesefindings may relate to the
difference in subjective evaluation of the decisions at hand, in which the tendency to engage in risky gambles may be triggered by a greater reward valuation, whereas the tendency to engage in ambiguous gambles is mainly driven by an aversion to uncertainty. Previous research has related insula and DMPFC activation in the context of risky decision-making as an affective and cognitive component (respectively)
of uncertainty processing (Mohr et al., 2010; van Duijvenvoorde et al.,
2015). That is, activation in the insula may reflect the increased
expe-rienced negative affect when encountering uncertainty (van
Duijven-voorde et al., 2015), which may be more pronounced under ambiguity than risk. Simultaneously, activation in the DMPFC may function as a cognitive warning signal to prevent risky behavior and has been related
to participants’subjective experience of uncertainty (Xue et al., 2009).
This interpretationfits well with thefinding that insula activation was
heightened for those individuals who gambled less frequently in this condition.
A new direction in this study is that we related individual differences in risk-taking tendencies not only to choice, but also to outcome pro-cessing. We observed that a greater tendency to gamble under ambiguity was associated with decreased right DLPFC activation during reward processing. In addition, greater self-reported rebellious behavior, and a greater drive for rewards, were also associated with a reduced DLPFC response when processing rewards. This contradicts prior research on
adolescent individual differences in real-life risk taking and brain acti-vation, which showed the opposite relation (a greater DLPFC response
with increased risk taking;Qu et al., 2015), but is in line with prior
research in young adults (Gianotti et al., 2009) and with studies that
relate lower impulsivity to strengthened connectivity between the
striatum and DLPFC (Achterberg et al., 2016; Dixon, 2015; van den Bos
et al., 2014). Thesefindings point towards an important role for the LPFC
in individuals’risk preferences, and concurs with the idea that lower
self-control in response to rewards may lead adolescents to engage in greater risk taking. However, it should be noted that in the current task, risk taking could be seen as advantageous (i.e., the gamble presented a higher expected value), thus leading to more monetary gains. Similarly, it may be adaptive to display certain levels of reward motivation or
rebellious behavior, particularly in this age range (Romer et al., 2017).
The adaptive nature of risk taking should be further examined,
consid-ering adolescence as a period of opportunities, and not only of risk (Crone
et al., 2016).
Limitations and future directions
A number of limitations need to be considered. First, although the current study included a wide age range across adolescence (11–24 years, an age range in which individual differences in daily life risk-taking are
prominent;Bjork and Pardini, 2015; Willoughby et al., 2013), the
ma-jority of ourfindings were independent of age, except for the results on
self-report measures. That is, ARQ and BAS subscales increased with age and/or peaked in adolescence, which is consistent with prior reports on these measures which is consistent with prior reports on these measures (Blankenstein et al., 2016; Urosevic et al., 2012) and with previous
re-ports of this sample (regarding the BAS scales, Braams et al., 2015;
Schreuders et al., in press). While in the current study we focused particularly on individual differences in an adolescent sample, it is
sur-prising that we did notfind effects of age on our neural results. Prior
studies reported heightened activation in dorsal ACC in early adolescence (Van Leijenhorst et al., 2010) and in DMPFC, anterior insula, and
sub-callosal cortex in mid-adolescence with increasing risk processing (van
Duijvenvoorde et al., 2015; Van Leijenhorst et al., 2010) and adolescent
peaks in striatum activity (Braams et al., 2015; Van Leijenhorst et al.,
2010; Silverman et al., 2015). Others reported a monotonic increase from
childhood to adulthood in MPFC during reward processing (van
Duij-venvoorde et al., 2015). Importantly, these studies included participants from late childhood/early adolescence (8–10 years), whereas our
youn-gest participants were 11–12 years old. Indeed, in a recent review it was
argued that information from childhood is needed to fully understand developmental patterns and underlying factors of risk-taking across
adolescence (Li, 2017). Furthermore, developmental effects are often not
observed when the risky option is obviously advantageous (Defoe et al.,
2015; Li, 2017), as in the current study. An opportunity for future research may therefore be to determine age effects in risk and ambiguity sensitivity, a question that may be tackled with paradigms including a
non-safe alternative (e.g.,Defoe et al., 2015) as well as including multiple
levels of risk and ambiguity (Blankenstein et al., 2016) in a broad age
range starting in late childhood and extending into adulthood. Second, behavior on the task was not correlated to any of our mea-sures on real-life risk taking. Studies using both task-related and
self-report measures of risk taking often did not find significant
correla-tions, which have been suggested to be caused by underpowered studies
(for a review, seeSherman et al., 2017). However, the current study, and
others (e.g.,Mamerow et al., 2016) with relatively large sample sizes also
did not find associations between task-related and self-reported risk
revealed preferences: task-based risk measures such as behavior on the Balloon Analogue Risk Task and the Columbia Card Task). That is, the authors discovered that a general factor of risk preference emerged from the propensity measures and frequency measures, which did not share variance with behavioral measures (revealed preferences). Possibly, in the current study, task-related risk taking (a behavioral measure) and self-reported risk taking as measured with the BIS/BAS subscales (a propensity measure), and the ARQ subscales (a frequency measure) also
reflect different behavioral manifestations of risk behavior in our
adolescent sample. Although the psychometric properties of risk prefer-ences in adolescence warrants further study, this echoes the need for and potential of including multidimensional measures of risk-taking (i.e., behavior, propensity, and real-life frequencies) in adolescence.
Third, task behavior was heavily tuned towards gambling, by pre-senting participants with gambles much higher in expected value than the safe option. To derive a more sensitive measure of individuals’
preferences for risk and ambiguity, future research may benefit from
including an additional task that presents multiple levels of risk and
ambiguity (Blankenstein et al., 2017; Engelmann and Tamir, 2009).
Fourth, participants’gambling frequency determined the number of
gain and no gain trials included in the analyses. That is, those participants who gambled more frequently experienced more reward outcomes than those participants who chose the safe option more frequently, which may have biased our results in the reward outcome phase. However, a loss of power due to fewer trials is unlikely to drive our main results, given that less gambling actually led to greater activation during choice and outcome.
Finally, indices of real-life risk taking were based on retrospective, self-report questionnaires. An opportunity for future research is to more explicitly measure day-to-day risk taking, for instance by using ecological momentary assessments, in which participants are asked to answer questions multiple times each day for an extended period of time, making
it possible to collect rich, real-time data on individuals’ risk-taking
behavior (Shiffman et al., 2008; Turner et al., 2004).
Conclusion
This study is thefirst to examine individual differences in risk-taking
tendencies in adolescence in relation to the neural mechanisms under-lying decision-making under risk and ambiguity. Using a previously established fMRI gambling paradigm, we were able to study gambling and reward processing under risk and ambiguity in a large adolescent
sample spanning a wide age range (11–24 years). We demonstrate that
risky and ambiguous gambling is reflected in different patterns of brain
activation, and that the MPFC appears key in processing reward out-comes following ambiguity. In addition, individual differences in task-related and self-reported risk-taking tendencies were associated with activation in the VS, LPFC, insula and DMPFC, regions previously asso-ciated, respectively, with reward processing, cognitive control, and cognitive-affective integration. Moreover, we found that the neural mechanisms underlying task-related risk taking were differentially recruited depending on whether the choice context was risky or ambig-uous. Finally, reward valuation in the LPFC seems key for individual differences in risk-taking tendencies in this adolescent sample. Together, this study demonstrates the importance of considering multiple measures of risk-taking tendencies, and contextual moderators, in unraveling the neural mechanisms underlying risk taking in adolescents.
Author note
The authors declare that they have no conflict of interest,financial or
otherwise. Correspondence concerning this article should be addressed to N. E. Blankenstein, Department of Developmental and Educational Psychology, Leiden University, Wassenaarseweg 52 2 333 AK Leiden, The Netherlands.
Funding
This work was supported by an innovative ideas grant of the Euro-pean Research Council (ERC-2010-StG-263234 to E.A.C.).
Appendix A. Supplementary data
Supplementary data related to this article can be found athttps://doi.
org/10.1016/j.neuroimage.2018.01.085.
References
Achterberg, M., Peper, J.S., van Duijvenvoorde, A.C., Mandl, R.C., Crone, E.A., 2016. Frontostriatal white matter integrity predicts development of delay of gratification: a longitudinal study. J. Neurosci. 36 (6), 1954–1961.
Bjork, J.M., Pardini, D.A., 2015. Who are those“risk-taking adolescents”? Individual differences in developmental neuroimaging research. Dev. Cognit. Neurosci. 11, 56–64.
Blankenstein, N.E., Crone, E.A., van den Bos, W., van Duijvenvoorde, A.C.K., 2016. Dealing with uncertainty: testing risk-and ambiguity-attitude across adolescence. Dev. Neuropsychol. 41 (1–2), 77–92.
Blankenstein, N.E., Peper, J.S., Crone, E.A., van Duijvenvoorde, A.C.K., 2017. Neural mechanisms underlying risk and ambiguity attitudes. J. Cognit. Neurosci. 29 (11), 1–15.https://doi.org/10.1162/jocn_a_01162.
Braams, B.R., Peper, J.S., van der Heide, D., Peters, S., Crone, E.A., 2016. Nucleus accumbens response to rewards and testosterone levels are related to alcohol use in adolescents and young adults. Developmental Cognitive Neuroscience 17, 83–93. Braams, B.R., van Duijvenvoorde, A.C.K., Peper, J.S., Crone, E.A., 2015. Longitudinal changes in adolescent risk-taking: a comprehensive study of neural responses to rewards, pubertal development, and risk-taking behavior. J. Neurosci. 35 (18), 7226–7238.https://doi.org/10.1523/jneurosci.4764-14.2015.
Brett, M., Anton, J., Valabregue, R., Poline, J., 2002. Region of interest analysis using an SMP toolbox. In: Paper Presented at: 8th International Conference on Functional mapping of the Human Brian.
Carver, C.S., White, T.L., 1994. Behavioral inhibition, behavioral activation, and affective responses to impending reward and punishment: the BIS/BAS scales. J. Pers. Soc. Psychol. 67 (2), 319.
Casey, B.J., Jones, R.M., Hare, T.A., 2008. The Adolescent Brain, vol. 1124. Annals of the New York Academic of Sciences, pp. 111–126.
Casey, B.J., 2015. Beyond simple models of self-control to circuit-based accounts of adolescent behavior. Annu. Rev. Psychol. 66 (1), 295–319.
Crone, E.A., Dahl, R.E., 2012. Understanding adolescence as a period of social-affective engagement and goalflexibility. Nat. Rev. Neurosci. 13 (9), 636–650.https:// doi.org/10.1038/nrn3313.
Crone, E.A., van Duijvenvoorde, A.C.K., Peper, J.S., 2016. Annual Research Review: neural contributions to risk-taking in adolescence–Developmental changes and individual differences. JCPP (J. Child Psychol. Psychiatry) 57 (3), 353–368. Dale, A.M., 1999. Optimal experimental design for event-related fMRI. Hum. Brain Mapp.
8, 109–114.
Defoe, I.N., Dubas, J.S., Figner, B., van Aken, M.A., 2015. A meta-analysis on age differences in risky decision making: adolescents versus children and adults. Psychol. Bull. 141 (1), 48–84.https://doi.org/10.1037/a0038088.
Dixon, M.L., 2015. Cognitive control, emotional value, and the lateral prefrontal cortex. Front. Psychol. 6, 758.https://doi.org/10.3389/fpsyg.2015.00758.
Engelmann, J.B., Tamir, D., 2009. Individual differences in risk preference predict neural responses duringfinancial decision-making. Brain Res. 1290, 28–51.
Frey, R., Pedroni, A., Mata, R., Rieskamp, J., Hertwig, R., 2017. Risk preference shares the psychometric structure of major psychological traits. Sci. Adv. 3 (10), e1701381 https://doi.org/10.1126/sciadv.1701381.
Galvan, A., Hare, T., Voss, H., Glover, G., Casey, B., 2007. Risk-taking and the adolescent brain: who is at risk? Dev. Sci. 10 (2), 8–14.
Gianotti, L.R.R., Knoch, D., Faber, P.L., Lehmann, D., Pascual-Marqui, R.D., Diezi, C., Fehr, E., 2009. Tonic activity level in the right prefrontal cortex predicts individuals' risk raking. Psychol. Sci. 20 (1), 33–38. https://doi.org/10.1111/j.1467-9280.2008.02260.x.
Gullone, E., Moore, S., Moss, S., Boyd, C., 2000. The Adolescent Risk-Taking Questionnaire: development and psychometric evaluation. J. Adolesc. Res. 15 (2), 231–250.https://doi.org/10.1177/0743558400152003.
Hartley, C.A., Somerville, L.H., 2015. The neuroscience of adolescent decision-making. Curr. Opin. Behav. Sci. 5, 108–115.
Hsu, M., Bhatt, M., Adolphs, R., Tranel, D., Camerer, C.F., 2005. Neural systems responding to degrees of uncertainty in human decision-making. Science 310 (5754), 1680–1683.https://doi.org/10.1126/science.1115327.
Huettel, S.A., Song, A.W., McCarthy, G., 2005. Decisions under uncertainty: probabilistic context influences activation of prefrontal and parietal cortices. J. Neurosci. 25 (13), 3304–3311.
Huettel, S.A., Stowe, C.J., Gordon, E.M., Warner, B.T., Platt, M.L., 2006. Neural signatures of economic preferences for risk and ambiguity. Neuron 49 (5), 765–775.https:// doi.org/10.1016/j.neuron.2006.01.024.
Li, R., 2017. Flexing dual-systems models: how variable cognitive control in children informs our understanding of risk-taking across development. Dev. Cognit. Neurosci. 27, 91–98.
Mamerow, L., Frey, R., Mata, R., 2016. Risk taking across the life span: a comparison of self-report and behavioral measures of risk taking. Psychol. Aging 31 (7), 711–723 doi:10.1037/pag0000124 1037/pag0000124.supp (Supplemental).
McCormick, E.M., Telzer, E.H., 2017. Failure to retreat: blunted sensitivity to negative feedback supports risky behavior in adolescents. Neuroimage 147, 381–389. Mohr, P.N., Biele, G., Heekeren, H.R., 2010. Neural processing of risk. J. Neurosci. 30
(19), 6613–6619.
Peters, S., Van Duijvenvoorde, A.C., Koolschijn, P.C.M., Crone, E.A., 2016. Longitudinal development of frontoparietal activity during feedback learning: contributions of age, performance, working memory and cortical thickness. Developmental Cognitive Neuroscience 19, 211–222.
Qu, Y., Galvan, A., Fuligni, A.J., Lieberman, M.D., Telzer, E.H., 2015. Longitudinal changes in prefrontal cortex activation underlie declines in adolescent risk taking. J. Neurosci. 35 (32), 11308–11314. https://doi.org/10.1523/jneurosci.1553-15.2015.
Romer, D., Reyna, V.F., Satterthwaite, T.D., 2017. Beyond stereotypes of adolescent risk taking: placing the adolescent brain in developmental context. Dev. Cognit. Neurosci. 27, 19–34.
Schreuders, E., Braams, B. R., Blankenstein, N. E., Peper, J. S.,&Crone, E. A. (in press). Contributions of reward sensitivity to ventral striatum activity across adolescence and early adulthood. Child Dev.
Sherman, L., Steinberg, L., Chein, J., 2017. Connecting brain responsivity and real-world risk taking: strengths and limitations of current methodological approaches. Dev. Cognit. Neurosci.https://doi.org/10.1016/j.dcn.2017.05.007.
Shiffman, S., Stone, A.A., Hufford, M.R., 2008. Ecological momentary assessment. Annu. Rev. Clin. Psychol. 4, 1–32.
Silverman, M.H., Jedd, K., Luciana, M., 2015. Neural networks involved in adolescent reward processing: an activation likelihood estimation meta-analysis of functional neuroimaging studies. Neuroimage 122, 427–439.
Smith, A.R., Steinberg, L., Chein, J., 2014. The role of the anterior insula in adolescent decision making. Dev. Neurosci. 36 (3–4), 196–209.
Steinberg, L., 2008. A social neuroscience perspective on adolescent risk-taking. Dev. Rev. 28 (1), 78–106.https://doi.org/10.1016/j.dr.2007.08.002.
Somerville, L.H., Hare, T.A., Casey, B.J., 2011. Frontostriatal maturation predicts cognitive control failure to appetitive cues in adolescents. J. Cognit. Neurosci. 23 (9), 2123–2134.
Telzer, E.H., Fuligni, A.J., Lieberman, M.D., Galvan, A., 2013. Meaningful family relationships: neurocognitive buffers of adolescent risk taking. J. Cogn. Neurosci. 25 (3), 374–387.
Turner, L., Mermelstein, R., Flay, B., 2004. Individual and contextual influences on adolescent smoking. Ann. N. Y. Acad. Sci. 1021 (1), 175–197.https://doi.org/ 10.1196/annals.1308.023.
Tversky, A., Kahneman, D., 1992. Advances in prospect theory: cumulative representation of uncertainty. J. Risk Uncertain. 5 (4), 297–323.
Tymula, A., Rosenberg Belmaker, L.A., Roy, A.K., Ruderman, L., Manson, K., Glimcher, P.W., Levy, I., 2012. Adolescents' risk-taking behavior is driven by tolerance to ambiguity. Proc. Natl. Acad. Sci. Unit. States Am. 109 (42), 17135–17140.https://doi.org/10.1073/pnas.1207144109.
Urosevic, S., Collins, P., Muetzel, R., Lim, K., Luciana, M., 2012. Longitudinal changes in behavioral approach system sensitivity and brain structures involved in reward processing during adolescence. Dev. Psychol. 48 (5), 1488.
van den Bos, W., Hertwig, R., 2017. Adolescents display distinctive tolerance to ambiguity and to uncertainty during risky decision making. Sci. Rep. 7, 40962. https://doi.org/10.1038/srep40962.http://www.nature.com/articles/ srep40962#supplementary-information.
van den Bos, W., Rodriguez, C.A., Schweitzer, J.B., McClure, S.M., 2014. Connectivity strength of dissociable striatal tracts predict individual differences in temporal discounting. J. Neurosci. 34 (31), 10298–10310.
van Duijvenvoorde, A.C.K., Huizenga, H.M., Somerville, L.H., Delgado, M.R., Powers, A., Weeda, W.D., Figner, B., 2015. Neural correlates of expected risks and returns in risky choice across development. J. Neurosci. 35 (4), 1549–1560.
Van Duijvenvoorde, A.C.K., Op de Macks, Z.A., Overgaauw, S., Gunther Moor, B., Dahl, R.E., Crone, E.A., 2014. A cross-sectional and longitudinal analysis of reward-related brain activation: effects of age, pubertal stage, and reward sensitivity. Brain Cognit. 89, 3–14.https://doi.org/10.1016/j.bandc.2013.10.005.
Van Leijenhorst, L., Gunther Moor, B., Op de Macks, Z.A., Rombouts, S.A., Westenberg, P.M., Crone, E.A., 2010. Adolescent risky decision-making: neurocognitive development of reward and control regions. Neuroimage 51 (1), 345–355.https://doi.org/10.1016/j.neuroimage.2010.02.038.
van Noordt, S.J.R., Segalowitz, S.J., 2012. Performance monitoring and the medial prefrontal cortex: a review of individual differences and context effects as a window on self-regulation. Front. Hum. Neurosci. 6, 197.https://doi.org/10.3389/ fnhum.2012.00197.
Willoughby, T., Good, M., Adachi, P.J., Hamza, C., Tavernier, R., 2013. Examining the link between adolescent brain development and risk taking from a
social–developmental perspective. Brain Cognit. 83 (3), 315–323.
Woo, C.-W., Krishnan, A., Wager, T.D., 2014. Cluster-extent based thresholding in fMRI analyses: pitfalls and recommendations. Neuroimage 91, 412–419.
Xue, G., Lu, Z., Levin, I.P., Weller, J.A., Li, X., Bechara, A., 2009. Functional dissociations of risk and reward processing in the medial prefrontal cortex. Cerebr. Cortex 19 (5), 1019–1027.