LETTER • OPEN ACCESS
Greenhouse gas emissions of hydropower in the
Mekong River Basin
To cite this article: Timo A Räsänen et al 2018 Environ. Res. Lett. 13 034030
View the article online for updates and enhancements.
Related content
Estimating greenhouse gas emissions from future Amazonian hydroelectric reservoirs
Felipe A M de Faria, Paulina Jaramillo, Henrique O Sawakuchi et al.
-A model for the data extrapolation of greenhouse gas emissions in the Brazilian hydroelectric system
Luiz Pinguelli Rosa, Marco Aurélio dos Santos, Claudio Gesteira et al.
-Enhanced greenhouse gas emission from exposed sediments along a hydroelectric reservoir during an extreme drought event
Hyojin Jin, Tae Kyung Yoon, Seung-Hoon Lee et al.
LETTER
Greenhouse gas emissions of hydropower in the Mekong
River Basin
Timo A R¨as¨anen1 , Olli Varis1 , Laura Scherer2 and Matti Kummu1,3
1 Water and Development Research Group, Aalto University, PO Box, 15200, Tietotie 1 E, 02150 Espoo, Finland 2 Institute of Environmental Sciences (CML), Leiden University, PO Box 9518, 2300 RA Leiden, Netherlands 3 Author to whom any correspondence should be addressed.
OPEN ACCESS
RECEIVED
25 July 2017
REVISED
22 December 2017
ACCEPTED FOR PUBLICATION
16 January 2018
PUBLISHED
1 March 2018
Original content from this work may be used under the terms of the Creative Commons
Attribution 3.0 licence.
Any further distribution of this work must maintain attribution to the author(s) and the title of the work, journal citation and DOI.
E-mail:timo.a.rasanen@gmail.comandmatti.kummu@aalto.fi
Keywords:hydropower, renewable energy, greenhouse gas emissions, Mekong River, Southeast Asia
Supplementary material for this article is availableonline
Abstract
The Mekong River Basin in Southeast Asia is undergoing extensive hydropower development, but the
magnitudes of related greenhouse gas emissions (GHG) are not well known. We provide the first
screening of GHG emissions of 141 existing and planned reservoirs in the basin, with a focus on
atmospheric gross emissions through the reservoir water surface. The emissions were estimated using
statistical models that are based on global emission measurements. The hydropower reservoirs (119)
were found to have an emission range of 0.2–1994 kg CO
2e MWh
−1over a 100 year lifetime with a
median of 26 kg CO
2e MWh
−1. Hydropower reservoirs facilitating irrigation (22) had generally
higher emissions reaching over 22 000 kg CO
2e MWh
−1. The emission fluxes for all reservoirs (141)
had a range of 26–1813 000 t CO
2e yr
−1over a 100 year lifetime with a median of 28 000 t CO
2e yr
−1.
Altogether, 82% of hydropower reservoirs (119) and 45% of reservoirs also facilitating irrigation (22)
have emissions comparable to other renewable energy sources (
<
190 kg CO
2e MWh
−1), while the
rest have higher emissions equalling even the emission from fossil fuel power plants
(
>
380 kg CO
2e MWh
−1). These results are tentative and they suggest that hydropower in the Mekong
Region cannot be considered categorically as low-emission energy. Instead, the GHG emissions of
hydropower should be carefully considered case-by-case together with the other impacts on the
natural and social environment.
1. Introduction
The Mekong River region in Southeast Asia is undergoing rapid social and economic development
(Grumbine et al 2012), which has led to
increas-ing demand for energy. The region is abundant in water resources and therefore hydropower is seen as an attractive energy source. Although hydropower is often considered as a climate-friendly energy option
(Kay-gusuz 2004, Edenhoferet al 2011, Dincer and Acar
2015), reservoirs are known to produce greenhouse
gases (GHG), such as methane (CH4), carbon dioxide
(CO2) and nitrous oxide (N20) (Demarty and Bastien
2011).
These emissions originate from the degradation of organic matter in the reservoir and they enter the atmosphere via diffusive flux and bubbling through
the reservoir water surface, via degassing and diffusion from the reservoir tail waters, and via the reservoir
drawdown area (Demarty and Bastien 2011, Varis
et al2012). The emissions depend on the characteristics of the natural systems that are inundated, on organic matter entering the reservoir from the catchment, and on reservoir characteristics and climate conditions. The emissions are further distinguished between gross and net emissions. Gross emissions are those that are directly measurable from existing reservoirs and net emission consider also the emissions from the reser-voir area before inundation, which can act as a GHG source (e.g. natural waters) or sink (e.g. forests).
In the Mekong, the construction of large dams (dam
height>15 m) for hydropower and irrigation started
and more than 100 are planned (MRC 2015, WLE 2015). The total hydropower capacity of all the existing and planned large dams is over 60 000 MW.
The impacts of hydropower development on var-ious aspects are increasingly well understood in the Mekong River Basin; these include impacts on
hydrol-ogy (Lauriet al2012, Cochrane et al2014, R¨as¨anen
et al 2017), ecosystems (Ziv et al 2012, Arias et al
2014), sediment (Kummu et al 2010, Kondolf et al
2014, Manh et al 2015), fisheries (Baran and
Myschowoda 2009, Stone 2016) and riparian
peo-ple (Wyatt and Baird 2007, Keskinen et al 2016).
At the same time, the hydropower’s GHG emissions have received less attention and are not systemati-cally assessed, although concerns on potentially high
emissions have been raised (Yang and Flower2012).
Globally, GHG emission measurements have been
reported since the 1990s. Barroset al(2011) collected
existing CO2and CH4 gross emission data from 85
reservoirs worldwide and found that emissions var-ied considerably between regions, being highest in the tropics. They estimate that the reservoir emissions cor-respond to 4% of the global carbon emissions from inland waters.
Hertwich (2013) estimated that the global average
emission is 85 kg CO2MWh−1and 3 kg CH
4MWh−1,
the most important predictor for emissions being reservoir area per kWh. Scherer and Pfister (2016) developed another statistical model, which they applied
to ∼1500 reservoirs, estimating the global average
emissions to be 173 kg CO2MWh−1 and 2.95 kg
CH4MWh−1. Both estimates are below the
emis-sions from fossil fuel power plants (380–1300 kg
CO2e MWh−1) (Turconi et al 2013), but there is a
high variability between reservoirs.
A review of emission measurements from tropi-cal and equatorial reservoirs by Demarty and Bastien (2011) suggests that emissions can be large in warm climates particularly in cases in which vegetation and other easily degradable matter such as peat was not cleared and thus submerged by a reservoir. They used measurements from 18 equatorial and tropical reservoirs in which emissions varied between 2 and
4100 kg CO2e MWh−1. Demarty and Bastien (2011)
further note that the emission measurements are too limited to take global position on the emissions of tropical reservoirs, given that there is a large num-ber of dams in the tropics, and that there is a need to develop unified measurement protocols (see also
Goldenfum2012).
In the case of the Mekong, the research on GHG emissions from the reservoirs is very limited. To our knowledge, there exist published GHG emission mea-surements only from three reservoirs in Lao PDR, namely Nam Ngum 1 and Nam Leuk reservoirs
(Chanudet et al 2011) and Nam Theun 2 reservoir
(Deshmukhet al2012, Deshmukhet al2013). These
three cases provide an important starting point for quantifying reservoir GHG emissions in the Mekong
Basin, but there is no basin-wide understanding of the potential emissions.
The methods for estimating the GHG emissions from reservoirs on regional scale are limited, par-ticularly in situations when GHG measurements are scarce or not available. UNESCO/IHA (2012) devel-oped a GHG risk assessment tool that provides an estimate of the vulnerability of a reservoir on GHG emissions. The tool is based on existing global reser-voir emission measurements and used, for example, by Kumar and Sharma (2016) for analysing the Tehri hydropower project in India. Another approach was
developed by de Faria et al (2015), who applied a
combination of models and existing measurements from the Amazon region to estimate emissions for planned reservoirs. More detailed modelling methods
also exist (e.g. Weissenbergeret al2010), but those are
often data intensive and not feasible for regional scale studies with limited measurements.
The quantification of GHG emissions in the Mekong has clearly major research gaps, and sci-entific information to support decision-making is lacking. Therefore, in this paper we aim to conduct the first assessment of the gross GHG emissions of the hydropower development in the basin, with focus on
gross emissions of CO2and CH4through the reservoir
water surface. Our aim can be divided further into two objectives: to estimate emissions of hydropower per energy unit, and to estimate emission fluxes from the reservoirs.
We decided to achieve our objectives by estimat-ing the GHG emissions of 141 existestimat-ing and planned hydropower reservoirs in the Mekong Basin using global statistical models from Hertwich (2013) and Scherer and Pfister (2016), considering them the most robust and well-documented methods for data scarce area with climate zones ranging from cool continental to tropics. Further, in contrast to the global assess-ments for a single year, this is the first large-scale study to assess emissions over a lifetime of 100 years.
With this we aim to provide an improved under-standing of the GHG emissions of the hydropower development in the Mekong and thus provide infor-mation for directing future research efforts and for climate-smart decision making. Since we are analysing GHG emissions of hydropower gener-ation, our analysis includes only the reservoirs that have documented to be equipped for power generation, and leave other reservoirs for further studies.
2. Materials and methods
In this study, we focus on the atmospheric gross
emis-sions of CO2 and CH4 and their combined CO2
equivalent (CO2e) through the reservoir water-air
Figure 1.Estimated greenhouse gas emissions and power densities of 141 existing and planned reservoirs in the Mekong River Basin. CDM stands for the Clean Development Mechanism of the Kyoto Protocol (UN2017) for implementing emission-reduction projects.
as well as dam construction. The results are reported
as emissions per energy unit [CO2e kg MWh−1] and
emission fluxes [t CO2e yr−1] averaged over a 100 year
lifetime. In the Discussion section, we also provide results averaged over a 10 year lifetime for the pur-pose of comparison with emission estimates presented in the literature. Below, the data and methods used for estimations are described.
2.1. Reservoirs
The reservoirs selected for our analysis were taken from the dam databases of the Mekong River Commission (MRC) and the CGIAR Research Program on Water,
Land Ecosystem (WLE) (MRC2015, WLE2015). The
MRC and WLE databases contain 154 and 394 dams and reservoirs, respectively. The WLE database con-tains a larger number of small dams compared to the MRC database. We screened both databases for large dams (height over 15 m) with sufficient data for our analysis, and ended up with a dataset of 141
reservoirs (figure 1). At least 64 of these reservoirs
are already built.
For each reservoir, we collected the following parameters from the two databases: location (deci-mal degrees), dam height (m), purpose (hydropower,
irrigation etc.), annual energy (GWh y−1), installed
capacity (MW), and reservoir surface area (km2). For
22 (out of 141) reservoirs, mainly on the Chinese side of the basin, we had to estimate the reservoir surface area using the dam location, the dam height
and a digital elevation model (DEM, see table 1)
(Jarvis and Reuter2008).
For estimating the emissions of hydropower, the purpose of the reservoirs needed to be considered. In the Mekong, reservoirs are built mainly for electric-ity generation and irrigation purposes, and therefore,
we divided the reservoirs into three groups: (i) all
reservoirs (141), (ii) hydropower reservoirs (119 of
141) and (iii) hydropower reservoirs with irrigation
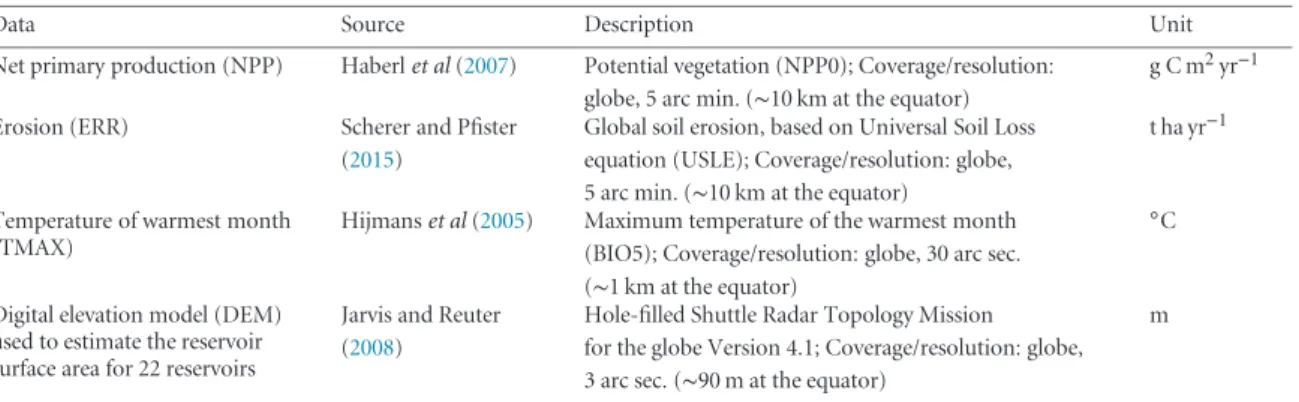
Table 1.Spatial data used in estimation of reservoir greenhouse gas emissions.
Data Source Description Unit
Net primary production (NPP) Haberlet al(2007) Potential vegetation (NPP0); Coverage/resolution: globe, 5 arc min. (∼10 km at the equator)
g C m2yr−1
Erosion (ERR) Scherer and Pfister
(2015)
Global soil erosion, based on Universal Soil Loss equation (USLE); Coverage/resolution: globe, 5 arc min. (∼10 km at the equator)
t ha yr−1
Temperature of warmest month (TMAX)
Hijmanset al(2005) Maximum temperature of the warmest month (BIO5); Coverage/resolution: globe, 30 arc sec. (∼1 km at the equator)
◦C
Digital elevation model (DEM) used to estimate the reservoir surface area for 22 reservoirs
Jarvis and Reuter (2008)
Hole-filled Shuttle Radar Topology Mission for the globe Version 4.1; Coverage/resolution: globe, 3 arc sec. (∼90 m at the equator)
m
reservoir and power plant design as well as operations, which in turn impact estimates of emissions per energy unit. For example, in irrigation reservoirs the power capacity of the power plant is often smaller than in those designed primarily for power generation, and the water available for power generation can be affected by irrigation demands. Thus, the emission estimates of the first group with 119 reservoirs are considered to reflect the emissions of hydropower in the Mekong Basin. The reservoir and hydropower data with key parameters are given in the supplement 2 available at stacks.iop.org/ERL/13/034030/mmedia.
2.2. Emission models
The GHG emissions were estimated using the models from Scherer and Pfister (2016) and Hertwich (2013).
Both are based on linear statistical models for CO2and
CH4that are fitted against emission data from about
100 reservoirs worldwide. For estimating emissions per energy unit we used the equation from Hertwich
(2013) for CO2 and the equation from Scherer and
Pfister (2016) for CH4, and for estimating emission
fluxes we used the equations from Scherer and Pfister
(2016) for both CO2and CH4. There were two reasons
for using a combination of models. First, the model
from Scherer and Pfister (2016) for CO2 emissions
per energy unit lacks an age factor and thus considers
the CO2emissions per energy unit to be constant in
time. The constant CO2emissions, however, do not
fit to the general understanding of reservoir emissions
(St Louis et al 2000, Abril et al 2005, Barros et al
2011, Demarty and Bastien 2011, Miller et al 2011,
Hertwich 2013). Second, Scherer and Pfister (2016)
compare their model to the model of Hertwich (2013) using various indicators and found that their model outperformed the model of Hertwich (2013) in the
case of CH4emissions. For further model comparison
see Scherer and Pfister (2016).
The model, we used for estimating emissions per
energy unit (EpEU model, kg MWh−1), is based on the
following equations
log10(CO2) = 0.8 + 0.97⋅log10(ATE) − 0.006⋅
AGE + 0.737⋅log10(NPP) (Hertwich 2013)
(1)
ln(CH4) = −9.81 − 0.75⋅ln(AGE) + 1.18⋅ln(ATE)
+4.50⋅ln(TMAX) (Scherer and Pf ister 2016)
(2)
where ATE [km2GWh yr−1] is the reservoir
area-to-electricity ratio, NPP [g C m2yr−1] is the net primary
production, AGE [yr] is the reservoir age, and TMAX
[◦C] is the temperature of the warmest month.
The model for estimating emission fluxes (EF
model, mg C m2d−1) is based on the following
equa-tions
CO2= 494.46 − 4.07⋅AGE + 8.09⋅ERR
(Scherer and Pf ister 2016) (3)
ln(CH4) = −12.84 − 0.03⋅AGE + 0.21⋅
ln(A) − 0.01⋅ERR + 4.88⋅ln(TMAX)
(Scherer and Pf ister 2016)
(4)
where ERR [t ha yr−1] is the annual erosion per hectare,
A [km2] is the surface area of the reservoir.
The spatial data used in the equations are listed in
table1, and the reservoir specific values derived from
spatial data are given in online supplement 2. The NPP, ERR and TMAX were estimated using 5 km buffers at the dam location, if the reservoir area was not available. The calculated emissions were further corrected as in
Scherer and Pfister (2016): the CO2 emissions were
reduced by multpying with a factor of 0.87 and the
CH4emission increased by multipying with factor of
1.4. to consider the negligence of carbon burial and methane ebullition (bubbling) in the measurements.
In this paper, we present the results as
com-bined CO2e, and as averages of EpEU and EF models.
The emission fluxes were further converted from mg
C m2d−1 to t CO
2e yr−1. For transforming CH4 to
CO2e we used a Global Warming Potential (GWP) of
34 over 100 years. As a comparison, we also calculated
power densities (W m−2) for each reservoir. Power
densities are used in the Clean Development
Mech-anism (CDM) of the Kyoto Protocol (UN2017) for
implementing emission-reduction projects in develop-ing countries that can earn saleable certified emission reduction credits. Hydropower projects with power
densities above 4 W m−2are eligible for the CDM.
0 5 10 15 20 25
<10
10-50
50-100
100-150 150-200 200-250 250-300 300-350 350-400 400-450 450-500 500-550 550-600
>600
N
u
mber of reservoirs
[-]
Emission per energy unit [kg CO2e/MWh]
0 5 10 15 20 25 30
<1
1-20
20-40 40-60 60-80
80-100
100-120 120-140 140-160 160-180 180-200
>200
N
u
mber of reservoirs
[-]
Emission flux [103 t CO 2e/yr]
(b) (a)
Existing (until 2017) Planned
Existing (until 2017) Planned
Figure 2.Estimated frequency distribution of (a) emissions per energy unit and (b) emission flux of 141 existing and future reservoirs in the Mekong Basin. Emissions are given as averages over a100 year lifetime.
22 global low-latitude (33◦N–33◦S) reservoirs with
measured emissions. In the comparison, we calcu-lated relative errors and fitted a log-normal probability distribution to those. This was then used to char-acterize the uncertainty of the emission estimates in the Mekong according to probability quantiles of 0.2 and 0.8. The global low-latitude reservoirs were con-sidered to provide a reasonable reference for model errors for the Mekong, as it is located in similar
latitudes (33◦N–8◦N). The measurement data were
collected from Scherer and Pfister (2016) and was supplemented with six reservoirs from Asia of which three are located in the Mekong Basin (Chanudet et al 2011, Deshmukh et al 2013, Wang et al
2013, Zhao et al 2013, Kumar and Sharma 2016).
The emission range of these Asian reservoirs (10–
336 kg CO2e MWh−1) is close and on both sides
of global average (187–273 kg CO2e MWh−1) and
median (84 kg CO2e MWh−1) emissions (Hertwich
2013, Scherer and Pfister 2016), which further
sup-ports the use of global emission models in the Mekong Basin. The uncertainty analysis method is presented
in detail in supplement1, while uncertainty intervals
given in results section in appropriate place and for all
reservoirs in supplement2.
3. Results
We estimated the unweighted average and median emissions per energy unit of all 141 reservoirs to be 419 and 30 (where 20–80 percentile uncertainty
intervals for emissions are 1–161) kg CO2e MWh−1,
respectively. For 119 hydropower reservoirs, the average and median emissions are 122 and 26 (1–
114) kg CO2e MWh−1, respectively, while for the
22 hydropower reservoirs with irrigation those are
2031 and 85 (8–634) kg CO2e MWh−1, respectively.
The emissions for individual reservoirs vary
con-siderably, ranging from 0.2–22 272 kg CO2e MWh−1
(figure1).
The frequency distribution of the emissions is
highly skewed (figure2(a)). Thus, a median, instead
of a mean, provides a better description for the cen-tral tendency of the emissions. The skewed emission distribution suggests that a large number of the reser-voirs have relatively low emissions per energy unit, but there are a number of reservoirs with high emis-sions, too. In the case of hydropower reservoirs, the ten highest emissions per energy unit range 322–
1994 kg CO2e MWh−1 (table2). The reservoirs with
high emissions tend to have a large reservoir surface area in relation to power capacity and are located in the
warmer parts of the basin (table2).
The emission fluxes of all reservoirs (figures1(b)
and 2(b)) indicate that the emissions vary
con-siderably, too. The average emission flux for all
reservoirs is 133 000 t CO2e yr−1with median of 28 000
(587–109 100) t CO2e yr−1. The range of the ten
high-est emission fluxes is 700 000–1 800 000 t CO2e yr−1
(100 yr) (table2b). All of these ten reservoirs have a
very large surface area.
The results further suggest that existing reser-voirs have lower emissions than the planned reserreser-voirs
(figure 2). The median emission per energy unit
for existing hydropower reservoirs (53 of 119) is
18 kg CO2e MWh−1 and for planned hydropower
reservoirs (66 of 119) 31 kg CO2e MWh−1. There is,
however, a large uncertainty in the characteristics of the planned reservoirs.
The comparison of emission estimates to power densities shows that they have a strong correlation
(r=−0.96; p-value <0.01) (figure S3). The average
and median power densities for the 119 hydropower
reservoirs are 54.3 and 10.9 W m−2, while for 22
hydropower reservoirs with irrigation those are 6.0
and 2.3 W m−2, respectively. Altogether 84 out of 119
hydropower reservoirs and 8 out of 22 hydropower reservoirs with irrigation have a higher power density
than the CDM threshold of 4 W m−2(figure1). Out of
the 77 planned reservoirs 27 are above the 4 W m−2
threshold. This threshold corresponds to emissions
per energy unit of 87 kg CO2e MWh−1.
Total reservoir emissions (figures3(a)–(b))
Table 2.Estimates of highest CO2e emissions per energy unit and largest CO2e fluxes of the reservoirs in the Mekong River Basin. Emission
estimates are given as averages over a 100 year lifetime. The 60% uncertainty interval is given in parentheses.
A. Highest CO2e emissions per energy unit (119 hydropower reservoirs, reservoirs with irrigation excluded)
Reservoir Country Commission
year
Annual energy [GWh]
Reservoir area [km2]
CO2e emission per energy unit [kg CO2e MWh−1]
Average/median of 119 reservoirs — — 1735/507 69/16 120/26 (1–114)
Xe Bang Nouan Lao PDR 2021 79 87 1990 (299–3449)
Lower Sre Pok 3 (3A) Cambodia TBD 1201 721 1400 (210–2423)
Lower Sesan 3 Cambodia TBD 1310 727 1380 (209–2394)
Xe Bang Hieng 2 Lao PDR 2022 73 46 1030 (154–1778)
Nam Ngum 1 Lao PDR 1971 1025 369 670 (100–1154)
Duc Xuyen Vietnam TBD 181 77 600 (89–1031)
Lower Sesan 2 Cambodia 2019 1954 334 370 (55–632)
Nam Feuang 1 Lao PDR 2022 113 26 360 (54–622)
Lower Sre Pok 4 Cambodia TBD 221 33 350 (53–606)
Sekong Cambodia TBD 557 94 320 (48–557)
B. Largest CO2e fluxes (all 141 reservoirs)
Reservoir Country Commission
year
Annual energy [GWh]
Reservoir area
[km2] CO2e fluxes [10 3t CO
2e y−1]
Average/median of 141 reservoirs — — 1715/485 77/22 133/28 (<1–109)
Lower Sesan 3 Cambodia TBD 1310 727 1810 (272–3136)
Lower Srepok 3 (3A) Cambodia TBD 1201 721 1680 (252–2911)
Sambor Cambodia TBD 11 740 620 1 330 (200–2307)
Stung Sen Cambodia TBD 124 434 1150 (173–1992)
Ubol Ratana Thailand 1966 56 401 1250 (187–2158)
Dachaoshan China 2003 5500 826 970 (145–1673)
Sirindhorn Thailand 1971 90 289 760 (113–1307)
Jinghong China 2009 5570 510 740 (110–1272)
Lower Sesan 2 Cambodia 2019 1954 334 710 (107–1236)
Nam Theun 2 Lao PDR 2010 6000 450 700 (105–1213)
completed in 1966 and 1971, and the second, very intensive construction phase started in the early 2000s. According to the used databases and our analysis, the growth in emissions will continue at least until the year 2023 when altogether 111 reservoirs are built, should all existing plans be implemented. There are plans for 30 more large dams for which commission years are not
known—their emissions are not included in figure3.
The 111 reservoirs, with known commission year, con-tinue to emit GHGs in the post-2023 era with a rather high rate but decreasing trend.
The median emission per energy unit for the
hydropower reservoirs varies over time (figure3(c)). In
2000–2005, when several new reservoirs were built, the
median emission was 120 (1–344) kg CO2e MWh−1,
while for 2015–2020 the median emission decreases to
41 (1–134) kg CO2e MWh−1. If no more reservoirs are
built after 2023, the median emission is estimated to
decrease to 26 (1–113) kg CO2e MWh−1by the 2050s
(see figure S4 for results for a situation where no more reservoirs are built after 2017).
4. Discussion
In this article, we provide the first GHG emis-sion estimates for hydropower in the Mekong Basin. We found that the emissions range from 0.2–
1994 kg CO2e MWh−1 over a 100 year lifetime with
a median of 26 (1–114) kg CO2e MWh−1. The
emis-sions per energy unit and emission fluxes were most strongly related to the following model predictors: area-to-electricity ratio, surface area and air
temper-ature (table S3). The power density (W m−2)—used
in CDM—also showed a strong relationship with our estimated emissions per energy unit (figure S3).
4.1. Comparison to global, low-latitude and local emission estimates
Our average and median emissions for the Mekong reservoirs have similar orders of magnitude than the estimated global emissions, the global median being
slightly higher (table3). The global low-latitude
reser-voirs (33◦N–33◦S) (table S1), in turn, have one order
of magnitude higher measured emissions than our
esti-mates for the Mekong (table 3). The high-emission
reservoirs from the Amazonian region increases the average derived from that dataset. The comparison to measured emissions from the tropical reservoirs in Brazil and French Guiana shows that the average and median emissions in the Mekong are generally lower but have a similarly high variability in emissions
(table3). In addition, when our estimates are
com-pared with measurements from low-latitude reservoirs in India (Tehri), China (Three Gorges) and Taiwan (Tsengwen) and Lao PDR (Nam Theun 2, Nam Leuk), our results are in the same order of magnitude (table
0 20 40 60 80 100 120 140 160 180
0 5,000 10,000 15,000 20,000 25,000
1960 1965 1970 1975 1980 1985 1990 1995 2000 2005 2010 2015 2020 2025 2030 2035 2040 2045 2050 2055 2060
Total energy [
T
Wh]
Total emission [
1
0
3 t CO
2
e]
(a)
0 1000 2000 3000 4000 5000 6000 7000 8000
0 100,000 200,000 300,000 400,000 500,000 600,000 700,000 800,000 900,000
1960 1965 1970 1975 1980 1985 1990 1995 2000 2005 2010 2015 2020 2025 2030 2035 2040 2045 2050 2055 2060
Cumulative total energy [
T
Wh]
(b)
If no more reservoirs are built after 2023 Average of EpEU and EF models
EpEU model EF model
60% uncertainty interval Total energy
Cumulative total emission [
1
0
3 t CO
2
e]
0 20 40 60 80 100 120
0 50 100 150 200 250 300
Median emission [
k
g CO
2
e/MWh]
(c)
1960 1965 1970 1975 1980 1985 1990 1995 2000 2005 2010 2015 2020 2025 2030 2035 2040 2045 2050 2055 2060
Number of hydropwer projects [-]
Out of range
If no more reservoirs are built after 2023 Average of EpEU and EF models
EpEU model EF model
60% uncertainty interval Total energy
If no more reservoirs are built after 2023 Average of EpEU and EF models
EpEU model EF model
60% uncertainty interval Number of hydropower projects
Figure 3.Estimated CO2e emission of reservoirs in the Mekong River Basin: (a) total annual emissions, (b) cumulative total emissions
and (c) median emission per energy unit. The estimates in tiles A and B include 111 reservoirs with known or planned commission years until the year 2023 and excludes 30 planned reservoirs with unknown commission year. The estimate in tile (c) includes 97 hydropower reservoirs of these 111 reservoirs (i.e. includes only hydropower reservoirs and excludes reservoirs also serving irrigation). The grey shading is the 20–80 percentile uncertainty interval for emissions. Note: in tile (c) the emission data is out of range from the 1970s to the early 1990s due to estimated high emissions of Nam Ngum 1, the small number of hydropower reservoirs in early years of analysis, and the use of the median as metric.
only indicative, as the global emissions were estimated for the year 2009, the low-latitude and tropical reser-voir datasets contain measurements from reserreser-voirs with different ages, whereas our results for the Mekong Basin are estimates over 100- and 10 year periods.
Comparison in the Mekong Basin shows that our estimates are higher than measured emis-sions. Nam Leuk and Nam Ngum 1 reservoirs
had measured emissions of 78 kg CO2e MWh−1 and
−30 300 t CO2e y−1 (Chanudet et al 2011),
respec-tively, whereas our estimates for the same years are
183 (28–317) kg CO2eMWh−1 and 623 800 (93 750–
1 079 174) t CO2e y−1. The large negative emissions
from 1971 commissioned Nam Ngum 1 dam are exceptional when compared to measured emission
elsewhere in low latitudes (Barroset al 2011). Nam
Theun 2 reservoir had a measured emission range
from 216–336 kg CO2e MWh−1for the two first years
of operation (Deshmukhet al2012, Deshmukhet al
2013), being close to our estimate of 381 (60–659)
kg CO2e MWh−1for the same years.
Table 3.Comparison of emission estimates from the Mekong to global, low latitude and local measurements. For the Mekong, only reservoirs with hydropower as main purpose are included.
Region Number of
reservoirs
Reservoir age/ estimate year
Source Average
[kg CO2e
MWh−1]
Median [kg CO2e
MWh−1]
Range [kg CO2e
MWh−1]
Globalb 85 2009 Hertwich (2013) 187 — —
Globalb 1473 2009 Scherer and Pfister (2016) 273 84 —
Low latitude (33◦N-33◦S)a
22 1–90 yr Scherer and Pfister (2016),
Chanudetet al2011, Deshmuket al
2013, Zhaoet al2013, Wanget al
2013, Kumar and Sharma2016
2334 334 10–20 624
Brazil and French Guianaa
12 1–36 yr Demarty and Bastien (2011) 1548 1381 2–4 100
China, Taiwan, India and Lao PDRa
5 1–38 yr Chanudetet al2011, Deshmuket al
2013, Zhaoet al2013, Wanget al
2013, Kumar and Sharma2016
90 18 10–336
Mekongb 119 Average over
100 year lifetime
This study 122 (1–114) 26 (1–114) 0.2–1994
Mekongb 119 Average over
10 year lifetime
This study 251 (2–269) 46 (2–269) 0.2–4354
aMeasurement-based estimate. bModel estimate.
0 400 900 1400 1900 2400
Coa
l
Li
g
n
it
e
Gas Oi
l
Nu
c
lear
Biom
as
s
Hyd
ro
So
la
r
Win
d
HYDROPOWER IN THE MEKONG BASIN Max.
Median Min.
Emission [kg CO
2
e/MWh]
OTHER ENERGY FORMS
Range
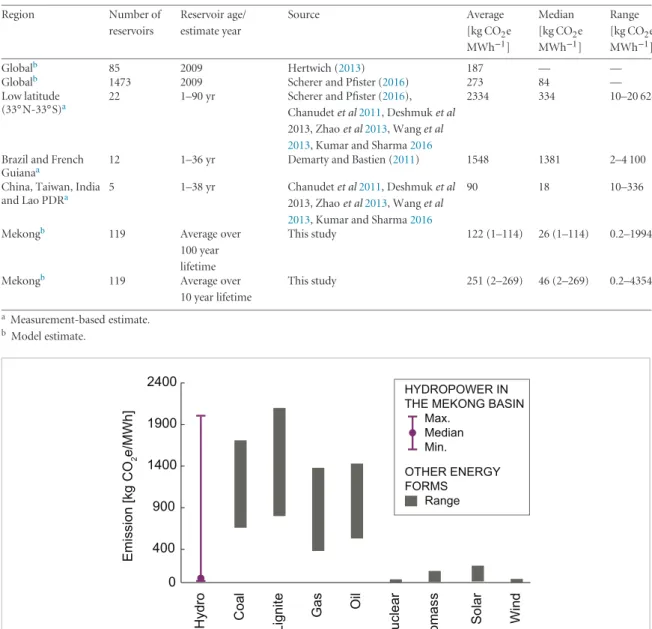
Figure 4.Estimated 100 year lifetime emissions of 119 hydropower reservoirs in the Mekong River Basin compared to life cycle emissions of other energy forms (Turconiet al2013). We added, on top of the GHG emissions reported elsewhere in the paper, construction emissions of 19 kg CO2e MWh−1(Schl¨omeret al2014) for each reservoir, while manufacturing, maintenance and
decommissioning emissions were not included.
be explained within this study as it would require more detailed measurements and modelling. The reser-voir emission measurements themselves have also uncertainties mainly due to a lack of standard measurement techniques and varying
consider-ation of emission sources (Goldenfum 2012,
Deemeret al2016). For further comparison of
mea-sured and estimated reservoir emissions according to climate zones and per surface unit area see table S4.
4.2. Comparison to other energy forms
The full comparison between Mekong hydropower GHG emissions and other energy forms would require a life cycle emission analysis, which considers the emis-sions from manufacturing, construction, maintenance and decommissioning. In addition, net emissions, and emissions from the reservoir drawdown area and tail
waters should also be considered. This is outside the scope of this paper, but for a simplified comparison we include an estimate of the construction emissions
of 19 kg CO2e MWh−1 (Schl¨omeret al2014) to our
estimates of gross reservoir emissions.
When the construction related emissions are included, the estimated median of hydropower
emissions is 49 kg CO2e MWh−1, ranging from 19–
2013 kg CO2e MWh−1 (figure 4). Altogether 97/119
hydropower reservoirs and 10/22 of hydropower reservoirs with irrigation are within the range of
other renewable energy forms (<190 kg CO2e MWh−1;
based on Turconiet al(2013)) during a 100 year
life-time. The rest of the reservoirs had higher emissions and emissions of 14 reservoir equalled the emissions
from fossil fuel power plants (>380 kg CO2e MWh−1;
Table 4.Fifteen future reservoirs with highest estimated CO2e emissions over a 100 year lifetime in the Mekong River Basin. The table also
shows power densities for each reservoir. A power density above 4 W m−2makes hydropower projects eligible for the CDM (UN2017).
Reservoir Country Purposea Commission
year
Annual energy [GWh]
Reservoir area [km2]
CO2e emission [kg CO2e
MWh−1]
Power density [W m−2]
Average/median of 141 res.
— — — 1715/485 77/22 420/30 (1–161) 46.8/8.2
Stung Sen Cambodia PCA TBD 124 434 9270
(1391–16 039) 0.1
Xe Bang Nouan Lao PDR P 2021 79 87 1990
(299–3449) 0.4
Battambang 1 Cambodia PCAF TBD 120 92 1510
(227–2616) 0.3
Lower Sre Pok 3 (3A) Cambodia PCF TBD 1201 721 1400
(227–2616) 0.4
Lower Sesan 3 Cambodia PCF TBD 1310 727 1380
(210–2423) 0.4
Xe Bang Hieng 2 Lao PDR P 2022 73 46 1030
(154–1778) 1.9
Duc Xuyen Vietnam PAF TBD 181 77 600 (89–1031) 0.7
Stung Pursat 1 Cambodia PCAF TBD 335 81 400 (59–685) 0.5
Lower Sesan 2b Cambodia PCF 2019 1954 334 370 (55–632) 1.2
Nam Feuang 1 Lao PDR P 2022 113 26 360 (54–622) 1.1
Lower Sre Pok 4 Cambodia PC TBD 221 33 350 (53–606) 1.5
Sekong Cambodia P TBD 557 94 320 (48–557) 2
Xe Pon 3 Lao PDR P 2020 164 30 310 (46–527) 1.6
Nam Ngum Lower dam Lao PDR PAR 2022 526 80 290 (43–492) 1.4
Nam Theun 4 Lao PDR P 2022 130 29 280 (42–482) 2.8
aP= power generation,C= flood control,A= Agriculture/irrigation,F= fisheries,R= recreation. bReservoir filling started during the writing of the paper.
4.3. High-emission future hydropower projects
Over half of the assessed reservoirs are under con-struction or in planning. These reservoirs have higher median emission estimates than existing ones. Our esti-mates help to identify reservoirs that are potentially high GHG emitters and would thus require special attention prior to the commission of building them. For exam-ple, 15 future reservoirs were found to have emission
range of 278–9271 kg CO2e MWh−1, while the median
for all analysed reservoirs is 30 kg CO2e MWh−1(table
4). The power densities of these 15 reservoirs are
also below the CDM threshold of 4 W m−2 (UN
2017) (table 4). Our analyses indicate that the high emissions of these reservoirs are partly explained by high surface area-to electricity ratios, their location in a warm climate zone and high erosion rates. The GHG emissions and power densities of all analysed reservoirs are given in supplement 2.
4.4. Limitations and ways forward
The reservoir emission estimates presented in this paper provide the first screening of the GHG emis-sions of the hydropower reservoirs in the Mekong. However, there are three important limitations that need to be considered when interpreting the results. First, the used methodology is based on global statis-tical models that are calibrated on reservoir emissions worldwide and not specifically for the reservoirs located in the Southeast Asian climate zones and condi-tions. However, detailed model calibration for the
Mekong, as done by de Faria et al (2015) in the
Amazon, is not currently an option due to lack
of emission measurements. Second, the applied mod-els may not be able to adequately capture the local factors that influence emissions of individual reser-voirs. This can potentially cause inaccuracies to the emission estimates. Third, our assessment focuses on gross emissions from the reservoir surface, not account-ing for net emissions or emissions from other sources such as the reservoir tail waters and drawdown areas. Our estimated gross emissions are likely to be higher than net emissions, but the inclusion of emissions from degassing would have increased our emission estimates, as it was only partially considered in our models (not all measurements underlying the
regres-sion models included CH4 bubbles). For example,
in the case of two tropical reservoirs, Balbina and
Petit Saut, the degassing of CH4 is considered to
account for 35% and 60% of the total CH4
emis-sions, respectively (Demarty and Bastien2011), and in
Nam Theun 2 reservoir the gross emissions were esti-mated to be 23%–27% larger than the net emissions
(Deshmukh et al2014, Serc¸a et al2016, Deshmukh
et al2016).
Our findings emphasize the need to further investi-gate the GHG emissions of hydropower in the Mekong, particularly in case of planned future reservoirs that were here identified to potentially have high emissions. There is a growing number of emission
measure-ments in Asia (Deemeret al2016), but there still an
accuracy of the emission estimates of existing and future reservoirs.
Finally, we did not include the emissions of other
GHGs such as N2O in our study, being also a
shortcom-ing. Inclusion of other GHGs should be in the agenda of further studies on this topic. We also recognize that hydropower reservoirs are not the only reservoirs that
emit GHGs. For example, Wanget al (2017) report
from China that largest GHG fluxes were found in urban reservoirs.
5. Conclusions
This paper provides the first assessment of the GHG emissions of hydropower reservoirs in the Mekong Basin. The basin is undergoing extensive hydropower development, yet the understanding of hydropower’s GHG emissions is limited. We estimated the emis-sions of 141 existing and planned reservoirs using statistical global emission models, with focus on gross
CO2and CH4emissions through the reservoir water
surface.
Our results show considerable variation in the estimated hydropower emissions. The hydropower was found to have an emission range of 0.2–
1994 kg CO2e MWh−1over a 100 year lifetime with a
median of 26 (1–114) kg CO2e MWh−1. Altogether,
82% of hydropower reservoirs (119) and 45% of reservoirs facilitating also irrigation (22) have emis-sions comparable to other renewable energy sources
(<190 kg CO2e MWh−1), while the rest have higher
emissions equalling even the emissions from fossil fuel
power plants (>380 kg CO2e MWh−1). Several of these
high -emission reservoirs are still in the planning phase. The results further show that the total basin-wide
emis-sions (t CO2e) of the hydropower development are
considerable.
Our findings indicate that, although the reser-voir emissions per produced energy may be low in the Mekong, hydropower cannot be considered cat-egorically as low-emission energy. The emissions can reach the emission levels from fossil fuels power plants, depending on the characteristics and location of the hydropower project. High emissions were related most strongly to low area-to-electricity ratios, large reservoir surface areas and high air temperature. Therefore, each hydropower project should be carefully analysed for its GHG emissions. It is also obvious that careful removal of vegetation and other easily degradable organic matter from the inundated area of a reservoir is fundamental in minimizing GHG emissions from it.
Our findings should be considered as tentative, given that they are based on global models with high uncertainty. To improve the estimates, more mea-surements and better models are needed. Besides geophysical, ecological and social impacts, this paper highlights the importance of considering the climate impacts of hydropower development.
Acknowledgments
Authors declare no conflicts of interest. TAR received
funding from Maa- ja vesitekniikan tuki ry., MK from
Academy of Finland funded projects WASCO (grant no. 305471) and Emil Aaltonen Foundation funded
project‘eat-less-water’and OV from Aalto University.
We are grateful for Dr. Joseph Guillaume for his sup-port in uncertainty analysis, and Prof. Jamie Pittock for his valuable comments on the paper.
ORCID iDs
Timo R¨as¨anen
http://orcid.org/0000-0003-0839-3155
Olli Varis https://orcid.org/0000-0001-9231-4549
Laura Scherer
https://orcid.org/0000-0002-0194-9942
Matti Kummu
https://orcid.org/0000-0001-5096-0163
References
Abril G, Gu´erin F, Richard S, Delmas R, Galy-Lacaux C, Gosse P, Tremblay A, Varfalvy L, Dos Santos M A and Matvienko B 2005 Carbon dioxide and methane emissions and the carbon budget of a 10 year old tropical reservoir (Petit Saut, French Guiana)Glob. Biogeochem. Cycles19GB4007
Arias M E, Cochrane T A, Kummu M, Lauri H, Koponen J, Holtgrieve G and Piman T 2014 Impacts of hydropower and climate change on drivers of ecological productivity of Southeast Asia’s most important wetlandEcol. Model.272
252–63
Baran E and Myschowoda C 2009 Dams and fisheries in the Mekong BasinAquat. Ecosyst. Health Manage.12227–34 Barros N, Cole J J, Tranvik L J, Prairie Y T, Bastviken D, Huszar V L
M, del Giorgio P and Roland F 2011 Carbon emission from hydroelectric reservoirs linked to reservoir age and latitude
Nat. Geosci.4593–6
Chanudet V, Descloux S, Harby A, Sundt H, Hansen B H, Brakstad O, Serc¸a D and Guerin F 2011 Gross CO2and CH4emissions
from the Nam Ngum and Nam Leuk sub-tropical reservoirs in Lao PDRSci. Total. Environ.4095382–91
Cochrane T A, Arias M E and Piman T 2014 Historical impact of water infrastructure on water levels of the Mekong River and the Tonle Sap systemHydrol. Earth Syst. Sci.184529–41 de Faria F, Jaramillo P, Sawakuchi H, Richey J and Barros N 2015
Estimating greenhouse gas emissions from future Amazonian hydroelectric reservoirsEnviron. Res. Lett.10124019 Deemer B R, Harrison J A, Li S, Beaulieu J J, DelSontro T, Barros N,
Bezerra-Neto J F, Powers S M, dos Santos M A and Vonk J A 2016 Greenhouse gas emissions from reservoir water surfaces: a new global synthesisBioScience66949–64
Demarty M and Bastien J 2011 GHG emissions from hydroelectric reservoirs in tropical and equatorial regions: review of 20 years of CH4emission measurementsEnergy Policy394197–206 Deshmukh Cet al2013 The net GHG (CO2, CH4and N2O)
footprint of a newly impounded subtropical hydroelectric reservoir: Nam Theun 2EGU General Assembly 2013, 7–12 April(Vienna) EGU2013-10815 p 10815
Deshmukh C, Gu´erin F, Serc¸a D, Descloux S, Chanudet V and Gu´edant P 2012 GHG budget in a young subtropical hydroelectric reservoir: Nam Theun 2 case studyEGU General Assembly 2012, held 22–27 April, 2012(Vienna) p 9796 Deshmukh Cet al2014 Physical controls on CH4 emissions from a
DeshmukhCet al2016 Low methane (CH4) emissions
downstream of a monomictic subtropical hydroelectric reservoir (Nam Theun 2, Lao PDR)Biogeosciences131919–32 Dincer I and Acar C 2015 A review on clean energy solutions for
better sustainabilityInt. J Energy Res.39585–606 Edenhofer O, Pichs-Madruga R, Sokona Y, Seyboth K, Kadner S,
Zwickel T and Matschoss P 2011 Renewable Energy Sources and Climate Change Mitigation: Special Report of the Intergovernmental Panel on Climate Change(Cambridge: Cambridge University Press)
Goldenfum J A 2012 Challenges and solutions for assessing the impact of freshwater reservoirs on natural GHG emissions
Ecohydrol. Hydrobiol.12115–22
Grumbine R E, Dore J and Xu J 2012 Mekong hydropower: drivers of change and governance challengesFront. Ecol. Environ.10
91–8
Haberl H, Erb K H, Krausmann F, Gaube V, Bondeau A, Plutzar C, Gingrich S, Lucht W and Fischer-Kowalski M 2007 Quantifying and mapping the human appropriation of net primary production in earth’s terrestrial ecosystemsProc. Natl Acad. Sci.10412942–7
Hertwich E G 2013 Addressing biogenic greenhouse gas emissions from hydropower in LCAEnviron. Sci. Technol.479604–11 Hijmans R J, Cameron S E, Parra J L, Jones P G and Jarvis A 2005
Very high resolution interpolated climate surfaces for global land areasInt. J. Climatol.251965–78
Jarvis A and Reuter H 2008 Hole-filled SRTM for the globe Version 4 CGIAR-CSI SRTM 90 m (http://srtm.csi.cgiar.org/) (Accessed: April 2010)
Kaygusuz K 2004 Hyorld’s energy futureEnergy Source26215–24 Keskinen M, Guillaume J, Kattelus M, Porkka M, R¨as¨anen T and
Varis O 2016 The water-energy-food nexus and the transboundary context: insights from large Asian riversWater
8193
Kondolf G M, Rubin Z K and Minear J T 2014 Dams on the Mekong: cumulative sediment starvationWater Resour. Res.
505158–69
Kumar A and Sharma M P 2016 Assessment of risk of GHG emissions from Tehri hydropower reservoir, IndiaHum. Ecol. Risk Assess.2271–85
Kummu M, Lu X, Wang J and Varis O 2010 Basin-wide sediment trapping efficiency of emerging reservoirs along the Mekong
Geomorphology119181–97
Lauri H, Moel H D, Ward P, R¨as¨anen T, Keskinen M and Kummu M 2012 Future changes in Mekong River hydrology: impact of climate change and reservoir operation on dischargeHydrol. Earth Syst. Sci.164603–19
Manh N V, Dung N V, Hung N N, Kummu M, Merz B and Apel H 2015 Future sediment dynamics in the Mekong Delta floodplains: impacts of hydropower development, climate change and sea level riseGlob. Planet. Change12722–33 Miller V B, Landis A E and Schaefer L A 2011 A benchmark for life
cycle air emissions and life cycle impact assessment of hydrokinetic energy extraction using life cycle assessment
Renew. Energy361040–6
MRC 2015 Hydropower database (Vientiane, Lao PDR: Mekong River Commission Secretariat)
R¨as¨anen T A, Someth P, Lauri H, Koponen J, Sarkkula J and Kummu M 2017 Observed river discharge changes due to hydropower operations in the upper Mekong BasinJ. Hydrol.
54528–41
Scherer L and Pfister S 2015 Modelling spatially explicit impacts from phosphorus emissions in agricultureInt. J. Life Cycle Assess.20785–95
Scherer L and Pfister S 2016 Hydropower’s biogenic carbon footprintPLoS ONE11e0161947
Schl¨omer S, Bruckner T, Fulton L, Hertwich E, McKinnon A and Perczyk D 2014 Annex III. Technologyspecific Cost and Performance Parameters(Cambridge: Cambridge University Press)
Serc¸a D,et al2016 Nam Theun 2 Reservoir four years after commissioning: significance of drawdown methane emissions and other pathwaysHydro´ecol. Appl.19119–46
St. Louis V L, Kelly C A, Duchemin ´E, Rudd J W M and Rosenberg D M 2000 Reservoir surfaces as sources of greenhouse gases to the atmosphere: a global estimate: reservoirs are sources of greenhouse gases to the atmosphere, and their surface areas have increased to the point where they should be included in global inventories of anthropogenic emissions of greenhouse gasesBioScience50766–75
Stone R 2016 Dam-building threatens Mekong fisheriesScience354
1084–5
Turconi R, Boldrin A and Astrup T 2013 Life cycle assessment (LCA) of electricity generation technologies: overview, comparability and limitationsRenew. Sustain. Energy Rev.28
555–65
UN 2017 Clean development mechanism (CDM)United Nations Framework Convention on Climate Change(http://cdm. unfccc.int/about/index.html) (Accessed: 4 July 2017) UNESCO/IHA 2012 GHG Risk Assessment Tool (beta
version) (www.hydropower.org/ghg/tool) (Accessed: 26 June 2017)
Varis O, Kummu M, H¨ark¨onen S and Huttunen Jet al2012
Impacts of Large Dams: a Global Assessmented C Tortajada
et al(Berlin: Springer) pp 69–94
Wang Y-H, Huang H-H, Chu C-P and Chuag Y-J 2013 A preliminary survey of greenhouse gas emission from three reservoirs in TaiwanSust. Environ. Res.23215–25 Wang X, He Y, Yuan X, Chen H, Peng C, Yue J, Zhang Q, Diao Y
and Liu S 2017 Greenhouse gases concentrations and fluxes from subtropical small reservoirs in relation with watershed urbanizationAtmos. Environ.154225–35
Weissenberger S, Lucotte M, Houel S, Soumis N, Duchemin ´E and Canuel R 2010 Modeling the carbon dynamics of the La Grande hydroelectric complex in northern QuebecEcol. Model.221610–20
WLE 2015 Mekong dam databaseWLE Greater Mekong, CGIAR Research Program on Water, Land and Ecosystems (WLE)
(Vientiane, Lao PDR)
Wyatt A B and Baird I B 2007 Transboundary impact assessment in the Sesan River Basin: the case of the Yali Falls DamWater Resour. Dev.23427–42
Yang H and Flower R J 2012 Potentially massive greenhouse-gas sources in proposed tropical damsFront. Ecol. Environ.10
234–5
Zhao Y, Wu B F and Zeng Y 2013 Spatial and temporal patterns of greenhouse gas emissions from three gorges reservoir of China
Biogeosciences101219–30
Ziv G, Baran E, Nam S, Rodriquez-Iturbe I and Levin S 2012 Trading-off fish biodiversity, food security, and hydropower in the Mekong River BasinProc. Natl Acad. Sci.109