The social genome of friends and schoolmates in
the National Longitudinal Study of Adolescent to
Adult Health
Benjamin W. Dominguea,1, Daniel W. Belskyb,c, Jason M. Fletcherd,e,f, Dalton Conleyg, Jason D. Boardmanh,i, and Kathleen Mullan Harrisj,k,1
aGraduate School of Education, Stanford University, Stanford, CA 94305;bDepartment of Population Health Sciences, School of Medicine, Duke University,
Durham, NC 27710;cSocial Science Research Institute, Duke University, Durham, NC 27710;dLa Follette School of Public Affairs, University of Wisconsin–
Madison, Madison, WI 53706;eDepartment of Sociology, University of Wisconsin–Madison, Madison, WI 53706;fCenter for Demography and Ecology,
University of Wisconsin–Madison, Madison, WI 53706;gDepartment of Sociology, Princeton University, Princeton, NJ 08544;hInstitute of Behavioral Science,
University of Colorado Boulder, Boulder, CO 80309;iSociology Department, University of Colorado Boulder, Boulder, CO 80302;jDepartment of Sociology,
University of North Carolina at Chapel Hill, Chapel Hill, NC 27599; andkCarolina Population Center, University of North Carolina at Chapel Hill, Chapel Hill,
NC 27516
Contributed by Kathleen Mullan Harris, November 20, 2017 (sent for review July 6, 2017; reviewed by Nicola Barban and Eileen M. Crimmins)
Humans tend to form social relationships with others who re-semble them. Whether this sorting of like with like arises from historical patterns of migration, meso-level social structures in modern society, or individual-level selection of similar peers remains unsettled. Recent research has evaluated the possibility that unobserved genotypes may play an important role in the creation of homophilous relationships. We extend this work by using data from 5,500 adolescents from the National Longitudinal Study of Adolescent to Adult Health (Add Health) to examine genetic similarities among pairs of friends. Although there is some evidence that friends have correlated genotypes, both at the whole-genome level as well as at trait-associated loci (via poly-genic scores), further analysis suggests that meso-level forces, such as school assignment, are a principal source of genetic similarity between friends. We also observe apparent social– genetic effects in which polygenic scores of an individual’s friends and schoolmates predict the individual’s own educational attain-ment. In contrast, an individual’s height is unassociated with the height genetics of peers.
GWAS
|
polygenic score|
social–genetic effect|
educational attainment|
BMIT
he degree to which genetics are implicated in the formation and consequences of social relationships is of growing in-terest to the new field of sociogenomics (1, 2). Analysis of spousal genotypes suggests that spouses are more genetically similar to one another compared with random pairs of individ-uals in the population (3–9). The degree of this genetic“ homog-amy” is modest. In previous analyses, we estimated that genetic homogamy was about one-third the magnitude of educational homogamy (3), even when specifically examining education-associated genotypes (8). However, even modest genetic homog-amy can have implications for statistical and medical genetic models of inheritance and social models of spousal effects (10–12). Marriage is not the only social grouping to evidence genetic selection. Adult friends are, on average, more genetically similar than random pairs from the population (13). Genetic similarity among friendship networks is important for at least two reasons. First, social networks can influence mating markets, so genetic similarity among friends may be one source of genetic similarity among spouses. Second, there may exist social–genetic effects— the effects of alter’s genotype on ego’s phenotype (1, 14, 15)— which would further suggest that social sorting on genotype may have consequences for the distribution of phenotypes in a pop-ulation beyond its effect on subsequent generations through assortative mating.Adolescence is a critical developmental period in which pat-terns of health behaviors and overall mental health established
during this phase continue through the life course (16) and may affect socioeconomic attainment (17, 18). Moreover, it is also a time of heightened salience for peer networks and influence (19– 22). For these reasons, in the present study, we characterize genetic homophily within adolescent social networks in the United States. Specifically, we analyze data from the National Longitudinal Study of Adolescent to Adult Health (Add Health) (23). Add Health surveyed 90,118 US adolescents aged 12–18 in 1994–1995 using a school-based sampling frame. As part of the survey, students were asked to list the names of their friends. Responses were collated within schools to identify social ties between individuals and their friends (24). Of the adolescents surveyed, 20,745 were enrolled in a longitudinal study that in-cluded in-home interviews with the adolescents and their parents and that followed the adolescents prospectively across four waves of interviews spanning 14 y. At the most recent interview in 2008, ∼12,000 Add Health participants provided DNA for genotyping and genome-wide single-nucleotide polymorphism (SNP) data were assayed. We linked these genetic data with social network information from the original school-based
Significance
Our study reported significant findings of a“social genome”that can be quantified and studied to understand human health and behavior. In a national sample of more than 5,000 American adolescents, we found evidence of social forces that act to make friends and schoolmates more genetically similar to one another compared with random pairs of unrelated individuals. This subtle genetic similarity was observed across the entire genome and at sets of genomic locations linked with specific traits—educational attainment and body mass index—a phenomenon we term
“social–genetic correlation.”We also find evidence of a“social– genetic effect”such that the genetics of a person’s friends and schoolmates influenced their own education, even after ac-counting for the person’s own genetics.
Author contributions: B.W.D., D.W.B., J.M.F., D.C., J.D.B., and K.M.H. designed research; B.W.D. and K.M.H. performed research; B.W.D. contributed new reagents/analytic tools; B.W.D. and K.M.H. analyzed data; and B.W.D., D.W.B., J.M.F., D.C., J.D.B., and K.M.H. wrote the paper.
Reviewers: N.B., Oxford University; and E.M.C., University of Southern California.
The authors declare no conflict of interest.
This open access article is distributed underCreative Commons Attribution-NonCommercial-NoDerivatives License 4.0 (CC BY-NC-ND).
1To whom correspondence may be addressed. Email: [email protected] or
surveys along with information about personal characteristics and social environments accumulated across Add Health follow-up waves. Analyses focus on a group of genetically homogeneous respondents identified as being of ancestral European origin (N∼5,500). Complete details on the data are inSI Appendix. Our analysis proceeds in three steps. In step 1, we test whether friends are more genetically similar to one another than to randomly selected peers. In step 2, we ask about the role of school assignment in observed genetic similarity among friends. In step 3, we evaluate a potential implication of genetic similarity among friends: social–genetic effects, or the association between the genotypes of one’s social peers and one’s own phenotype (net of own genotype).
Results
Are Friends More Genetically Similar to One Another than They Are to Randomly Selected Peers?We tested whether friends were more genetically similar to one another compared with random pairs of individuals. Using the KING algorithm (25), we computed genetic kinships between all pairs of Add Health participants. We then compared kinships among friends to kinships among random pairs of individuals to estimate the degree of genetic similarity among friends (3). To address potential confounding of analysis by ancestry, we focused on unrelated respondents of European ancestry. We also conducted analysis of genetic re-latedness of the full Add Health sample using the REAP algo-rithm (26), which is designed to estimate genetic similarity in the presence of population stratification. REAP results are reported inSI Appendix.
Estimates of genetic similarity among friends were positive (Table 1). Among non-Hispanic whites in Add Health, KING estimates of genetic homophily were about two-thirds the mag-nitude of our previous KING estimates of genetic similarity among spouses in the US Health and Retirement Study (friend similarity = 0.031, CI = 0.022–0.036, compared with spousal similarity=0.045 from ref. 3). REAP estimates of genetic sim-ilarity were somewhat smaller.
Our second analysis tested whether friends were more similar to one another on specific phenotype-related genetic dimen-sions. We considered the genetics of three phenotypes: height, body mass index (BMI) (a measure of adiposity), and educa-tional attainment. We used polygenic scores to summarize phenotype-related genetics. Polygenic scores are genome-wide summaries of genetic influence. They are computed by weighting alleles at loci across the genome according to their association with a phenotype of interest and then summing weighted allele counts across loci. We computed polygenic scores based on weights from published genome-wide association studies (GWASs) (27–29) using established methods (30). Because the original GWASs were performed on non-Hispanic whites, we restricted polygenic score analysis to this population as population stratification may dilute genetic associations (31). To correct for any residual population stratification, we adjusted polygenic score analyses for the first 10 principal components (32) computed based on the genetically homogeneous set of European-ancestry respondents. Further de-tails are reported inSI Appendix.
We first confirmed that polygenic scores were associated with their respective phenotypes (all polygenic score–phenotype cor-relations exceeded 0.25; Table 2). Educational attainment was strongly correlated between friends (r = 0.42) and less so for BMI and height (r=0.12 for BMI;r=0.09 for height). Next, for each polygenic score, we computed associations of the respon-dent’s polygenic score with the average polygenic score among their friends. Polygenic scores for BMI (r=0.08;P<0.001) and educational attainment (r = 0.09; P < 0.001) were positively correlated among friends. Polygenic scores for height were not correlated among friends (r=−0.01;P=0.63). Compared with correlations of polygenic scores among spouses (8), spousal
correlations for polygenic scores for height were much larger than that observed for friends, spousal correlations of BMI polygenic scores were smaller, and friend and spousal correlations on polygenic scores for educational attainment were comparable. Research suggests that there may be important differences among men and women with respect to the role of genes in complex social behaviors (33). To test for such differences, we repeated our analysis within same-sex social networks; that is, we tested correlations between women’s polygenic scores and scores of their female friends and between men’s polygenic scores and scores of their male friends. Results were similar to the mixed-sex analysis (Table 2). For education polygenic scores, women’s female social networks demonstrated modestly stronger social– genetic correlations compared with men’s male social networks. The opposite was observed for BMI polygenic scores.
Why Are Friends More Genetically Similar to One Another than They Are to Randomly Selected Peers?We considered two hypotheses. One hypothesis is that friends are more genetically similar to one another because they form their friendships partly on the basis of shared characteristics (e.g., being short or tall, heavy or slim, from well-educated or poorly educated families, etc.). This process is called “social homophily” (34–37). When character-istics that influence formation of social ties are heritable, which many are (38), social homophily can generate genetic similarity between friends. A second hypothesis is that friends are more genetically similar because people tend to form friendships within environments that are socially stratified (e.g., living in the same community, attending the same school). We refer to this process, which has been observed as a cause of demographic similarity among spouses (39), as social structuring (40). When genetics influence the social environments people live in—for example, through influence on socioeconomic attainment (41)— social structuring can generate genetic similarity between friends even without explicit selection on phenotypic similarity. Social homophily and social structuring are not mutually exclusive and may indeed be complementary processes.
Our analysis of polygenic score correlations among friends suggested some evidence of social homophily; individuals were modestly similar to friends in terms of their educational trajec-tories (measured as their educational attainment at wave IV, about 14 y after social network data were originally collected), and their educational attainment polygenic scores were corre-lated (Table 2).
We next tested for evidence of social structuring of genetic similarity. We estimated genetic similarity at the level of a structural social environment—the schools within which social networks of friends were defined. For this analysis, we compared genetic similarity among schoolmates to genetic similarity among random pairs of individuals in the Add Health sample. School-mates were genetically more similar to one another compared with random pairs of individuals (for European schoolmates, KING similarity=0.019, CI=0.018–0.020; Table 1).
Given this evidence of social structuring, we repeated analysis of genetic similarity between friends, this time comparing friends
Table 1. Similarity estimates based on overall estimates of genetic similarity (KING) for friends and schoolmate pairs
Social linkage Friends Schoolmates
Relatedness measure KING KING
Nindividuals 2,888 5,611
Nsocially linked dyads 4,574 262,027
Npossible dyads 4,168,562 15,738,221
Genetic similarity 0.031 0.019
95% CI 0.022–0.036 0.018–0.020
SO
CIAL
SCIENC
to random pairs of individuals drawn from the same school. Genetic similarity between friends was attenuated by about one-half when the analysis compared friends to random pairs of schoolmates (KING-estimated within-school friend similarity = 0.018, CI=0.009–0.026; Fig. 1A). In parallel, correlations among educational attainment polygenic scores between friends were attenuated when we adjusted analysis for the school mean polygenic score (Fig. 1B; underlying coefficients are reported in
SI Appendix); less attenuation was observed for estimates related to height and BMI polygenic scores.
Is the Social Genome Associated with an Individual’s Phenotype?One reason genetic similarity among friends and schoolmates may matter for health and social science research is the potential phenomenon of social–genetic effects. Social–genetic effects, also called“indirect”genetic effects, refer to the influence of one organism’s genotype on a different organism’s phenotype (14, 15). Social–genetic effects, which may take several forms (1), are accounted for in evolutionary theory (42, 43) and have been observed among animals (15, 44–47) and received some study in human siblings (14, 48, 49).
We tested social–genetic effects among unrelated individuals with direct social ties (friends) and structural social ties (school-mates). We examined two types of social–genetic effects: (i) social– genetic main effects—associations between friend or school genetics and a focal individual’s phenotype net of that focal in-dividual’s own genetics; and (ii) social epistasis—moderation of the association between a focal individual’s own genetics and phenotype by the genetics of their social environment. This analysis comes with the caveat that social ties between friends are not randomly assigned, and thus estimates of social–genetic effects cannot be strictly interpreted as causal.
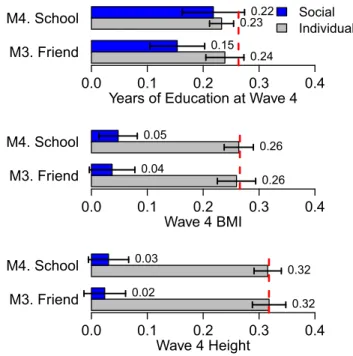
We tested social–genetic main effects among friends by ana-lyzing associations between average friend polygenic scores and a focal Add Health participant’s educational attainment, BMI, and height measured at the wave IV Add Health follow-up, 14 y after social network information was collected. Friend polygenic scores for educational attainment were associated with Add Health participants’educational attainment at the wave IV as-sessment (b = 0.18, P < 0.001). This apparent social–genetic effect was not explained by social–genetic correlations among friends; when the focal individual’s own education polygenic score was included as a covariate, the social–genetic effect was only slightly reduced and remained statistically significant (b= 0.15,P<0.001). No friend-level social–genetic main effects were observed for BMI or height (SI Appendix). Given that weight may be more sensitive to context than height (e.g., a friend’s appetite or interest in exercise may potentially influence a focal individual’s weight but presumably not their height), we also
considered an alternative adiposity measure (SI Appendix). Re-sults were similar.
We next tested social–genetic main effects at the school level after accounting for the individual’s own polygenic score. Find-ings were similar to findFind-ings for friends. Attending a school with higher average education polygenic score predicted completing more years of schooling by the time of wave IV follow-up 14 y later (after adjustment for the person’s own polygenic score,b= 0.22,P<0.001). We also observed a weak school-level social– genetic effect for BMI (SI Appendix). Analyses of social–genetic effects are summarized in Fig. 2 (underlying coefficients are reported inSI Appendix).
To test whether school-level social–genetic main effects might account for social–genetic main effects among friends, we reesti-mated friend-level social–genetic main effects using a within-school
Table 2. Correlations between various genotypes and phenotypes for individuals (as well as school ICCs) as specified in each row for the traits specified in each column
Correlation/ICC
All (n=5,626) Females (n=2,979) Males (n=2,647)
Education BMI Height Education BMI Height Education BMI Height
r(phenotype, PGS) 0.263 0.266 0.317 0.262 0.26 0.301 0.264 0.276 0.336 Phenotype School ICC 0.166 0.025 0.022 0.155 0.034 0.032 0.147 0.009 0.028
r(Phenotype, Friend Phenotype) 0.415 0.118 0.09 0.413 0.152 0.055 0.371 0.119 0.15
r(Phenotype, School Phenotype) 0.347 0.107 0.096 0.328 0.107 0.122 0.318 0.031 0.086
PGS School ICC 0.037 0.005 0.016 0.03 0.003 0.022 0.04 0.005 0.012
r(PGS, Friend PGS) 0.088 0.084 −0.009 0.123 0.077 0.026 0.097 0.108 −0.003
r(PGS, School PGS) 0.14 0.042 0.078 0.11 0.026 0.077 0.133 0.029 0.033
Correlations also shown for female and male respondents in which the focal individuals and the individuals used to construct measures of the social genome were restricted to the same sex. Note that not all respondents had a genotyped friend; correlations based on friend PGS are computed using a reduced sample. ICC, intraclass correlation coefficient.
Genome−wide
Similarity
0.031 0.018
0.00
0.01
0.02
0.03
0.04
Panel A
Genetic similarity between friends Net of schoolmates Baseline
BMI PGS
Height PGS
Edu PGS
Coefficient of friend mean PGS
0.11 −0.01
0.11
0.1 −0.04
0.06
−0.10
0.00
0.10
0.20
Panel B
M2. Net of school M1. Baseline
design. This analysis focuses comparisons between individuals within a school through inclusion of a school fixed effect. For ed-ucational attainment, friend-level social–genetic main effects remained statistically significant even when comparing an individ-ual to their schoolmates (within-school social–genetic main effect b=0.1,P<0.001). We conducted sensitivity analyses to evaluate whether findings were affected by genetic relatedness among groups of schoolmates and friends (7), by particular schools that included large numbers of respondents, by the strength of social ties between friends (mutual nominations; first- and second-degree friendship networks), or by the ethnic composition of the schools. Results were similar to those reported (SI Appendix).
Finally, we tested for social epistasis by analyzing moderation of the association between Add Health participant’s own poly-genic scores and their phenotypes by friend- and schoolmate-average polygenic scores. We found some evidence of social epistatic effects predicting educational attainment. The associa-tion between a respondent’s polygenic score and their own ed-ucational attainment was of somewhat larger magnitude when their friends and schoolmates had higher average educational attainment polygenic scores (SI Appendix).
Discussion
We analyzed genome-wide and social network data from a large nationally representative sample of American adolescents in Add Health. There were three main findings. First, we found evidence for positive genetic similarity among friends; friendship pairs tended to be more genetically similar to one another compared with random pairs of individuals. Second, friends tend to be genetically similar because of two potentially comple-mentary processes, social homophily and social structuring. So-cial homophily-related genetic similarity may arise because individuals form social bonds on the basis of characteristics they share, many of which have genetic origins. In Add Health, friends tended to share educational trajectories and also to have similar education-associated genotypes, suggesting social-homophily–
related genetic similarity. Social-structuring–related genetic sim-ilarity may arise because individuals tend to form social bonds with people whom they share the same social environments and spend their time together and these social environments may be partly influenced by their genetics. Genetic similarity at the structural level, that is, among schoolmates, accounted for about one-half of the genetic similarity among the Add Health friends. Third, genetic similarity of friends and schoolmates may bias interpretations of genetic main effects. We found evidence that genetics tended to be somewhat more similar among socially connected individuals and that the genetics of individuals in a person’s social environment influence that person’s phenotype. Together, these findings imply that naive estimates of genetic associations that ignore the social genome may be modestly biased by unmeasured social–genetic effects. In our analysis of education-associated genetics, the direction of this bias was positive. For other phenotypes and in other social settings, bias may be negative.
Implications for Genetics.Our findings regarding genetic similarity among friends echo and extend earlier work suggesting that adult friends exhibit overall genetic similarity (13); adolescents exhibit similarity on specific candidate genes (50, 51); and genetic simi-larities between adolescent friends may be partially responsible for observed similarities of friends’ grade point averages (52). Al-though power to detect genome-wide genetic similarity in our analysis may be low (7), we observed consistent evidence in analysis of polygenic scores. Potential confounding by population stratification is also an issue (7, 53). However, our results were consistent when we analyzed genetic similarity using the REAP software, which is designed to account for population stratification (26), and when we analyzed increasingly homogeneous subsamples. A unique observation from our analysis is that genetic simi-larity among persons with direct social ties (friends) partly re-flects genetic similarity among persons with structural social ties (schoolmates). This school-level similarity was also observed at the level of trait-associated genetics. About 4% of variation in the educational attainment polygenic score was between schools. Future research into social genetics in humans should be designed to account for this structural dimension, or other po-tential ways in which individuals may be clustered (54). Of course, we only measured certain aspects of social structuring. Studies that probe whether the magnitude of social structuring— perhaps as proxied by differences in institutional features [e.g., public versus private schools; school-level segregation (51)] or even geographic segregation (55)—drives the degree of genetic assortment would also be informative.
A second unique observation from our analysis is that the genetics of a person’s social network may affect that person’s risk of obesity and their educational attainment. As noted above, such social–genetic effects can bias analysis of genetic associa-tions if the social genome is not accounted for (15). It is note-worthy that our social–genetic effect results were specific to phenotypes plausibly influenced by the social environment, ed-ucation and obesity (see also refs. 56 and 57). For height, which is not likely to be influenced by social network processes (56), at least in contemporary US society, we observed no evidence of social–genetic effects. Future research may begin to bridge the social–genetic effects literature with that of peer and school ef-fects by examining whether observable characteristics of one’s social environment (e.g., the psychological makeup of one’s friends, their substance abuse behavior, personality traits, etc.) act as mechanisms through which social–genetic effects occur.
Implications for Social Science.Putative social–genetic effects also have implications for social science research. Because our analysis is able to control for the same genetics in the adolescents that are measured in their friends and schoolmates, the social–genetic M3. Friend
M4. School
Years of Education at Wave 4
0.24 0.23
0.15 0.22
0.0 0.1 0.2 0.3 0.4
Social Individual
M3. Friend M4. School
Wave 4 BMI
0.26 0.26
0.04 0.05
0.0 0.1 0.2 0.3 0.4
M3. Friend M4. School
Wave 4 Height
0.32 0.32
0.02 0.03
0.0 0.1 0.2 0.3 0.4
Fig. 2. Social–genetic effects. Effect of friend and school mean PGS net of one’s own PGS for educational attainment, BMI, and height (all measured at wave IV) on associated outcome. Outcomes are standardized as are social genotypes. The dashed red line is the baseline effect of own PGS on the outcome in a null model with no other predictors. Estimates are based on a sample of unrelated respondents. CIs are robust to school clustering.
SO
CIAL
SCIENC
effects we detect are evidence of environmental transmission of peer- and school-level influences on adolescents’ outcomes. A critical next step is to determine whether social–genetic effects detected in analysis of friends and schoolmates reflect causal effects arising from friends and schoolmates, or whether the genetics of friends and schoolmates function as proxies for other features of adolescents’environments. For example, in the case of education, friend- and school-level genetics may be associated with other features of communities that are associated with higher levels of educational attainment (58). To be more definitive, future re-search may require exogenous mechanisms underlying social contact (59, 60). Specifically, others have argued that larger so-cial environments such as schools are excellent environments for gene–environment research because school selection is largely independent of genotype (61), but our results suggest that this may not be accurate.
To the extent social–genetic effects are causal, they provide unique opportunities to investigate social network processes. Many previous attempts to identify causal social network effects (62) have been met with skepticism (56). In observational studies of friends, one of the fundamental problem is that the friendship bond is endogenous to the characteristics of the individuals in the friendship, making it challenging to disentangle the effects of friends from effects of characteristics contributing to friendship formation (63). A second, equally daunting challenge is the“ re-flection problem” (64), wherein it is difficult to distinguish the direction of effects in social interaction. Because a person’s ge-netics cannot be caused by social processes occurring within that person’s lifetime, they can help distinguish homophily (like assorting with like) from contagion in social network research. To the extent that genotype and environments are independent and randomly assigned, such social–genetic analysis can also solve the reflection problem—a strong assumption, however (65).
This study contributes to what is currently known about the role of genotypes with respect to the social ecology that exists among humans. We have provided specific evidence about ge-netic similarity within social networks and the potential for social– genetic effects. The joint existence of social network genetic similarity and social–genetic effects could produce important feedback loops. If the genetics of one’s social environment matter and relevant genetics are stratified across environments, then be-ing in certain social environments might confound straightforward analysis of genetic effects (15). More work is needed to document these features of social genetics in humans before such modulations can be unambiguously documented, but their possible existence challenges simple notions of genetic“effects.”
Methods and Materials
Data.Add Health is a nationally representative cohort drawn from a prob-ability sample of 80 US high schools and 52 US middle schools (in 80 US communities), representative of US schools in 1994–1995 with respect to region, urban setting, school size, school type, and race or ethnic back-ground (22, 23). About 15,000 respondents (or 96%) consented to geno-typing during the wave IV interview in 2008–2009 for purposes of approved Add Health wave IV research. Of those who consented to genotyping,
∼12,000 (or 80%) agreed to have their DNA archived for future testing (see
SI Appendix for a comparison of genotyped and nongenotyped respon-dents). DNA extraction and genotyping on this archived sample yielded a sample of 9,975 Add Health members with GWAS data consisting of 631,990 SNPs.SI Appendixcontains additional details on the genotyping process. This study was conducted with institutional review board approval from the University of North Carolina at Chapel Hill and Stanford University. Add Health data collection and participants’written informed consent for participation in all aspects of Add Health were carried out in accordance with the University of North Carolina School of Public Health Institutional Review Board guidelines.
In the in-school survey (which was administered to every student in the participating schools, not only the Add Health study members who are prospectively followed into adulthood), as well as in the in-home surveys at waves I and II, students were asked to nominate up to five of their male friends and five female friends. We accept a nomination in either direction
(i.e.,“undirected”friendships) as evidence of a friendship between two in-dividuals. Of those with genetic data, only 5,199 people were in a friendship pair with another genotyped respondent. We focus largely on friendship nominations within race/ethnicity. Of the 7,217 friendship pairs between genotyped respondents,∼90% were within self-reported race/ethnicity. We emphasize two additional caveats. First, related respondents (as identified by measures of genetic similarity) were not included in the analyses. Second, one school—a so called“saturated school”in the Add Health data (23)—
contributed a disproportionate number of friend pairs to the sample of non-Hispanic white respondents. Results reported are robust to the removal of this school (SI Appendix).
Measures.To measure genetic similarity, we use a kinship measures [KING (25)] that has been the focus of earlier research (3, 5). We also consider an alternative measure [REAP (26)] that is less sensitive to population stratifi-cation. We construct principal components using all genotyped respondents. We construct polygenic scores for anthropometric traits (BMI, height) and educational attainment. To construct these scores, we utilize publicly avail-able GWAS results (27–29) derived from large consortia studies (that did not include Add Health) of populations of European descent. Polygenic scores do not typically generalize across racial groups (66), so we focus these analyses on a group of genetically homogeneous European-ancestry respondents.
We use information from wave IV (when respondents were 24–32 y old) on years of education completed, BMI, and height (see additional details on all measures inSI Appendix). For analysis, we first residualized all three out-comes on sex and birth year.
Methods.
Overall genetic similarity.We first consider a measure of genetic similarity among friends used previously to study genetic similarity among spouses (3, 5). We compute the area between the 45° line and the P-P plot (given two CDFsFandG, the P-P plot is the set of points [F(x),G(x)] for allx) comparing the density of ge-netic similarity between friends with the density of gege-netic similarity for all dyads.
Targeted genetic similarity.We first consider a baseline model for some poly-genic scoreGiof the following form:
Gi=a+b·μFðGiÞ+ei, [1]
whereμF(Gi) is the mean ofGifor all an individual’s friends. The coefficientb
captures the degree to which being friends is associated with levels of overall genetic similarity. Motivated by previous studies of Add Health social networks (67, 68), we next consider the role of genetic clustering into schools in the observed degree of friend genetic similarity via the following:
Gi=a+b·μFðyiÞ+c·μSðGiÞ+ei, [2] whereμS(Gi) is the mean ofGifor all other individual’s at the school of
in-dividuali. We interpret attenuation in estimates ofbgoing from [1] to [2] as evidence for the importance of social structure, specifically school assign-ment, in observed genetic similarity among friends. We adjust all SEs for clustering of students into schools (69).
Turning to our analysis of social–genetic effects, we first consider models of the (potentially confounded) effect of the social genome on an individ-ual’s phenotype (Pi) net of the individual’s own polygenic score (PGSi). The
social genome will be characterized viaμF(Gi) andμS(Gi) as above. We first
consider the following:
Pi=a+b·PGSi+c·μFðGiÞ+e. [3] We construe this as a test of“narrow”social–genetic effects of friends. In contrast, we also consider measures of“broad”social–genetic effects:
Pi=a+b·PGSi+c·μSðGiÞ+e. [4] Again, all SEs are adjusted for clustering into schools.
Chapel Hill, and funded by NICHD Grant P01 HD31921, with cooperative fund-ing from 23 other federal agencies and foundations. D.W.B. is supported by a Jacobs Foundation Early Career Research Fellowship and by National Institute
on Aging Grants R01AG032282 and P30AG028716. D.C. is supported by a Russell Sage Foundation grant on “GxE and Health Inequality Across the Lifecourse”(83-15-29).
1. Domingue BW, Belsky DW (2017) The social genome: Current findings and implica-tions for the study of human genetics.PLoS Genet13:e1006615.
2. Conley D, Fletcher J (2017)The Genome Factor: What the Social Genomics Revolution Reveals About Ourselves, Our History, and the Future(Princeton Univ Press, Princeton). 3. Domingue BW, Fletcher J, Conley D, Boardman JD (2014) Genetic and educational
assortative mating among US adults.Proc Natl Acad Sci USA111:7996–8000. 4. Guo G, Wang L, Liu H, Randall T (2014) Genomic assortative mating in marriages in
the United States.PLoS One9:e112322.
5. Zou JY, et al. (2015) Genetic and socioeconomic study of mate choice in Latinos re-veals novel assortment patterns.Proc Natl Acad Sci USA112:13621–13626. 6. Hugh-Jones D, Verweij KJ, Pourcain BS, Abdellaoui A (2016) Assortative mating on educational
attainment leads to genetic spousal resemblance for causal alleles.Intelligence59:103–108. 7. Robinson MR, et al. (2017) Genetic evidence of assortative mating in humans.Nat
Hum Behav1:0016.
8. Conley D, et al. (2016) Assortative mating and differential fertility by phenotype and genotype across the 20th century.Proc Natl Acad Sci USA113:6647–6652. 9. Norris ET, et al. (2017) Assortative mating on ancestry-variant traits in admixed Latin
American populations. bioRxiv:10.1101/177634.
10. Trikalinos TA, Salanti G, Khoury MJ, Ioannidis JP (2006) Impact of violations and de-viations in Hardy-Weinberg equilibrium on postulated gene-disease associations.Am J Epidemiol163:300–309.
11. Peyrot WJ, Robinson MR, Penninx BWJH, Wray NR (2016) Exploring boundaries for the genetic consequences of assortative mating for psychiatric traits.JAMA Psychiatry73:1189–1195. 12. Richmond-Baker L, Belsky D (2017) Swedish register analysis of divorce and alcohol use disorder highlights social relationships as a target for preventive psychiatry and genetic research.Am J Psychiatry174:411–413.
13. Christakis NA, Fowler JH (2014) Friendship and natural selection.Proc Natl Acad Sci USA111:10796–10801.
14. Rauscher E, Conley D, Siegal ML (2015) Sibling genes as environment: Sibling dopa-mine genotypes and adolescent health support frequency dependent selection.Soc Sci Res54:209–220.
15. Baud A, et al. (2017) Genetic variation in the social environment contributes to health and disease.PLoS Genet13:e1006498.
16. Resnick MD, et al. (1997) Protecting adolescents from harm. Findings from the Na-tional Longitudinal Study on Adolescent Health.JAMA278:823–832.
17. Crosnoe R, Mistry RS, Elder GH (2002) Economic disadvantage, family dynamics, and adolescent enrollment in higher education.J Marriage Fam64:690–702.
18. Leventhal T, Brooks-Gunn J (2000) The neighborhoods they live in: The effects of neighborhood residence on child and adolescent outcomes.Psychol Bull126:309–337. 19. Mollborn S, Domingue BW, Boardman JD (2014) Understanding multiple levels of norms about teen pregnancy and their relationships to teens’sexual behaviors.Adv Life Course Res20:1–15.
20. Maxwell KA (2002) Friends: The role of peer influence across adolescent risk behav-iors.J Youth Adolesc31:267–277.
21. Prinstein MJ, Boergers J, Spirito A (2001) Adolescents’and their friends’health-risk behavior: Factors that alter or add to peer influence.J Pediatr Psychol26:287–298. 22. Harris KM (2010) An integrative approach to health.Demography47:1–22. 23. Harris KM (2013)The Add Health Study: Design and Accomplishments(Carolina
Population Center, University of North Carolina at Chapel Hill, Chapel Hill, NC). 24. Bearman P, Moody J, Stovel K (1997)The Add Health Network Variable Codebook
(University of North Carolina at Chapel Hill, Chapel Hill, NC).
25. Manichaikul A, et al. (2010) Robust relationship inference in genome-wide association studies.Bioinformatics26:2867–2873.
26. Thornton T, et al. (2012) Estimating kinship in admixed populations.Am J Hum Genet
91:122–138.
27. Wood AR, et al.; Electronic Medical Records and Genomics (eMEMERGEGE) Consor-tium; MIGen ConsorConsor-tium; PAGEGE ConsorConsor-tium; LifeLines Cohort Study (2014) De-fining the role of common variation in the genomic and biological architecture of adult human height.Nat Genet46:1173–1186.
28. Locke AE, et al.; LifeLines Cohort Study; ADIPOGen Consortium; AGEN-BMI Working Group; CARDIOGRAMplusC4D Consortium; CKDGen Consortium; GLGC; ICBP; MAGIC Investigators; MuTHER Consortium; MIGen Consortium; PAGE Consortium; ReproGen Consortium; GENIE Consortium; International Endogene Consortium (2015) Genetic studies of body mass index yield new insights for obesity biology.Nature518:197–206.
29. Okbay A, et al.; LifeLines Cohort Study (2016) Genome-wide association study iden-tifies 74 loci associated with educational attainment.Nature533:539–542. 30. Conley D, Laidley TM, Boardman JD, Domingue BW (2016) Changing polygenic penetrance
on phenotypes in the 20(th) century among adults in the US population.Sci Rep6:30348. 31. Carlson CS, et al.; PAGE Consortium (2013) Generalization and dilution of association results from European GWAS in populations of non-European ancestry: The PAGE study.PLoS Biol11:e1001661.
32. Price AL, et al. (2006) Principal components analysis corrects for stratification in genome-wide association studies.Nat Genet38:904–909.
33. Short SE, Yang YC, Jenkins TM (2013) Sex, gender, genetics, and health.Am J Public Health103:S93–S101.
34. Nordsletten AE, et al. (2016) Patterns of nonrandom mating within and across 11 major psychiatric disorders.JAMA Psychiatry73:354–361.
35. Goodreau SM, Kitts JA, Morris M (2009) Birds of a feather, or friend of a friend? Using exponential random graph models to investigate adolescent social networks.
Demography46:103–125.
36. Schwartz CR, Mare RD (2012) The proximate determinants of educational homogamy: The effects of first marriage, marital dissolution, remarriage, and educational up-grading.Demography49:629–650.
37. Youyou W, Schwartz HA, Stillwell D, Kosinski M (2017) Birds of a feather do flock together: Behavior-based personality-assessment method reveals personality simi-larity among couples and friends.Psychol Sci28:276–284.
38. Polderman TJ, et al. (2015) Meta-analysis of the heritability of human traits based on fifty years of twin studies.Nat Genet47:702–709.
39. Eastwick PW, Harden KP, Shukusky JA, Morgan TA, Joel S (2017) Consistency and inconsistency among romantic partners over time.J Pers Soc Psychol112:838–859. 40. Zeng Z, Xie Y (2008) A preference-opportunity-choice framework with applications to
intergroup friendship.AJS114:615–648.
41. Belsky DW, et al. (2016) The genetics of success: How single-nucleotide polymorphisms asso-ciated with educational attainment relate to life-course development.Psychol Sci27:957–972. 42. Moore AJ, Brodie ED, 3rd, Wolf JB (1997) Interacting phenotypes and the evolutionary process: I. Direct and indirect genetic effects of social interactions.Evolution51:1352–1362. 43. Wolf JB, Brodie Iii ED, Cheverud JM, Moore AJ, Wade MJ (1998) Evolutionary
con-sequences of indirect genetic effects.Trends Ecol Evol13:64–69.
44. Bergsma R, Kanis E, Knol EF, Bijma P (2008) The contribution of social effects to heritable variation in finishing traits of domestic pigs (Sus scrofa).Genetics178:1559–1570. 45. Benton CH, et al. (2016) Blood thicker than water: Kinship, disease prevalence and group size
drive divergent patterns of infection risk in a social mammal.Proc Biol Sci283:20160798. 46. Petfield D, Chenoweth SF, Rundle HD, Blows MW (2005) Genetic variance in female
condition predicts indirect genetic variance in male sexual display traits.Proc Natl Acad Sci USA102:6045–6050.
47. Canario L, Lundeheim N, Bijma P (2017) The early-life environment of a pig shapes the phenotypes of its social partners in adulthood.Heredity (Edinb)118:534–541. 48. Conley D, Rauscher E, Siegal ML (2013) Beyond orchids and dandelions: Testing the
5-HTT“risky”allele for evidence of phenotypic capacitance and frequency-dependent selection.Biodemogr Soc Biol59:37–56.
49. Cawley J, Han E, Kim J, Norton EC (2017) Testing for peer effects using genetic data (National Bureau of Economic Research, Cambridge, MA), Report No. 23719. Avail-able at www.nber.org/papers/w23719. Accessed September 1, 2017.
50. Fowler JH, Settle JE, Christakis NA (2011) Correlated genotypes in friendship net-works.Proc Natl Acad Sci USA108:1993–1997.
51. Boardman JD, Domingue BW, Fletcher JM (2012) How social and genetic factors predict friendship networks.Proc Natl Acad Sci USA109:17377–17381.
52. Barnes J, Beaver KM, Young JT, TenEyck M (2014) A behavior genetic analysis of the tendency for youth to associate according to GPA.Soc Network38:41–49. 53. Abdellaoui A, Verweij KJ, Zietsch BP (2014) No evidence for genetic assortative mating
beyond that due to population stratification.Proc Natl Acad Sci USA111:E4137–E4137. 54. Domingue B, Rehkopf D, Conley D, Boardman J, Geographic clustering of polygenic scores
at different stages of the life course.Russell Sage Found J Soc Sci, in press.
55. Rehkopf D, Domingue BW, Cullen M (2016) The geographic distribution of genetic risk as compared to social risk for chronic diseases in the United States.Biodemography Soc Biol
62:126–142.
56. Cohen-Cole E, Fletcher JM (2008) Is obesity contagious? Social networks vs. environ-mental factors in the obesity epidemic.J Health Econ27:1382–1387.
57. Tropf FC, et al. (2017) Hidden heritability due to heterogeneity across seven pop-ulations.Nat Hum Behav1:757–765.
58. Domingue BW, Belsky D, Conley D, Harris KM, Boardman JD (2015) Polygenic influ-ence on educational attainment: New evidinflu-ence from the National Longitudinal Study of Adolescent to Adult Health.AERA Open1:1–13.
59. Guo G, Li Y, Wang H, Cai T, Duncan GJ (2015) Peer influence, genetic propensity, and binge drinking: A natural experiment and a replication.AJS121:914–954. 60. Schmitz L, Conley D (2016) The long-term consequences of Vietnam-era conscription
and genotype on smoking behavior and health.Behav Genet46:43–58.
61. Boardman JD, Saint Onge JM, Haberstick BC, Timberlake DS, Hewitt JK (2008) Do schools moderate the genetic determinants of smoking?Behav Genet38:234–246. 62. Christakis NA, Fowler JH (2007) The spread of obesity in a large social network over
32 years.N Engl J Med357:370–379.
63. Shalizi CR, Thomas AC (2011) Homophily and contagion are generically confounded in observational social network studies.Sociol Methods Res40:211–239.
64. Manski CF (1993) Identification of endogenous social effects: The reflection problem.
Rev Econ Stud60:531–542.
65. O’Malley AJ, Elwert F, Rosenquist JN, Zaslavsky AM, Christakis NA (2014) Estimating peer effects in longitudinal dyadic data using instrumental variables.Biometrics70:506–515. 66. Martin AR, et al. (2017) Human demographic history impacts genetic risk prediction
across diverse populations.Am J Hum Genet100:635–649.
67. Daw J, Margolis R, Verdery AM (2015) Siblings, friends, course-mates, club-mates: How adolescent health behavior homophily varies by race, class, gender, and health status.Soc Sci Med125:32–39.
68. Balbo N, Barban N (2014) Does fertility behavior spread among friends?Am Sociol Rev79:412–431.
69. Zeileis A (2004) Econometric computing with HC and HAC covariance matrix estimators.J Stat Software11:1–17. SOCIAL
SCIENC