Mode Effects between Computer Self-Administration and
Telephone Interviewer-Administration of the PROMIS
®Pediatric
Measures, Self and Proxy Report
Brooke E. Magnusa, Yang Liub, Jason Hea, Hally Quinna, David Thissena, Heather E.
Grossc, Darren A. DeWaltd, and Bryce B. Reevec,e
Brooke E. Magnus: [email protected]; Yang Liu: [email protected]; Jason He: [email protected]; Hally Quinn: [email protected]; David Thissen: [email protected]; Heather E. Gross: [email protected]; Darren A. DeWalt: [email protected]; Bryce B. Reeve: [email protected]
aDepartment of Psychology, University of North Carolina at Chapel Hill, Chapel Hill, NC, United
States.
bSchool of Social Sciences, Humanities, and Arts, University of California, Merced, Merced, CA,
United States.
cCecil G. Sheps Center for Health Services Research, University of North Carolina at Chapel Hill,
Chapel Hill, NC, United States.
dDivision of General Medicine and Clinical Epidemiology, Cecil G. Sheps Center for Health
Services Research, University of North Carolina at Chapel Hill, Chapel Hill, NC, United States.
eDepartment of Health Policy and Management, Gillings School of Global Public Health,
University of North Carolina at Chapel Hill, Chapel Hill, NC, United States.
Abstract
Objective—To test equivalence of scores obtained with the PROMIS® pediatric Depressive Symptoms, Fatigue, and Mobility measures across two modes of administration: computer self-administration and telephone interviewer-self-administration. If mode effects are found, to estimate the magnitude and direction of the mode effects.
Methods—Respondents from an internet survey panel completed the child self-report and parent proxy-report versions of the PROMIS® pediatric Depressive Symptoms, Fatigue, and Mobility measures using both computer self-administration and telephone interviewer-administration in a crossed counterbalanced design. Pearson correlations and multivariate analysis of variance
Conflict of interest
Dr. Reeve was an unpaid member of the Board of Directors for the PROMIS Health Organization (PHO) during the conduct of this study and preparation of the manuscript. Dr. DeWalt is an author of some of the items in the PROMIS instruments and owns the copyright for these items. Dr. DeWalt has given an unlimited free license for the use of the materials to the PROMIS Health Organization. The remaining authors have no financial relationships or conflicts of interest relevant to this study to disclose.
Informed consent
Informed consent was obtained from all individual participants included in the study.
HHS Public Access
Author manuscript
Qual Life Res
. Author manuscript; available in PMC 2017 July 01.Published in final edited form as:
Qual Life Res. 2016 July ; 25(7): 1655–1665. doi:10.1007/s11136-015-1221-2.
A
uthor Man
uscr
ipt
A
uthor Man
uscr
ipt
A
uthor Man
uscr
ipt
A
uthor Man
uscr
(MANOVA) were used to examine the effects of mode of administration as well as order and form effects.
Results—Correlations between scores obtained with the two modes of administration were high. Scores were generally comparable across modes of administration, but there were some small significant effects involving mode of administration; significant differences in scores between the two modes ranged from 1.24 to 4.36 points.
Conclusions—Scores for these pediatric PROMIS measures are generally comparable across modes of administration. Studies planning to use multiple modes (e.g., self-administration and interviewer-administration) should exercise good study design principles to minimize possible confounding effects from mixed modes.
Introduction
The National Institutes of Health (NIH) initiated the development of the Patient-Reported Outcomes Measurement Information System® (PROMIS®) in 2004 to provide researchers access to a standardized set of self-report measures of patient-centered outcomes [1]. The PROMIS measures were designed to be administered in diverse populations (e.g., different disease and age groups) and settings (e.g., clinical trials, observational studies, health services research).
Because PROMIS instruments may be used in a variety of ways, it is important to study the effect of mode of administration (MOA). While studies try to reduce measurement error by using only one MOA (e.g., self-report via computer), several situations require use of more than one MOA. For example, a study participant may not be sufficiently literate to read the questionnaire on a computer and need someone to read the questionnaire and enter their responses for them. Excluding participants with low literacy from a study would limit generalizability of findings, and perhaps more importantly leave out participants from underserved populations. Another example includes studies that follow up with participants with missing survey data who would prefer to complete the survey immediately over the phone. For these and other occasions, it is critical for the validity of the data to know if participants would provide the same answers irrespective of the MOA.
A previous study in adults found that computer, personal digital assistants (PDA), paper-pencil, and interactive voice response administration of PROMIS measures yielded the same results (no effect of MOA) [2; 3]. However, MOA effects have not previously been examined for the PROMIS pediatric self-report measures or for parent proxy-report.
Further, there has not been a study to determine the effect of interviewer-administration versus self-administration for the PROMIS measures. Among pediatric and adult patients, interviewer administration, particularly over the phone, is a common MOA for collecting patient-centered outcomes. Some studies have found important MOA effects with interviewer administration, particularly in areas of emotional health [4–8]. This study compares computer self-administration with telephone interviewer-administration of the PROMIS pediatric self-report and the proxy-report measures. All study participants completed the self-administration mode on the computer, and participants who were also
A
uthor Man
uscr
ipt
A
uthor Man
uscr
ipt
A
uthor Man
uscr
ipt
A
uthor Man
uscr
assigned to complete the interviewer-administration arm completed this mode by telephone. While the majority of participants completed the computer administration on personal laptop or desktop computers, participants were also allowed to use tablets or smartphones for this portion of the study.
This study is designed to examine, using parallel forms of items, if differences in self- and interviewer-administrated modes of data capture are related to score differences, as well as whether these differences are consistent across PROMIS pediatric health domains. The study has two main purposes:
1. To test equivalence across two modes of administration: computer
self-administration and telephone interviewer-self-administration. We hypothesize that there are no mode effects.
2. If mode effects are found, to estimate the magnitude and direction of the mode effects.
Method
Research Participants
Data were collected from a sample recruited by Op4G, a survey research company that partners with non-profit organizations to permit panelists to earn money for charities by completing surveys. Op4G identified members with children between the ages of 8 and 17 years from their database and e-mailed survey invitations that included a short description of the study. Each parent-child pair earned $40 for participating, of which they could donate 25–100% to the non-profit agency of their choice. Data were collected between November 2014 and January 2015.
Data acquisition parameters were preset to ensure that the sample was 50% female, and with race and ethnicity distributions that reflected the 2010 US Census. In addition, parents were asked to report on whether their child had any of the following health conditions: high blood pressure (hypertension); hyperactivity or attention deficit disorder (ADHD or ADD); a mental health condition (such as depression, anxiety, bipolar disorder, other); kidney disease; chronic pain (such as pain from fibromyalgia, arthritis, etc.); asthma; thyroid disease; obesity; rheumatic disease (juvenile rheumatoid/idiopathic arthritis, lupus,
fibromyalgia, dermatomyositis); legally blind; deaf or hard of hearing; required assistance to get around (such as a wheelchair, walker, cane); cancer; diabetes; cerebral palsy; sickle cell disease; inflammatory bowel syndrome, Crohn’s disease, or other intestinal disorders; congenital heart disease; and epilepsy or other seizure disorders. The sampling plan required that 50% of the parents in the sample endorsed at least one of these conditions in the youth. This was done to ensure that youth participants with a range of health care needs were enrolled in the sample, and as a result there would be a range of scores on the PROMIS measures. Other eligibility criteria included: age of children/adolescents between 8 and 17 years, stated preference for taking the survey in English, internet accessibility, and ability to see and use a computer or tablet. Participants were excluded if they had participated in another PROMIS survey administered by Op4G in the past 12 months.
A
uthor Man
uscr
ipt
A
uthor Man
uscr
ipt
A
uthor Man
uscr
ipt
A
uthor Man
uscr
Consent and assent forms were placed at the front of the survey to provide full disclosure of the study. Informed consent was obtained for parents, and assent was obtained for children and adolescents. IRB approval was obtained at the University of North Carolina at Chapel Hill, the coordinating institution collaborating with Op4G.
Study Design
Within one assessment, each parent-child dyad completed two parallel PROMIS measures, Form A and Form B, comprising distinct sets of items from three PROMIS pediatric domains: Depressive Symptoms, Fatigue, and Mobility. These domains represent patient-centered outcomes commonly assessed in research studies. Each dyad was randomly assigned to one of six study conditions (see Table 1). In the first arm participants completed both PROMIS forms on the personal computer (PC); the dyads assigned to the first
condition completed Form A first and Form B second, while the dyads assigned to the second condition completed Form B first and Form A second. These two conditions held constant the mode of administration and allowed us to examine whether there was an order effect when both forms were computer self-administered, or a difference between the forms. In the second arm, there were four conditions that all involved completing one PROMIS form on the computer and one PROMIS form on the telephone (randomizing order of mode and form); these conditions were designed to estimate potential MOA effects.
Construction of Parallel Forms
Because the goal of this study was to examine potential effects of MOA, we constructed two forms (A & B) for each domain that were as equivalent as possible, so that the form would not confound the MOA. We began construction of the parallel forms using items from version 1 of the published PROMIS Pediatric Depressive Symptoms, Fatigue, and Mobility Short Forms [9–12], but to include a sufficient number of items on each form, we included other items from the full banks. The full item banks include 14 Depressive Symptoms items, 23 Fatigue items, and 23 Mobility items. We used item parameters from the original calibration of these scales in constructing parallel forms.
Our goal was to select items for each of the parallel forms to provide as much information as possible, while maintaining psychometric comparability between the two sets of items such that a person’s score on one form (e.g., A) would not meaningfully differ from that same person’s score on the other form (e.g., B). We used three criteria to assess psychometric comparability: The first was to minimize the discrepancy between the test characteristic curves of the two forms; this means that the relationship between the expected summed score and the underlying latent variable is similar for the two forms. Discrepancy was quantified as the squared difference in the expected summed scores between the two forms, weighted by the assumed-normal population density of the latent variable. Figure 1 shows the test characteristic curves for each form and domain. The overlapping dashed and solid curves indicate a close match between the two forms in the expected summed score for each level of the latent variable.
A second criterion was to assign items to forms that maximized the area under the test information curves so that each parallel form provided as much information as possible
A
uthor Man
uscr
ipt
A
uthor Man
uscr
ipt
A
uthor Man
uscr
ipt
A
uthor Man
uscr
across all levels of the latent variable. The third criterion was to choose items such that the test information curves were relatively “flat”, so that both forms were relatively equally informative across a wide range of levels of the latent variable.
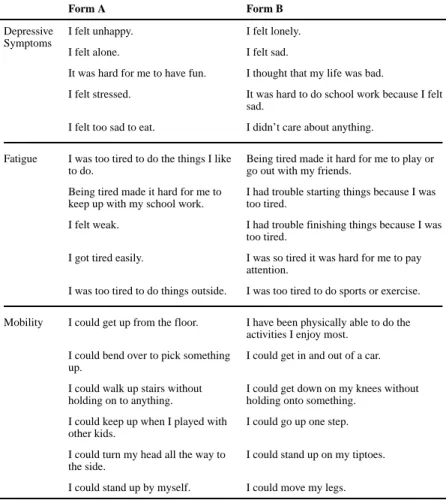
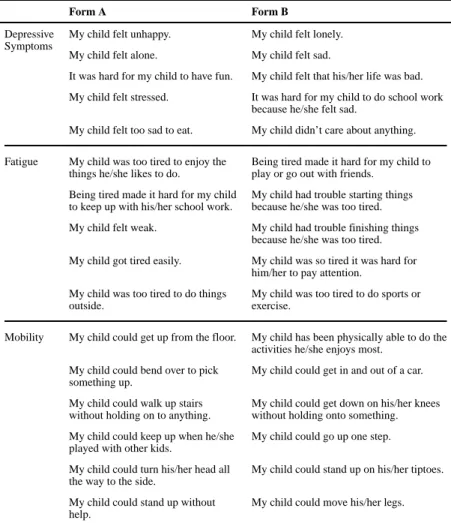
To automate the item selection and form assignment process from the pool of candidate PROMIS items, we created an algorithm that enumerated all possible combinations of items for a pair of forms, starting with divisions of the items on the short forms; we computed the three statistics corresponding to our criteria for comparability, and selected 5–6 items for each parallel form. We inspected each form to avoid the use of nearly redundant items and repeated the procedure with additional constraints as necessary. For example, we constrained the selection to avoid including “My child felt alone” and “My child felt lonely” on the same Depressive Symptoms proxy-form. This procedure was carried out for all three domains, resulting in parallel forms with five items for Depressive Symptoms, five items for Fatigue, and six items for Mobility. The forms for the child self-report items were developed first, and then used for the parent-proxy items as well, after we determined that the parent-proxy forms thus-assembled were also parallel. The items comprising each form can be found in Tables 2 and 3.
Statistical Methods
For each participant, we computed IRT scores on the PROMIS T-score metric (M = 50, SD = 10) using the parameters from the original calibrations of the scales; scoring was done with IRTPRO [13]. Higher scores indicate more of the symptom being measured, which signifies worse functioning for depressive symptoms and fatigue, and better functioning for mobility. Before any inferential analyses, we constructed boxplots of the scores for each form, and scatterplots of the Form A and Form B scores, to examine the overall response distributions and identify potential outliers. We excluded 25 parents and 23 children whose responses appeared mischievous or non-thoughtful [14]. Examples included individuals who provided response patterns such as “1, 2, 3, 4, 5” across all domains and forms, or answered “1, 1, 1, 1, 1” for one domain (e.g., fatigue) for one Form (e.g., A) and answered “5, 5, 5, 5, 5” on the same domain (e.g., fatigue) for the other Form (e.g., B). Three outlier detection methods were used with discussions among study team members to determine if the participant should be excluded from analyses; details of the methods are provided in Appendix A.
We calculated the test-retest reliability as the correlation between pre-test and post-test scores within each study condition and domain, separately for the parent and child data after we had excluded mischievous responders. Note that throughout this report, we use the terms pre-test and post-test to refer to the first and second PROMIS forms the participant
completed, respectively.
To examine the effects of MOA and form, we used repeated measures multivariate analyses of variance (MANOVA) [15], considering all three domains simultaneously to reduce the multiplicity of statistical tests. We followed up MANOVAs with domain-specific univariate ANOVAs to identify the sources of significant effects. We used an alpha level of p = 0.01 for all significance tests.
A
uthor Man
uscr
ipt
A
uthor Man
uscr
ipt
A
uthor Man
uscr
ipt
A
uthor Man
uscr
The first block of analyses examined the comparability of scores from the two forms when both were administered under the same conditions. For the two conditions that involved only computer administration, repeated measures MANOVA was used to investigate pre-test to post-test change. We were interested in a) whether there was a difference between pre- and post-test scores, and b) whether this potential difference depended on which form was administered first. Similar analyses were performed for the child self-report and parent proxy-report data.
The second block of analyses assessed the main effects and interactions of form (A vs. B) and mode (computer vs. telephone) on scores as repeated measures. These conditions counterbalanced the forms and the modes of administration in a 2 × 2 design. For these analyses, the repeated measures factor was analyzed as the difference between scores obtained with computer administration and those obtained with telephone interviews. Again, parallel analyses were performed for the child self-report and parent proxy-report data. Results of a previous MOA study with adult PROMIS forms suggest that score differences falling below a threshold of ±2 points on the T-score scale may be considered “ignorable” [2; 3]; we used this threshold in interpreting the practical significance of the magnitude of pre- to post-test change.
Results
Op4G emailed 9100 invitations to its members. There were 455 parent-child dyads who initiated the study and signed the consent and assent forms. Of these, 400 pairs completed the study. Subsequent analyses, including the demographic characteristics summarized in Table 4, are based on the 375 parents and 377 children who did not exhibit mischievous response behavior as described in Appendix A.
Test-Retest Reliability
For the child self-report sample, test-retest reliability estimates ranged from 0.83 to 0.93 for Depressive Symptoms, 0.86 to 0.94 for Fatigue, and 0.71 to 0.94 for Mobility (Table 5). For the parent proxy sample, test-retest reliabilities ranged from 0.80 to 0.91 for Depressive Symptoms, 0.82 to 0.90 for Fatigue, and 0.77 to 0.96 for Mobility (Table 6).
Pre- and Post-Test Differences for same Mode of Administration (Computer)
For the child sample, the multivariate test of differences between pre-test (i.e., first completed PROMIS form) and post-test scores (i.e., second completed form) within the same MOA (computer self-administered) was non-significant; further, there was no effect of form order. The upper block of Table 5 contains the average scores from each test
administration.
In the multivariate analysis of parent proxy sample, there was a significant overall difference in pre-test and post-test scores across the three domains, F(1, 185) = 14.14, p < .001. Depressive Symptoms post-test scores were lower than pre-test score by an average of 1.52 points (SD = 5.20), F(1, 185) = 15.99, p < .001; Fatigue post-test scores were lower by an average of 1.93 points (SD = 5.16), F(1, 185) = 26.06, p < .001. Mobility scores did not significantly differ between pre- and post-test administrations. While there was an overall
A
uthor Man
uscr
ipt
A
uthor Man
uscr
ipt
A
uthor Man
uscr
ipt
A
uthor Man
uscr
decline in scores between test administrations, form order had no effect on this decline; the change between pre-test and post-test scores was the same whether Form A or Form B was administered first. The upper block of Table 6 shows the average scores for the pre- and post-test administrations.
Mode of Administration Effects: Child Data
There was a significant interaction between MOA and form in the multivariate analysis of overall score level of both the computer and telephone administrations (F(1, 182) = 6.04, p = .001). At the univariate level, this effect appeared only for Fatigue scores: When Form A was on the computer and Form B was on the telephone, the average level of Fatigue scores (M = 44.63, SD = 10.58) was lower than the average level of Fatigue scores when Form A was over the telephone and Form B was on the computer (M = 48.80, SD = 9.76), F(1, 182) = 7.87, p = .006.
A significant interaction between MOA and form also appeared for the contrast between the computer and telephone administrations, F(1, 182) = 5.74, p = .001. This effect was
marginally significant in the univariate analyses for all three domains, with p-values ranging from 0.02 to 0.05. For Depressive Symptoms, when Form A was on the computer and Form B was on the telephone, the scores from the computer administration were 0.55 points higher than the scores obtained on the phone. When administration was reversed, and Form A was on the telephone and Form B was on the computer, the scores from the computer administration were 1.33 points lower than scores obtained on the phone (F(1, 182) = 5.43, p = .021). For Fatigue, when Form A was on the computer and Form B was on the telephone, the scores from the computer administration were 1.44 points lower than the scores obtained on the phone. For Form A on the telephone and Form B on the computer, the scores from the computer administration were a negligible 0.10 points higher than scores obtained on the phone (F(1, 182) = 5.678, p = .018). For Mobility, when Form A was on the computer and Form B was on the telephone, the scores from the computer administration were 0.50 point higher than the scores obtained on the phone. When administration was reversed, and Form A was on the telephone and Form B was on the computer, the scores from the computer administration were 0.74 points lower than scores obtained on the phone (F(1, 182) = 4.037, p = .046). While several of these tests were statistically significant, the corresponding score differences did not exceed ±2 points. The average scores for each form-administration combination can be found in the lower block of Table 5.
Mode of Administration Effects: Parent Proxy Data
For the multivariate analysis of parent proxy data, there were no significant overall
differences in the average score between computer and telephone administrations. However, analysis of score differences between the two modes of administration revealed a significant effect of mode order, F(1, 184) = 11.51, p < .001. Follow-up univariate analyses suggested that this effect was driven by Fatigue. When the first form was on the computer and the second form was on the telephone, the Fatigue scores from the computer administration were 4.36 T-score units higher than when the first form was on the telephone and the second form was on the computer (F(1, 184) = 31.74, p < .001). The univariate analyses for
Depressive Symptoms and Mobility revealed no significant effects of form or MOA. The
A
uthor Man
uscr
ipt
A
uthor Man
uscr
ipt
A
uthor Man
uscr
ipt
A
uthor Man
uscr
average scores for each form-administration combination can be found in the lower block of Table 6.
Discussion
This study examined the effects of mode of administration (MOA) and test form on scores for three of the PROMIS pediatric domains: Depressive Symptoms, Fatigue, and Mobility, for both child self-report and parent proxy-report data. We observed differences between pre- and post-test scores when both forms were administered on the computer. Because there was a period of only minutes between test administrations, it is unlikely that this decline is a result of actual change in health status. It may have been an example of response shift, a phenomenon in which respondents subtly and internally change their standards of health evaluation from one administration to the next [16]. However, this study did not repeat the same identical items in the pre- and post-tests, so conventional analyses of the response shift phenomenon cannot be applied to these data. This topic remains one for future research with these questionnaires.
MOA occasionally had a significant effect on scores for both the parent proxy and child data. Specifically, parent proxy Fatigue scores exhibited an interaction between MOA and order: Scores from the computer administration were slightly higher than scores from the telephone administration, but only when the computer form was administered first. We also observed a higher-order interaction in the parent proxy Fatigue data, with the lowest scores associated with Form B being administered first and on the computer.
For the child self-report data, there was an interaction between MOA and form that affects the overall score level for Fatigue: When Form A was administered on the computer, Fatigue scores were several points lower than when Form B was administered on the computer. We also found an interaction between MOA and form difference between scores from the two modes: When Form B was administered over the telephone, followed by Form A on the computer, the difference in Fatigue and Mobility scores between the two modes of administration was larger than for any of the other form-mode combinations. We had no clear reason to expect these effects and view them as somewhat inexplicable. These results are reminiscent of parallel results obtained in the extensive educational literature on comparability between computerized and paper and pencil administration; Thissen and Norton [17] summarized a large literature review on this topic, indicating that for the most part comparability can be maintained across modes of administration, but there have been occasional findings of mode effects.
There are at least four sources that may have caused differences in scores between the pre-and post-test scores. The first is that the person’s health status (depression, fatigue, mobility) may have changed; however, as noted earlier, this is not likely as only a few minutes
separated one assessment from the other. Second is that the two forms (A & B) may have not been equivalent resulting in score differences, despite the high test-retest reliability estimates per domain. The third source may be the difference between completing a survey via computer versus the phone. Computer assessments require reading and are often less time consuming than phone-based surveys that require listening to the complete question and all
A
uthor Man
uscr
ipt
A
uthor Man
uscr
ipt
A
uthor Man
uscr
ipt
A
uthor Man
uscr
response options. The fourth source is the difference between self-reporting one’s
depression, fatigue, or mobility status versus reporting one’s health status over the phone to an interviewer. There may be a social desirability effect, for example, that may influence how a patient reports their health to another person. These third and fourth sources for influencing score differences across modes are unable to be disentangled in this study. Future studies should consider removing the interviewer and using an interactive voice response (IVR) system to record the participants’ answers over the phone.
Another limitation of this study was the low variability in Mobility scores: Nearly 70% of both the parent proxy and child self-report samples attained the maximum Mobility score. Given the very large proportion of such respondents, it was difficult to assess the potential presence of mode of administration effects simply because these scores were consistently so high across all study conditions.
A previous MOA study with the adult versions of PROMIS in an adult population found no statistically significant effects on mean score levels comparing computer with paper questionnaires, personal digital assistants, or interactive voice response (IVR) phone MOAs [2; 3]. Notable study design differences include the population assessed (all adults), and there was no involvement of a phone interviewer because IVR is an automated phone system that may remove any concerns about biases in providing responses to another person. Score differences between computer and IVR was −0.14 for depression, 0.28 for fatigue, and −0.62 for physical function, below a threshold of ±2 points the authors considered an “ignorable effect” using Cohen’s criteria of a small effect size [18]. Using this same ±2 threshold, our reported score differences in Tables 5 and 6 are also “ignorable”, except for the mode by form interaction for Fatigue scores in the child data and the mode by order interaction in Fatigue scores in the parent-proxy reports.
While we can conclude that scores for these pediatric PROMIS measures are generally comparable across modes of administration, there were enough small effects to warn against using both modes of administration in the same study, in ways that could confound results of interest with mode effects. That is, we would not use computer administration with the treatment group and phone interviews with the control group in order to avoid any effects of mode, even though any possible effects appear small and not directionally consistent. Of course, one could include potential mode effects in a research design, and correct for them with stratification. For example, with a large enough sample size, one could split both arms and make mode of administration a blocking factor.
Overall, however, the correlations between scores obtained with the two modes of administration were high, approximately equal to reliability. And the differences between the means were sufficiently small that they would not affect overall interpretation of the level of scores relative to the population. So it should be reasonable to use either mode of administration, uniformly, in any given study, or with stratification to correct for any mode effects that occur.
A
uthor Man
uscr
ipt
A
uthor Man
uscr
ipt
A
uthor Man
uscr
ipt
A
uthor Man
uscr
Supplementary Material
Refer to Web version on PubMed Central for supplementary material.
Acknowledgments
PROMIS® was funded with cooperative agreements from the National Institutes of Health (NIH) Common Fund Initiative (Northwestern University, PI: David Cella, PhD, U54AR057951, U01AR052177; Northwestern University, PI: Richard C. Gershon, PhD, U54AR057943; American Institutes for Research, PI: Susan (San) D. Keller, PhD, U54AR057926; State University of New York, Stony Brook, PIs: Joan E. Broderick, PhD and Arthur A. Stone, PhD, U01AR057948, U01AR052170; University of Washington, Seattle, PIs: Heidi M. Crane, MD, MPH, Paul K. Crane, MD, MPH, and Donald L. Patrick, PhD, U01AR057954; University of Washington, Seattle, PI: Dagmar Amtmann, PhD, U01AR052171; University of North Carolina, Chapel Hill, PI: Harry A. Guess, MD, PhD (deceased), Darren A. DeWalt, MD, MPH, U01AR052181; Children’s Hospital of Philadelphia, PI: Christopher B. Forrest, MD, PhD, U01AR057956; Stanford University, PI: James F. Fries, MD, U01AR052158; Boston University, PIs: Alan Jette, PT, PhD, Stephen M. Haley, PhD (deceased), and David Scott Tulsky, PhD (University of Michigan, Ann Arbor), U01AR057929; University of California, Los Angeles, PIs: Dinesh Khanna, MD (University of Michigan, Ann Arbor) and Brennan Spiegel, MD, MSHS, U01AR057936; University of Pittsburgh, PI: Paul A. Pilkonis, PhD, U01AR052155; Georgetown University, PIs: Carol. M. Moinpour, PhD (Fred Hutchinson Cancer Research Center, Seattle) and Arnold L. Potosky, PhD, U01AR057971; Children’s Hospital Medical Center, Cincinnati, PI: Esi M. Morgan DeWitt, MD, MSCE, U01AR057940; University of Maryland, Baltimore, PI: Lisa M. Shulman, MD, U01AR057967; and Duke University, PI: Kevin P. Weinfurt, PhD, U01AR052186). NIH Science Officers on this project have included Deborah Ader, PhD, Vanessa Ameen, MD (deceased), Susan Czajkowski, PhD, Basil Eldadah, MD, PhD, Lawrence Fine, MD, DrPH, Lawrence Fox, MD, PhD, Lynne Haverkos, MD, MPH, Thomas Hilton, PhD, Laura Lee Johnson, PhD, Michael Kozak, PhD, Peter Lyster, PhD, Donald Mattison, MD, Claudia Moy, PhD, Louis Quatrano, PhD, Bryce Reeve, PhD, William Riley, PhD, Peter Scheidt, MD, Ashley Wilder Smith, PhD, MPH, Susana Serrate-Sztein, MD, William Phillip Tonkins, DrPH, Ellen Werner, PhD, Tisha Wiley, PhD, and James Witter, MD, PhD. The contents of this article uses data developed under PROMIS. These contents do not necessarily represent an endorsement by the US Federal Government or PROMIS. See www.nihpromis.org for additional information on the PROMIS® initiative.
Abbreviations
PROMIS® Patient-Reported Outcomes Measurement Information
System®
NIH National Institutes of Health
PRO Patient-Reported Outcome
PDA Personal Digital Assistant
MOA Mode of Administration
MANOVA Multivariate Analysis of Variance
MD Mahalanobis Distance
References
1. Cella D, Riley W, Stone A, Rothrock N, Reeve B, Yount S, Amtmann D, Bode R, Buysse D, Choi S, Cook K, Devellis R, Dewalt D, Fries JF, Gershon R, Hahn EA, Pilkonis P, Revicki D, Rose M, Weinfurt K, Hays R, Lai JS. The Patient Reported Outcomes Measurement Information System (PROMIS) developed and tested its first wave of adult self-reported health outcome item banks: 2005–2008. J Clin Epidemiol. 2010; 63(11):1179–1194. [PubMed: 20685078]
2. Bjorner JB, Rose M, Gandek B, Stone AA, Junghaenel DU, Ware JE Jr. Difference in method of administration did not significantly impact item response: an IRT-based analysis from the
Patient-A
uthor Man
uscr
ipt
A
uthor Man
uscr
ipt
A
uthor Man
uscr
ipt
A
uthor Man
uscr
Reported Outcomes Measurement Information System (PROMIS) initiative. Qual Life Res. 2014; 23(1):217–227. [PubMed: 23877585]
3. Bjorner JB, Rose M, Gandek B, Stone AA, Junghaenel DU, Ware JE Jr. Method of administration of PROMIS scales did not significantly impact score level, reliability, or validity. J Clin Epidemiol. 2014; 67(1):108–113. [PubMed: 24262772]
4. Beebe TJ, McRae JA Jr, Harrison PA, Davern ME, Quinlan KB. Mail surveys resulted in more reports of substance use than telephone surveys. J Clin Epidemiol. 2005; 58(4):421–424. [PubMed: 15868697]
5. Hanmer J, Hays RD, Fryback DG. Mode of administration is important in US national estimates of health-related quality of life. Med Care. 2007; 45(12):1171–1179. [PubMed: 18007167]
6. Powers JR, Mishra G, Young AF. Differences in mail and telephone responses to self-rated health: use of multiple imputation in correcting for response bias. Aust N Z J Public Health. 2005; 29(2): 149–154. [PubMed: 15915619]
7. McHorney CA, Kosinski M, Ware JE Jr. Comparisons of the costs and quality of norms for the SF-36 health survey collected by mail versus telephone interview: results from a national survey. Med Care. 1994; 32(6):551–567. [PubMed: 8189774]
8. Kraus L, Augustin R. Measuring alcohol consumption and alcohol-related problems: comparison of responses from self-administered questionnaires and telephone interviews. Addiction. 2001; 96(3): 459–471. [PubMed: 11255585]
9. Irwin DE, Stucky B, Langer MM, Thissen D, Dewitt EM, Lai JS, Varni JW, Yeatts K, DeWalt DA. An item response analysis of the pediatric PROMIS anxiety and depressive symptoms scales. Quality of Life Research: an international journal of quality of life aspects of treatment, care and rehabilitation. 2010; 19(4):595–607.
10. Lai JS, Stucky BD, Thissen D, Varni JW, Dewitt EM, Irwin DE, Yeatts KB, Dewalt DA. Development and psychometric properties of the PROMIS((R)) pediatric fatigue item banks. Quality of life research : an international journal of quality of life aspects of treatment, care and rehabilitation. 2013
11. Dewitt EM, Stucky BD, Thissen D, Irwin DE, Langer M, Varni JW, Lai JS, Yeatts KB, Dewalt DA. Construction of the eight-item patient-reported outcomes measurement information system pediatric physical function scales: Built using item response theory. Journal of Clinical Epidemiology. 2011; 64(7):794–804. [PubMed: 21292444]
12. Varni JW, Thissen D, Stucky BD, Liu Y, Gorder H, Irwin DE, Dewitt EM, Lai JS, Amtmann D, Dewalt DA. PROMIS((R)) Parent Proxy Report Scales: An item response theory analysis of the parent proxy report item banks. Quality of Life Research: an international journal of quality of life aspects of treatment, care and rehabilitation. 2012; 21:1223–1240.
13. Cai, L.; Thissen, D.; du Toit, SHC. IRTPRO for Windows. Lincolnwood, IL: Scientific Software International; 2011.
14. Robinson-Cimpian JP. Inaccurate Estimation of Disparities Due to Mischievous Responders: Several Suggestions to Assess Conclusions. Educational Researcher. 2014; 43(4):171–185. 15. Bock, RD. Multivariate statistical methods in behavioral research. New York: McGraw-Hill; 1975. 16. Schwartz CE, Andresen EM, Nosek MA, Krahn GL, Measurement REPoHS. Response shift
theory: important implications for measuring quality of life in people with disability. Arch Phys Med Rehabil. 2007; 88(4):529–536. [PubMed: 17398257]
17. Thissen D, Norton S. What Might Changes in Psychometric Approaches to Statewide Testing Mean for NAEP? American Institutes for Research. 2013
18. Cohen, J. Statistical Power Analysis for the Behavioral Sciences. Hillsdale, NJ: lawrence Erlbaum Associates; 1988.
19. Maronna RA, Yohai VJ. The behavior of the Stahel-Donoho robust multivariate estimator. Journal of the American Statistical Association. 1995; 90(429):330–341.
A
uthor Man
uscr
ipt
A
uthor Man
uscr
ipt
A
uthor Man
uscr
ipt
A
uthor Man
uscr
Figure 1.
Test characteristic curves for parallel forms.
A
uthor Man
uscr
ipt
A
uthor Man
uscr
ipt
A
uthor Man
uscr
ipt
A
uthor Man
uscr
A
uthor Man
uscr
ipt
A
uthor Man
uscr
ipt
A
uthor Man
uscr
ipt
A
uthor Man
uscr
ipt
T
ab
le 1
Study Design Plan and Sample Size
Pr
e-T
est
P
ost-T
est
Arm
n
Administration
Mode
PR
OMIS
F
orm
Administration
Mode
PR
OMIS Form
PC
→
PC
98
PC
A
PC
B
93
PC
B
PC
A
PC
←→
T
elephone
45
PC
A
T
elephone
B
49
T
elephone
B
PC
A
45
PC
B
T
elephone
A
47
T
elephone
A
PC
B
Note: PC = personal computer self-administered; T
elephone = telephone intervie
wer
A
uthor Man
uscr
ipt
A
uthor Man
uscr
ipt
A
uthor Man
uscr
ipt
A
uthor Man
uscr
ipt
Table 2
Child parallel forms.
Form A Form B
Depressive Symptoms
I felt unhappy. I felt lonely.
I felt alone. I felt sad.
It was hard for me to have fun. I thought that my life was bad.
I felt stressed. It was hard to do school work because I felt
sad.
I felt too sad to eat. I didn’t care about anything.
Fatigue I was too tired to do the things I like
to do.
Being tired made it hard for me to play or go out with my friends.
Being tired made it hard for me to keep up with my school work.
I had trouble starting things because I was too tired.
I felt weak. I had trouble finishing things because I was
too tired.
I got tired easily. I was so tired it was hard for me to pay
attention.
I was too tired to do things outside. I was too tired to do sports or exercise.
Mobility I could get up from the floor. I have been physically able to do the
activities I enjoy most.
I could bend over to pick something up.
I could get in and out of a car.
I could walk up stairs without holding on to anything.
I could get down on my knees without holding onto something.
I could keep up when I played with other kids.
I could go up one step.
I could turn my head all the way to the side.
I could stand up on my tiptoes.
I could stand up by myself. I could move my legs.
A
uthor Man
uscr
ipt
A
uthor Man
uscr
ipt
A
uthor Man
uscr
ipt
A
uthor Man
uscr
ipt
Table 3
Parent-proxy parallel forms.
Form A Form B
Depressive Symptoms
My child felt unhappy. My child felt lonely.
My child felt alone. My child felt sad.
It was hard for my child to have fun. My child felt that his/her life was bad.
My child felt stressed. It was hard for my child to do school work
because he/she felt sad.
My child felt too sad to eat. My child didn’t care about anything.
Fatigue My child was too tired to enjoy the
things he/she likes to do.
Being tired made it hard for my child to play or go out with friends.
Being tired made it hard for my child to keep up with his/her school work.
My child had trouble starting things because he/she was too tired.
My child felt weak. My child had trouble finishing things
because he/she was too tired.
My child got tired easily. My child was so tired it was hard for
him/her to pay attention.
My child was too tired to do things outside.
My child was too tired to do sports or exercise.
Mobility My child could get up from the floor. My child has been physically able to do the
activities he/she enjoys most.
My child could bend over to pick something up.
My child could get in and out of a car.
My child could walk up stairs without holding on to anything.
My child could get down on his/her knees without holding onto something.
My child could keep up when he/she played with other kids.
My child could go up one step.
My child could turn his/her head all the way to the side.
My child could stand up on his/her tiptoes.
My child could stand up without help.
My child could move his/her legs.
A
uthor Man
uscr
ipt
A
uthor Man
uscr
ipt
A
uthor Man
uscr
ipt
A
uthor Man
uscr
ipt
Table 4
Demographic characteristics of the respondents retained for MOA analyses
Child Characteristics N = 377 (%)
Gender Female 192 (50.9)
Age 8–12 194 (51.5)
13–17 183 (48.5)
Mean (SD) 12.4 (2.9)
Ethnicity Hispanic/ Latino 69 (18.3)
Race* White or Caucasian 258 (68.4)
Black or African American 57 (15.1)
American Indian or Alaskan Native 8 (2.1)
Asian 29 (7.7)
Native Hawaiian or Other Pacific Islander 2 (0.5)
Other 40 (10.6)
Health Conditions** Allergies 105 (27.9)
Asthma 52 (13.8)
ADHD 31 (8.2)
Overweight 26 (6.9)
Mental Health Condition 20 (5.3)
Parent Characteristics N = 375 (%)
Gender Female 282 (75.2)
Age Mean (SD) 37.6 (8.4)
Ethnicity Hispanic/ Latino 58 (15.5)
Race* White or Caucasian 260 (69.3)
Black or African American 48 (12.8)
American Indian or Alaskan Native 10 (2.7)
Asian 25 (6.7)
Native Hawaiian or Other Pacific Islander 2 (0.5)
Other 36 (9.6)
Relationship to Child Mother or stepmother 276 (73.7)
Father or stepfather 89 (23.7)
Grandmother 2 (0.5)
Guardian, Foster Parent, or Other 8 (2.1)
Parent Relationship Status Married 237 (63.2)
Separated, Divorced, or Widowed 55 (14.7)
Living with partner 48 (12.8)
Never married 35 (9.3)
Maternal education Did not complete high school 15 (4.0)
A
uthor Man
uscr
ipt
A
uthor Man
uscr
ipt
A
uthor Man
uscr
ipt
A
uthor Man
uscr
ipt
Child Characteristics N = 377 (%)
Some college or associates degree 146 (38.9)
College degree 114 (30.4)
Advanced degree 15 (4.0)
Unknown 1 (0.3)
Parent rating of own health Excellent or Very Good 249 (66.4)
Good 111 (29.6)
Fair 15 (4.0)
*
Respondents could endorse more than one race, so totals add up to more than 100%.
**
A
uthor Man
uscr
ipt
A
uthor Man
uscr
ipt
A
uthor Man
uscr
ipt
A
uthor Man
uscr
ipt
T ab le 5Means, SDs, and test-retest reliabilities for child self-report scores.
Depr essi v e Symptoms F atigue Mobility Condition Mode-F orm Pr e-T est Mean (SD) P ost-T est Mean (SD) Pr e-T est Mean (SD) P ost-T est Mean (SD) Pr e-T est Mean (SD) P ost-T est Mean (SD) PC-A-PC-B correlation * 48.31 (8.95) 47.23 (9.38) 44.47 (9.48) 44.09 (9.19) 53.24 (7.43) 53.11 (7.21)
r = 0.91
r = 0.86
r = 0.75
PC-B- PC-A correlation
* 48.79 (10.54) 49.48 (10.90) 45.15 (9.93) 44.37 (10.50) 54.08 (6.10) 54.47 (5.79)
r = 0.93
r = 0.89
r = 0.81
A v erage 48.54 48.33 44.80 44.23 53.65 53.77 Condition Mode-F orm PC Mean (SD)
Phone Mean (SD)
PC
Mean (SD)
Phone Mean (SD)
PC Mean (SD)
Phone Mean (SD)
PC-A-Phone-B correlation * 49.57 (11.13) 47.95 (10.52) 42.76 (10.85) 43.43 (11.17) 52.80 (7.49) 52.85 (6.99)
r = 0.85
r = 0.94
r = 0.71
Phone-B-PC-A correlation * 49.75 (10.04) 50.27 (10.17) 44.93 (10.07) 47.15 (10.82) 53.06 (7.50) 52.02 (8.38)
r = 0.83
r = 0.92
r = 0.88
PC-B-Phone-A correlation * 50.89 (9.29) 52.26 (9.38) 48.68 (10.25) 48.72 (9.56) 52.01 (8.73) 52.12 (8.86)
r = 0.88
r = 0.87
r = 0.94
Phone-A-PC-B correlation * 49.46 (10.32) 50.75 (9.48) 49.01 (10.70) 48.79 (9.87) 51.84 (7.11) 53.22 (6.02)
r = 0.88
r = 0.90
r = 0.80
A
uthor Man
uscr
ipt
A
uthor Man
uscr
ipt
A
uthor Man
uscr
ipt
A
uthor Man
uscr
ipt
A
uthor Man
uscr
ipt
A
uthor Man
uscr
ipt
A
uthor Man
uscr
ipt
A
uthor Man
uscr
ipt
T ab le 6Means, SDs, and test-retest reliabilities for parent proxy scores.
Depr essi v e Symptoms F atigue Mobility Condition Mode-F orm Pr e-T est Mean (SD) P ost-T est Mean (SD) Pr e-T est Mean (SD) P ost-T est Mean (SD) Pr e-T est Mean (SD) P ost-T est Mean (SD) PC-A-PC-B correlation * 49.91 (9.56) 48.59 (10.18) 48.56 (9.42) 46.37 (9.72) 52.06 (6.31) 51.54 (6.85)
r = 0.85
r = 0.85
r = 0.87
PC-B-PC-A correlation * 50.66 (10.69) 48.93 (10.44) 48.49 (10.27) 46.83 (8.96) 52.18 (5.85) 52.51 (5.51)
r = 0.89
r = 0.86
r = 0.84
A v erage 50.28 48.76 48.53 46.60 52.12 52.02 Condition Mode-F orm PC Mean (SD)
Phone Mean (SD)
PC
Mean (SD)
Phone Mean (SD)
PC
Mean (SD)
Phone Mean (SD)
PC-A-Phone-B correlation * 51.38 (9.65) 50.01 (11.00) 47.26 (9.96) 45.24 (10.04) 51.37 (7.09) 51.14 (6.78)
r = 0.87
r = 0.90
r = 0.78
Phone-B-PC-A correlation * 50.80 (9.83) 51.93 (11.10) 48.37 (10.35) 52.60 (10.36) 50.03 (7.65) 50.39 (7.27)
r = 0.80
r = 0 .82
r = 0.96
PC-B-Phone-A correlation * 53.37 (10.76) 52.55 (10.56) 51.97 (10.50) 50.91 (9.54) 49.81 (7.56) 50.30 (7.88)
r = 0.91
r = 0.90
r = 0.87
Phone-A-PC-B correlation * 50.82 (11.01) 51.11 (9.58) 50.80 (10.77) 52.13 (9.56) 49.97 (6.08) 50.95 (5.81)
r = 0.80
r = 0.84
r = 0.77
A v erage 51.58 51.39 49.56 50.19 50.30 50.70