i
ESSAYS ON RELATIONSHIP MARKETING
Farnoosh Khodakarami
A Dissertation submitted to the faculty at the University of North Carolina at Chapel Hill in partial fulfillment of the requirements for the degree of Doctor of Philosophy in Business
Administration in the Kenan-Flagler Business School.
Chapel Hill 2016
ii © 2016
iii
ABSTRACT
Farnoosh Khodakarami: Essays on Relationship Marketing (Under the direction of Rajdeep Grewal and J. Andrew Petersen)
Relationship marketing (RM) is defined as “all marketing activities directed towards establishing, developing, and maintaining successful relational exchanges” (Morgan and Hunt 1994, p. 22). Firms invest in RM activities to develop and maintain relationship with customers. Relationship marketing is not new to marketing literature. However, investigations report mixed results regarding the effectiveness of relationship marketing (Palmatier et al. 2006. Palmatier 2008). There is still need for research to guide managers on how to develop and maintain relationship with customers; which customers are better target for relationship marketing initiatives; how customer’s relationship with an organization evolve over time and when
relationship marketing is more effective to enhance customer behavior. Specifically, research in relationship marketing is often studied within the frame of a single firm, due to data limitation. There has yet to be much research that sheds light on how customers build and maintain relationship with multiple firms in a competitive environment. In this dissertation, I aim to answer these questions with two studies.
iv
v
To my parents, Minoo Hekmat and Maghsood Ali Khodakarami The reason of what I become today.
vi
ACKNOWLEDGEMENTS
The completion of my dissertation and subsequent Ph.D. has been a long journey. It would not have been possible to do without the support and guidance that I received from several people. First, I would like to express my special appreciation and thanks to my advisors, J. Andrew Petersen and Rajdeep Grewal. I am extremely grateful to Andrew Petersen, for his invaluable guidance, scholarly input, and his continuous support throughout my Ph.D. I would like to express my sincere gratitude to Rajdeep Grewal for his support, immense knowledge, and for helping me out by accepting to serve as my co-advisor. In addition, I would like to thank the rest of my dissertation committee, Katrijn Gielens, Tarun Kushwaha, and Rajkumar Venkatesan, for their time, valuable advice and feedback through the doctoral program and dissertation work.
I also thank my best friend and soulmate, Saeed Jafaei. These past several years have not been an easy ride for me. Saeed was always there to cheer me up and help me in so many ways to deal with all the stress of Ph.D. life. I truly thank him for his love, constant support and encouragement, and for helping me gain confidence in my abilities.
vii
TABLE OF CONTENTS
LIST OF TABLES………..………x
LIST OF FIGURES ... xi
CHAPTER 1: INTRODUCTION ... 1
REFERENCES ... 5
CHAPTER 2: DEVELOPING DONOR RELATIONSHIPS: THE ROLE OF THE BREADTH OF RELATIONSHIP ... 6
Abstract ... 6
Introduction ... 7
Study 1: Drivers and Consequences of Donation Variety ... 11
Hypothesis Development ... 13
Data ... 17
Variable Operationalization ... 19
Model Development ... 23
Results ... 28
Comparing Donation Variety with Breadth and Depth of Donations ... 31
Discussion ... 32
Study 2: Field Study ... 34
Objective and Setup ... 34
Method ... 35
viii
Discussion ... 38
Implications to Marketing Theory and Practice ... 39
Theoretical Implications ... 39
Managerial Implications ... 40
Limitations and Further Research ... 42
REFERENCES ... 43
CHAPTER 3: CUSTOMER LOYALTY PROGRAM USAGE ACROSS FIRMS ... 55
Abstract ... 55
Introduction ... 56
Theory Development ... 61
Point Pressure Mechanism... 62
Rewarded Behavior Mechanism ... 64
Hypotheses Development ... 65
Effect of Loyalty Program Usage on Customer Behavior at the Focal Firm ... 66
Effect of Loyalty Program Usage on Customer Behavior across Other Firms ... 67
Empirical Application ... 69
Data ... 69
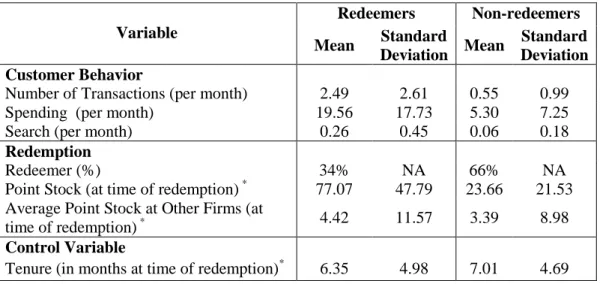
Model Free Evidence ... 70
Methodology ... 72
Main Model Development ... 75
Results ... 78
Propensity Score Matching ... 78
ix
Discussion ... 80
Does Purchase Rate before Redemption Matter? ... 82
Implications to Theory and Practice ... 84
Implications to Theory... 84
Implications to Practice ... 85
Limitations and Future Research ... 86
REFERENCES ... 88
CHAPTER 4: CONCLUSION ... 103
APPENDIX 2.A: REVIEW OF SIMILAR STUDIES ... 105
APPENDIX 2.B: INSTRUMENTAL VARIABLE MODEL AND ESTIMATION ... 106
x
LIST OF TABLES
Table 2.1 Variable operationalizations and descriptive statistics ... 48
Table 2.2: Results for the drivers and consequences models... 49
Table 2.3: Donor selection using donation variety and cross-donation/total donationa ... 50
Table 2.4: Descriptive sta tistics for field study ... 50
Table 2.5: Results from the field study ... 50
Table 3.1: Descriptive statistics ... 92
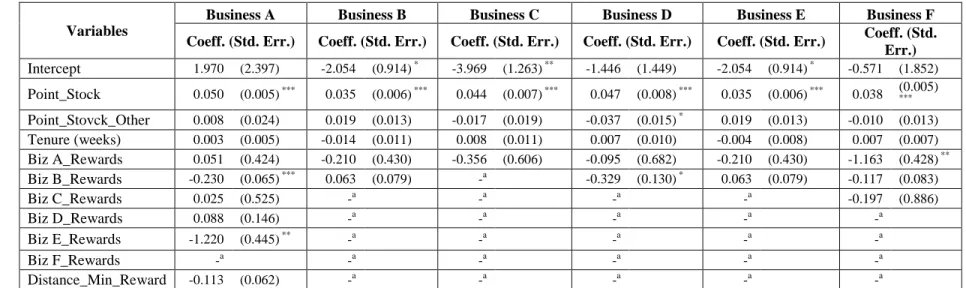
Table 3.2: Results of redemption models ... 93
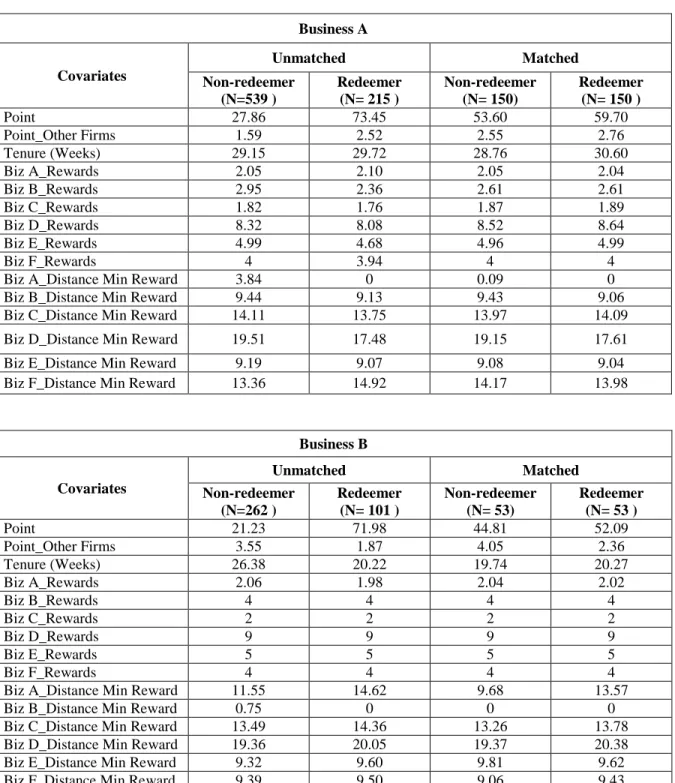
Table 3.3: Means of covariates in matched vs. unmatched samples ... 94
Table 3.4: Percentage reduction in bias (PRB) after matching ... 97
Table 3.5: Results for search behavior model ... 98
Table 3.6: Results for purchase behavior models ... 99
Table 3.7: Purchase and search behavior of redeemers ... 100
Table 2.B1: Results for the instrumental variable models ... 108
Table 2.B2: Instrumental variables regressed on donation amount ... 109
Table 2.B3: Instrumental variables regressed on donation variety ... 110
Table 2.C1: Results for the Donation Variety and Cross-donation Models ... 111
xi
LIST OF FIGURES
Figure 2.1: Model free evidence: before and after giving to multiple initiatives ... 51
Figure 2.2a: Degrees and donor lifecycle ... 51
Figure 2.2b: Spouse and donor lifecycle... 52
Figure 2.2c: Impersonal marketing and donor lifecycle ... 52
Figure 2.2d: Personal marketing and donor lifecycle ... 53
Figure 2.3a: Economic condition and donation variety ... 53
Figure 2.3b: Impersonal marketing and donation variety ... 54
Figure 2.3c: Personal marketing and donation variety ... 54
Figure 3.1a: Model free evidence: average inter-purchase time at the focal firm in weeks (sd) before and after redemption ... 101
Figure 3.1b: Model free evidence: average inter-purchase time at other firms in weeks (sd) before and after redemption ... 101
Figure 3.2a Average purchase frequency per week, before and after redemption ... 102
1
CHAPTER 1: INTRODUCTION
Firms rely on relationship marketing (RM) practices to develop and maintain relationship with their customers, with the goal of enhancing performance (Palmatier 2008). However, past research shows mixed results for impacts of relationship marketing on performance outcomes (e.g. Colgate and Danaher 2000 ; Palmatier et al. 2006; Srinivasan and Moorman 2005) . Specifically with regard to loyalty programs that are commonly used to enhance customers’ relationship with the firm, there is still ambiguity on whether these programs can successfully increase behavior loyalty (Dowling and Uncles 1997; Leenheer et al. 2007).
2
many industries it is common that customers transact with multiple competing firms. Thus, in order to investigate the impact of RM practices of a firm on customer behavior one needs to consider a customer’s interactions across all firms, and whether these RM practices have cross-firm effects on customer behavior (Leenheer et al. 2007; Liu and Yang 2009).
In my dissertation, I aim to tackle these aspects of relationship marketing that has not been thoroughly investigated. More specifically, I aim to answer the following research questions:
What are the drivers of relationship with an organization?
How do relationships with an organization evolve over the customers’ life cycle? How do customers’ relationships with multiple organizations evolve over time?
In the first essay, I answer the first two questions. Within a non-profit context, I examine whether the breadth of relationship impact performance outcomes, and whether the drivers of relationship change over time. For this study, I use the donor database of a major public university foundation. I empirically test if donors who build a broader relationship with the nonprofit are more valuable to the organization over time. I show that breadth of relationship has significant impact on donor behavior. Donors with broader relationship are more likely to give again in the next fiscal year and conditional on a gift occurring, expected value of the gift is larger. Further, these donors are more responsive to the organization’s marketing
communications. I also show that drivers of relationship change over time. I find in general that donor characteristics are more influential in driving the breadth of the relationship at the
3
Knowing that donors who have broader relationship with the organization are more valuable, I conduct a field study to show that relationship marketing communications help to increase the breadth of relationship donors build with the organization.
In the second essay, I answer the third question and explore customers’ relationships with multiple organizations. Customers usually are not 100% loyal to one firm and purchase across firms. Many firms offer loyalty programs, to reward their best customers and enhance the relationship with those customers. However, customers are members of and influenced by loyalty programs across many different firms. In essay 2, I investigate how a customer’s reward redemption at a firm impacts that customer’s future search and transaction behavior at that firm as well as with competing firms. To do this, I use a novel dataset from a mobile advertising and loyalty app provider which partners with multiple firms and allows customers to manage
4
5
REFERENCES
Colgate, Mark R. and Peter J. Danaher (2000), “Implementing a Customer Relationship Strategy: The Asymmetric Impact of Poor versus Excellent Execution,” Journal of the Academy of Marketing Science, 28 (3), 375–87.
Dowling, Grahame R., and Mark Uncles (1997), "Do Customer Loyalty Programs Really Work?," Sloan Management Review, 38(4), 71-82
Ganesan, Shankar (1994), “Determinants of Long-term Orientation in Buyer-seller Relationships,” Journal of Marketing, 58(2), 1-19.
Leenheer, Jorna, Harald J. Van Heerde, Tammo HA Bijmolt, and Ale Smidts (2007), “Do Loyalty Programs Really Enhance Behavioral Loyalty? An Empirical Analysis Accounting for Self-Selecting Members,” International Journal of Research in Marketing, 24(1), 31-47. Liu, Yuping and Rong Yang (2009), “Competing Loyalty Programs: Impact of Market
Saturation, Market Share, and Category Expandability,” Journal of Marketing 73(1), 93-108. Morgan, Robert M., and Shelby D. Hunt (1994), "The Commitment-trust Theory of Relationship
Marketing." Journal of Marketing, 58(3), 20-38.
Moorman, Christine, Gerald Zaltman, and Rohit Deshpande (1992), "Relationships between Providers and Users of Market Research: The Dynamics of Trust," Journal of Marketing Research, 29(3), 314-28.
Palmatier, Robert W., Rajiv P. Dant, Dhruv Grewal, and Kenneth R. Evans (2006), "Factors Influencing the Effectiveness of Relationship Marketing: A Meta-analysis," Journal of Marketing , 70( 4), 136-53.
Palmatier, Robert W. (2008), “Relationship Marketing,” Cambridge, MA: Marketing Science Institute.
Sirdeshmukh, Deepak, Jagdip Singh, and Barry Sabol (2002), "Consumer Trust, Value, and Loyalty in Relational Exchanges," Journal of Marketing, 66(1), 15-37.
6
CHAPTER 2: DEVELOPING DONOR RELATIONSHIPS: THE ROLE OF THE
BREADTH OF RELATIONSHIP1
Abstract
This research proposes a mechanism to develop long term donor relationships, a major challenge in the nonprofit industry. We propose a metric, Donation Variety, which captures both the depth and breadth of donations a donor has with a given nonprofit organization. Using donation data spanning twenty years from a major US public university, we find that improvements in Donation Variety increases the likelihood the donor makes a subsequent donation along with the donation amount and reduces the sensitivity of donations to negative macroeconomic shocks. In the acquisition phase, most donors give to a single initiative and that these decisions are influenced more by a donor’s intrinsic motivations. In contrast, as the donor-nonprofit organization relationship develops over time, donor-nonprofit marketing efforts have a more significant influence on a donor’s decision to give to multiple initiatives. Finally, we conduct a field study that validates the econometric analysis and provides causal evidence that marketing efforts by nonprofit organizations can encourage donors to spread donations across multiple initiatives.
Keywords: Donation Variety, Field Study, Cross-buying, Donor Relationship Management
1
7
Introduction
From 1999 to 2009 there has been a 59% growth in the number of public charities and a 54% growth in the number of foundations in the US. However, the growth of donations has been relatively slow. Adjusting for inflation, private charitable giving remained steady at $290.89B between 2000 and 2010.2 With decreasing government support and the slow growth of
donations, competition for scarce resources among nonprofit organizations has become intense (Foster and Meinhard 2002; Sargeant and Woodliffe 2007; Thornton 2006). Nonprofits have to spend substantial resources in donor acquisition activities, with about half of the newly acquired donors lost after the first donation (Magson 1999; Masters 2000; Sargeant and Woodliffe 2007). For instance, in the higher education sector, the retention rate for first time donors has been below 30% in 2012 and 2013.3 Thus, building long-term relationships with donors becomes critical for nonprofits. To combat this challenge, many nonprofits now keep donor-level information that can be leveraged for donor selection and optimal resource allocation (Kumar and Petersen 2005; Lemon, White, and Winer 2002).
This raises an interesting question about whether strategies to manage customer relationships in the for-profit sector can be easily translated as strategies to manage donors in the nonprofit sector. While the data collection process is similar (i.e. recording transactions, marketing efforts, and customer/donor characteristics), the motivations of donors to give varies significantly from the motivations of customers to purchase (Ariely and Norton 2009). However, there are not been
2
National Center for Charitable Statistics (NCCS) data, available at:
http://nccs.urban.org/statistics/index.cfm
3
8
much research into repeat giving behavior by donors to nonprofit organizations. Thus, it is important to understand how acquisition and retention strategies impact sustained giving.
An approach observed specifically in the non-profit industry to motivate sustained giving is to give donors control over how their gift is utilized by the nonprofit. In fact, many nonprofit organizations now offer multiple causes, initiatives, or areas where donations can be directed. The American Red Cross and UNESCO have been using this strategy for a while, and many companies now run cause-related marketing campaigns with multiple causes from which donors can choose. Providing donors with the opportunity to direct their gift toward specific causes or fundraising projects is driven by management beliefs that such options can help increase donation intentions and donor retention. Anecdotal evidence seems to corroborate this belief. Survey studies show that consumers have greater interest in participating in cause-related campaigns that allow donors to choose a charity they want to support.4 Lab experiments also show that targeting donations has a positive effect on gift amount (Li et al. 2013; Robinson, Irmak, and Jayachandran 2012). However, there is no research which explores the drivers and consequences of a donor’s decision to support multiple initiatives at a nonprofit organization.
We focus on this phenomenon of giving to multiple initiatives in our research and
empirically test if donors who support multiple initiatives of a nonprofit organization are in fact more valuable over time. We measure the depth and breadth of giving by a donor using a single individual- and time-varying metric we call Donation Variety. We define Donation Variety as the weighted sum of the share of each initiative a donor supports, where the weight for each initiative is the logarithm of the share (similar to the measurement of entropy).
4
For instance, 73% of respondents in survey said that they would be more likely to participate in a cause marketing program if they were allowed to choose which charity is selected in-store. Source:
9
Our research has three main research questions. In the first study, we focus on answering the first two research questions. In order to answer these first two research questions, we analyze twenty years of donation history of a nonprofit organization. To start, we want to better understand what motivates donors to increase the depth and breadth of their support of a nonprofit organization (i.e. increase Donation Variety). We expect that the factors which drive Donation Variety are likely to change over the course of the donor’s relationship with the nonprofit organization (from acquisition through retention). Thus, our first research question is:
1. What factors motivate donors to increase the depth and breadth (Donation Variety) of their support of a nonprofit at different stages of their relationship life cycle?
We find in general that a donor’s ties to the nonprofit are more influential in driving
Donation Variety at the acquisition stage. However, as the donor-nonprofit relationship develops
over time (during the retention phase), marketing efforts from the nonprofit organization become more influential at driving Donation Variety. In the second part of the first study, we want to understand the impact that Donation Variety has on a donor’s future giving behavior.
Specifically, our goal is to empirically test, after controlling for the other key drivers of giving behavior, how the distribution of past gifts among multiple causes (Donation Variety) affects the future giving behavior of a donor. Thus, our second research question is:
2. What is the effect of the depth and breadth of past gifts (Donation Variety) to a nonprofit on future donor giving behavior?
10
In the second study, we further explore the causal relationship between marketing actions and Donation Variety through a field study with the focal nonprofit organization. The goal is to
understand how changes in the marketing communications by the nonprofit organization can induce different levels of Donation Variety. Through this field study we aim to answer our third research question:
3. Can nonprofit organizations use targeted marketing efforts to encourage donors to increase their Donation Variety?
We find through our field study that marketing communications that encourage donating to an additional initiative were able to significantly increase the probability of a donor giving again in the future and, conditional on the gift, giving more in total. Further, we found that when donors who already give to multiple initiatives (n = x) are encouraged to give to another
initiative (n = x+1), these donors were just as likely to give again as donors in the control group, but the total amount of giving was higher.
11
choice of multiple causes to direct their gifts and how this decision to spread gift across causes affects the donor’s future giving to that nonprofit. We also take advantage of field study to provide causal evidence that marketing efforts by nonprofit organizations can encourage donors to give to multiple causes and give more to the nonprofit.
The rest of this paper proceeds as follows. First, we discuss theoretical foundation and
hypotheses and define Donation Variety and illustrate its measurement. Then, we empirically test what factors drive donors to increase Donation Variety and the consequences of Donation
Variety of past gifts on future giving behavior. Next, we describe and provide results of a field study we ran with the focal nonprofit organization. Finally, we discuss the implications along the limitations and opportunities for further research.
Study 1: Drivers and Consequences of Donation Variety
From an exchange process perspective, the ongoing relationship process between the nonprofit organization and the donor follows steps similar in nature to the firm-customer exchange process outlined by Gupta and Zeithaml (2006). First, the nonprofit organization communicates with potential donors to acquire them through various marketing efforts. Second, the potential donors make a set of simultaneous decisions on: (1) whether to donate and
12
Nonprofits that offer multiple donation options hope that this strategy increases donation intentions and donor retention. Giving choices to donors increase a donor’s perception of having a personal role in helping a nonprofit organization. This facilitates development of role identity by creating a sense of “self-determination” and “ownership,” and allows donors to contribute in personally meaningful ways (Grant 2012). In experimental settings, giving donors control to choose between multiple programs offered by a charity increased both donation amount and purchase intention for the associated products (Null 2011; Robinson, Irmak, and Jayachandran 2012). Despite the prevalence of multiple-cause donation, there is little empirical research on whether giving to multiple causes increases the donor’s repeat giving behavior to the nonprofit and what factors may motivate a donor to distribute her gift across multiple causes (Bennett 2012; Ly and Mason 2012).
Literature on variety in consumption of goods and services suggest that a consumer may seek variety because of satiation with current options or need for novelty (Kahn 1995; McAlister and Pessemier 1982). However, when a donor makes a gift, she sacrifices her own “physical
13 Hypothesis Development
Drivers of Donation Variety. First, we would like to explore what factors influence a donor’s decision to support multiple causes of a nonprofit. Similar to customer-firm relationship, both internal and external motivators may impact a donor-nonprofit relationship. Individual are intrinsically motivated when they get inherent satisfaction and enjoyment from their act. Intrinsic motivators are thus “an endogenous part of a person’s engagement in the activity". Extrinsic motivations on the other hand come from an outside source and encourage individual to obtain a desired outcome (Amabile 1993; Ryan and Deci 2000). A donor’s engagement with a nonprofit may internally drive the donor’s decision to support multiple causes of the nonprofit. For instance, a donor who has personal interest and experience with different causes may feel more broadly tied to the nonprofit than a donor who is mainly interested in fewer causes and focuses her support on those causes. In addition, nonprofit-initiated marketing efforts are an external motivator for a donor to support multiple causes. Given that the context of charitable giving is highly relationship-based, we investigate how these two key factors (intrinsic vs. extrinsic) affect donation variety in two stages of a donor’s life cycle (acquisition vs. retention).
14
specific cause and how those causes align with internal fit (i.e. causes that are closer to their heart) (Aaker and Akutsu 2009; Sirgy 1982). Thus, a donor who has a personal experience or identifies with multiple causes of the nonprofit is more likely to support multiple causes. When a donor makes her first gift to a nonprofit organization, she may have limited knowledge about the various donation options offered by the organization. In addition, at the early stage of relationship, individuals have less confidence in their evaluation of an organization’s offerings and might feel uncertain about the way in which the nonprofit provides value to the recipients of various causes (Bolton 1998; Swann and Gill 1997; Verhoef, Franses, and Hoekstra 2002). Thus, at the initial stage of relationship (acquisition), donors are more likely to make donation choices based on their personal experiences with specific causes and degree of identification with a cause (internal motivators). And, a donor who can relate to multiple causes initially is more likely to give to multiple causes for her first donation compared to a donor who is initially tied only to a single or few causes. Thus, we hypothesize:
H1: The positive effect of a donor’s intrinsic motivators on Donation Variety is stronger in
the acquisition phase than the retention phase.
Extrinsic Motivators. Individuals may engage in an act because of an external source that motivates them to obtain a desired outcome. Donors may be driven to donate by external motivators, in this case ongoing marketing communications between the foundation and the donor. Like customer loyalty, donor loyalty requires appropriate communication and a relationship-building strategy. If donors are “neglected and not asked for a second gift,” their contributions might decrease or even stop after a first donation (Andreoni 2006; Bekkers and Wiepking 2007; Sargeant 2001). Nonprofits that give feedback to donors by expressing
15
organization and their willingness to engage in repeat giving (Bekkers and Wiepking 2007; Kottasz 2004; Sargeant 2001).
Marketing efforts such as loyalty programs and direct mails have positive effect on cross-buying of additional products and services (Kumar, George, and Pancras 2008; George, Kumar, and Grewal 2013; Verhoef, Franses, and Hoekstra 2001; Li, Sun, and Montgomery 2011). Likewise, nonprofits can leverage targeted marketing techniques to develop more relationship with donors, provide information about organization’s various causes and programs, and introduce donors to new donation opportunities. Further, as the donor-nonprofit relationship grows over time, the donor develops more trust toward the nonprofit and its ability to provide value to the recipient of donation. This trust influences them to give to more causes they are aware of from marketing communications even if they don’t have prior ties with the causes. As a result, we expect that over time, the donor becomes more receptive to the nonprofit’s communications and solicitation requests to support additional causes (Celsi and Olson 1988). Thus, we hypothesize:
H2: The positive effect of extrinsic motivators on Donation Variety is stronger in the
retention phase than the acquisition phase.
Consequences of Donation Variety. Main effect of Donation Variety: Charitable
16
reinforce a donor’s contribution to the nonprofit (Apinunmahakul and Devlie 2008; Brooks 2005; McAdam and Paulsen 1993, Brown and Ferris 2007). In addition, people with more diverse and extended social networks are more exposed to donation and volunteering
solicitations and may have lower cost of giving (Brown and Ferris 2007; Uzzi 1999). As a result, a donor with more extended network with a nonprofit may gain higher perceived utility from her gift to the nonprofit, and in turn she is expected to make more donations in future. Thus, we expect the incremental benefits from a more extended donor-nonprofit network to be more valuable than the gain from a donor-nonprofit relationship that focuses on fewer causes. In addition, giving repeatedly to a single initiative might lead to a decrease in marginal warm-glow utility derived from the act of giving. This in turn decreases a donor’s willingness to give in the future (Andreoni 1990). In an experimental study, Null (2011) show that warm glow utility of giving can lead to “a love of variety” among charities. In her experiment, most participants give simultaneously to multiple charities even when charities are similar in mission, and even when the benefits of the gift to the recipient were set at different levels by varying matching rate. We expect that giving to a variety of causes increase the marginal utility and total satisfaction a donor experiences from giving to a nonprofit organization. Satisfaction and positive evaluation of an experience leads to repeated engagement with that experience (Bennett 2012; Grant 2012). We argue that after controlling for a donor’s amount of past gift and a donor’s capability of giving, donors who have previously distributed their gift across more donation options (i.e. higher Donation Variety) will give more in future. Thus, we hypothesize:
17
Moderating effect of Donation Variety on economic shocks. Economic shocks have a significant impact on a donor’s ability and desire to make a donation. As the economic condition declines and purchasing power decreases across all individuals, people start to cut down on unnecessary costs. For instance, during the recent economic downturn in the US, the percentage of consumers involved in a nonprofit cause dropped from 60 to 53 percent within two years.5 The
uncertainties of economic shocks have a significant impact on a nonprofit’s ability to predict future donor value. During an economic downturn the cost of giving increases, and all donors face a declining budget requiring some costs to be cut. In such situations, donors with weak ties to the nonprofit may be more willing to cut their support to a charity that they do not feel strongly tied to. However, donors with strong ties to the nonprofit may be more willing to tradeoff on some of their other costs to keep up with support. Donors with strong tie the nonprofit have internalized a donor role into their identity and feel more committed to sustain their support even when economic conditions decline (Brown and Ferris 2007; Seargant and Woodliffe 2007). Thus, we hypothesize:
H4: As the macroeconomic climate declines, individuals with a higher Donation Variety will respond less negatively than donors with a lower Donation Variety.
Data
Context.We chose a university foundation as the context to empirically test our hypotheses. Donations to educational organizations are of great importance. In the United States, education organizations receive the second-largest share of all charitable contributions.6 Higher educational
5
http://www.causemarketingforum.com
6
18
organizations are greatly dependent on contributions of alumni donors. Further, the ability to acquire and retain alumni donors is a major challenge for higher educational organizations. Despite the economic growth after the great economic recession, the declining acquisition rate of new alumni donors is a threat for survival of higher education organizations. Another major challenge for educational institutions is a low retention rate, especially since the majority of donors are lost after their first gift.7 Thus, understanding a donor’s behavior and motivations for sustained support is of great importance for educational organizations.
Further, educational foundations allow donors to give to multiple units. Within a college or university, donors can choose to either generally donate to an unrestricted fund to be used at the foundation’s discretion, or the donor can choose to make a donation which is targeted to specific departments, associations, scholarships, memorials, etc. To motivate our econometric model, we run an exploratory analysis on the donation data of a major public university foundation to see whether there is a difference between the ongoing giving behaviors of donors who give to one initiative versus those who give to multiple initiatives.
For our analysis, we use the donor database of a major public university foundation. The focal university has 44 specific departments and associations where donors can direct their donations, including, but not limited to, funds for specific colleges, schools, groups,
scholarships, memorials, as well as a general unrestricted fund. We focus only on donors from the annual giving program and exclude donors involved in or targeted for major planned and capital gifts. Planned gifts and capital gifts are one time large gifts that are often at or near the end of the relationship (e.g. bequests) or dedicated to special projects (e.g. scholarships,
7
Annual Report on Higher Education Alumni Giving, 2013. Source:
19
buildings). These major gifts are only made by a small segment of donors. On the other hand, the majority of donors participate in the annual giving program. Annual gifts are smaller gifts that require yearly decision-making by donors. We believe these recurring gifts offer a good representation of the ongoing relationship between most donors and nonprofit organizations.
Sampling. We use a stratified random sample of 500 donors in the annual giving program that made their first gift in each of the years between fiscal year (FY)8 1993 and FY 2003 and record each individual’s characteristics and donation behavior aggregated at the annual level through the end of FY 2012. This gives us a sample of 5,500 donors (500 for each year) with an average of 15 years of data for each donor. In our dataset, each donation is on average around $381, the total donations per donor over the observation window are about $2,391, and the total number of gifts in the observation window is about 11.2 per donor. 96% of donors made their initial donation to a single initiative leaving only about 4% who donated to more than one initiative in the first year. By the end of FY 2012, 67% of donors gave to multiple initiatives. This means after the initial gift, a majority of donors gave to new initiatives in a subsequent year.
Variable Operationalization
Donation Variety. The key variable we use in our model is Donation Variety. We propose that, in addition to the number of different initiatives an individual donates to, it is important to measure the strength of the ties a donor builds with a nonprofit through supporting multiple initiatives. Therefore, we introduce the variable Donation Variety to differentiate various donation patterns. Here, we define the Donation Variety for a given donor as the weighted sum
8
20
of the share of each initiative a donor supports, where the weight for each initiative is the logarithm of its share. Thus, Donation Variety can be represented as:
it Variety
Donation (1)
At a given point in time t for donor i, Sijt is the share of the total donation donor i made to initiative j until time t relative to the total donation donor i made to the nonprofit organization until that time. For a donor who gives exclusively to a single initiative, Donation Variety is 0. The Donation Variety increases as a donor gives to more initiatives and gives evenly across many different initiatives. Donation variety is a cumulative measure of giving behavior that takes into account both the number of initiatives an individual selects for donation and the relative importance of each initiative in the total amount of donation. This measure gets updated every time a donor makes a new donation to reflect the change in the giving portfolio.
The Donation Variety index is similar to the entropy measure that is used to measure the level of diversity in a company’s business portfolio as well as in an individual’s investment portfolio (e.g. Chatterjee, and Blocher 1992; Hoskisson, et al. 1993; Palepu 1985; Palich, Cardinal, and Miller 2000; Woerheide and Persson 1993). Entropy measure has also been applied by marketing scholars to model customer brand preferences using market share of various brands (Herniter 1976; Kapur, Bector, and Kumar 1984). Similarly, Simonson and Winer (1992) applied a variety score based on the overall share of items purchased by household to account for choice variety. The authors also used the sum of the squares of the brands' shares to measure “taste concentration” (homogeneity) in a household’s purchase portfolio. Further, Kahn (1995) recommends the use of entropy measure to account for variety in a consumer’s purchase portfolio. Kahn (1995) argues that: “even if the number of items included in the choice set is constant, there is more variety in the choice history if the choice shares of the items
m
1 j
21
included are equal (maximum entropy) than if one alternative dominates (low entropy).” Thus, we apply a similar measure to measure the depth and breadth of a donor’s giving to multiple donation options. We argue that, compared to other possible measures such as average donation per initiative or number of initiatives chosen for donation, Donation Variety is a more
informative measure of how donors distribute their donations across multiple initiatives.
Intrinsic Motivators. To test H1 we need a variable (or set of variables) which represents the extent to which a donor has an intrinsic motivation to donate to multiple initiatives. We expect that a donor’s strength of ties to various initiatives of a nonprofit can act as a good indicator of a stronger tie and broad connectedness to the university. Sharing demographic characteristics has been shown as a good proxy for measuring the strength of a tie between two individuals
(Reagans 2005). Thus, we expect that variables which describe cases where alumni likely have multiple connections with different initiatives/departments of a university are good indicators of stronger and broader intrinsic ties to the university. Thus, we use two variables as indicators of the strength and breadth of ties across different initiatives/departments: (1) the number of
degrees the alumnus has with the university, and (2) having a spouse that also graduated from the university. We expect that these two variables are likely indicators of alumni that have had or shared broader experiences across the university. For example, donors with multiple degrees have often had different experiences across programs (e.g. Bachelors, Masters, PhD) or across schools (e.g. Arts & Sciences, Business, Medicine, Engineering, Law, etc.). We find that the alumni of the university have on average about 1.2 degrees from the university and about 30% are married to other alumni from the university.
22
external motivation for alumni to make donations comes from the marketing efforts which are initiated by the university foundation. These marketing efforts initiated by the university foundation include personal visits, phonathon calls, invitations to events, and direct mail/email solicitations. We expect that different types of marketing efforts are likely to have varying impacts on a donor’s decision to make a gift. For reasons of parsimony, we choose to group phonathon calls and direct mail/email as impersonal marketing efforts, since the message content used for these marketing efforts is homogenous across the donor population and less interactive. Further, we group personal visits and invitations to events as personal marketing efforts, since their content and experience is richer and more donor-specific (Venkatesan and Kumar 2004).
In our sample, on average, alumni receive about five times as many impersonal (0.49) vs. personal (0.09) marketing communications from the university per year. This is common, given the much higher cost of personal marketing communications. We note that the focal educational foundation follows a similar process when initiating any type of marketing communications to alumni. All alumni generally receive a communication from both the university and the general alumni association starting just prior to graduation. All communications, including informational newsletters, contain an appeal letter asking for a gift. These communications generally continue for several years post-graduation, regardless of whether a gift is given.When an initial gift is given, the alumnus can choose whether the gift is given to a specific initiative, multiple initiatives, or to an unrestricted fund.9 Once a gift is given, the initiative(s) supported often communicate regularly with the donor in the future asking for subsequent gifts to the same initiative(s) which were previously supported.
9
23
Gift Giving Behavior. To test H3 we need a variable which represents the outcome of the gift giving process. In this case, since we aggregate the data on an annual basis by fiscal year, we define gift giving as the total amount of donations by a given donor in a given year. We find that conditional on giving, the average gift amount is about $381. We also control for the recency effect of gift giving by including lag of donation amount in our analysis.
Macroeconomic Condition. To test H4 we need a variable which represents the macroeconomic conditions that the alumni are facing. Similar to many other studies in
marketing, we measure the overall macroeconomic condition as the cyclical component of GDP data after we apply a HP-filter (Hodrick and Prescott 1997) to remove the long-term trend component of GDP. Thus, the average macroeconomic condition in the sample is 0 and any deviation above (below) 0 suggests a positive (negative) macroeconomic climate.
Control Variables. In addition we include several control variables in our model. We include
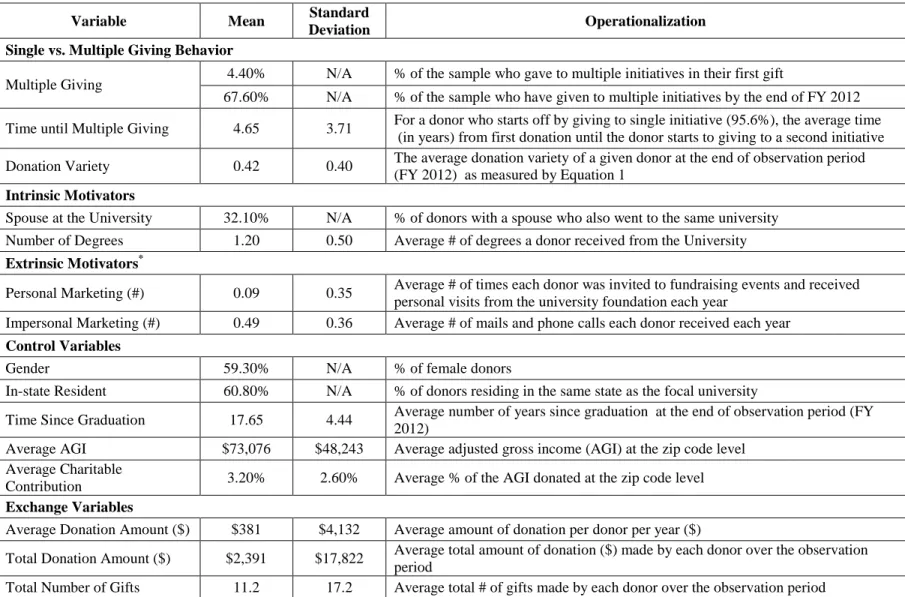
variables that try to capture the financial strength or capacity of giving of a given alumnus. First, we include the average household income and average charitable contribution at the zip-code level based on the donor’s residence. Second, we include time since graduation since the longer it has been since an alumnus graduated, the higher the likelihood that their earning power and assets are higher. Finally, we control for the amount of the previous gift. We also include some demographic variables to account for observed heterogeneity. These include gender and location (in-state vs. out-of-state). We provide a list of the variables, descriptive statistics, and description of the operationalization of each variable in Table 2.1 (See Table 2.1)
Model Development
24
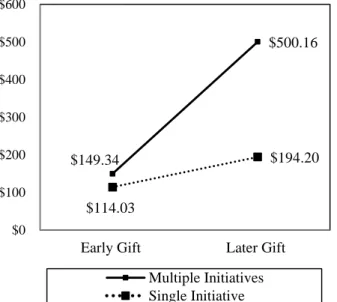
value. We use the same sample of 5,500 donors in the annual giving program of a public university which made their initial gift to a single initiative between fiscal year (FY) 1993 and FY 2003. We split the sample into two groups: (1) donors who began at some point to give to multiple initiatives (n = 3,720), and (2) donors that only give to a single initiative during the entire observation window (n = 1,780) through FY 2012. For the first group (labeled Multiple Initiatives), we split the data into the time period when the donors only gave to a single initiative and the time period after they began giving to multiple initiatives. We then determine the average gift amount for donors before ($149.34) and after ($500.16) giving to a second initiative. For the second group (labeled Single Initiative), we split the data into two time periods as well. Here, we treat the first five years as early gifts (as this is the average time that a donor in the first group waits before donating to multiple initiatives) and any time after five years as later gifts. We then determine the average gift amount for donors in the early ($114.03) and later ($194.20) time periods (See Figure 2.1).
First, we see that in both cases the average gifts in the early time period are lower than the average gifts in the later time periods, suggesting that, over time, there is an increase in average giving for all donors. However, we see that the increase in average gift amount for donors who give to multiple initiatives is significantly larger than the increase for the single-initiative donors ($270.65; p < 0.01). This provides some evidence that increases in Donation Variety lead to increases in giving amounts. However, it is also important to quantify the benefits of Donation Variety by controlling for as many other factors that may affect donations as possible. To do this we build an econometric model which can identify the antecedents and consequences of
25
Endogeneity of Marketing. To empirically test our hypotheses, we must first control for the endogeneity of marketing efforts, since nonprofit organizations usually do not send solicitations at random. Nonprofit organizations commonly focus their fundraising efforts on donors and prospects that have a higher likelihood of donation or belong to specific demographic segments. To address the issue of endogeneity with marketing efforts, we use instrumental variables and estimate the instrumental variable model for both personal and impersonal marketing efforts and use a control function approach (Petrin and Train 2010) to include marketing efforts (both personal and impersonal) into the next step of analysis, along with the computed error from the instrumental variable equations. The detailed discussion on instrumental variable model and estimations is provided in Appendix 2.B (See Appendix 2.B)
Methodology. In order to test hypotheses H1 and H2, we need a model that can help us understand what factors motivate a donor to increase donation variety over the donor's lifecycle. To accommodate both the acquisition and retention stages of donor relationship in the model, we use a binary variable (Firsti,t) to distinguish between initial and subsequent gifts, where Firsti,t = 1 when it is the initial gift of donor i at time t, and Firsti,t = 0 when it is a subsequent donation by a given donor i. For Firsti,t = 1, the interaction of Firsti,t with donor intrinsic motivators and
nonprofit-initiated marketing efforts help us to identify whether the impact of donors intrinsic and extrinsic motivators are strengthened or weakened across acquisition and retention stages.
26
variable. As noted, we do not observe a positive Donation Variety for all donors. In fact, most donors do not give to multiple initiatives in their initial gift (> 95% give to one initiative on their first gift), and some donors never actually give to multiple initiatives (about 33% never give to multiple initiatives). Therefore, our model needs to handle the partial observability of Donation Variety (i.e. it is censored at 0). To do this we estimate the following panel data model:
t i, i 1 t i, * i t
i, x β c μ
Variety
0 Variety if 0 0 Variety if Variety Variety * i t i, * i t i, * i t i, t
i, (2)
Where Varietyi,t is the Donation Variety for donor i up to time t as computed from Equation 1 (for t = 1, 2, …, T), Xit contains individual and time-varying explanatory variables such as
intrinsic and extrinsic motivators, lagged donation amount, lagged donation variety, and first year dummy and its interaction with both intrinsic and extrinsic motivators; ci and μi,t are individual-specific unobserved effect and normally distributed idiosyncratic error term. The limited dependent variable model is generally fitted using Tobit specification. One of the key limitations of Tobit specification is that the underlying process driving the probability of observing a positive value [P(
Variety
i,t>0|Xit)] and the actual value [E(Variety
i,t)|Variety
i,t>0, Xit)] are both driven by the same underlying process. We adopt a general class of modelspecification proposed by Cragg (1971) that integrates the Probit and truncated normal models:
1) it 1(d 0) it 1(d β)/σ Φ(X e σ γ)2π Φ(Z γ) Φ(Z 1 ) X , Z | Variety , f(d it 1 2 1 it it it it t i, it 2 /2σ 2 β) it X t i, (Variety (3) where 0 Variety if 0 0 Variety if 1 d t i, ti, . Unlike Tobit model specification, the Cragg model permits:
27
underlying process driving the two decisions could be different, whereas in Tobit model
𝛾 = 𝛽/𝛿. Please note that Tobit model is a special form of Cragg model in which 𝑍 = 𝑋 and
𝛾 = 𝛽/𝛿 . Thus, Cragg model is a more flexible alternative to Tobit model and it also has the
benefit of enhanced efficiency due to the simultaneous estimation of both stages. We estimate the Cragg model specification using a maximum likelihood-based Craggit procedure in STATA 13.1 (Burke 2009). We use clustered standard errors to account for autocorrelation and panel-specific heteroskedasticity.
Similarly, to test hypotheses H3 and H4 we need a model that can accommodate partial observability of the dependent variable, gift amount (i.e. we only observe a value for gift amount when a donation occurred). The model takes the following format:
t , i i 1 t , i * t
i, ) x c
Ln(Gift
0 ) Ln(Gift if 0 0 ) Ln(Gift if ) Ln(Gift ) Ln(Gift * t i, * t i, * t i, t
i, (4)
where ln(Gifti,t) is the log of the gift amount given by donor i at time t (for t = 1, 2, …, T), and Xit contains individual and time-varying explanatory variables such as lagged donation
amount, lagged donation variety, marketing efforts and donor’s intrinsic motivators; ci and μi,t are individual-specific unobserved effect and normally distributed idiosyncratic error term. We use the same maximum likelihood-based Craggit procedure (Burke 2009) to estimate the model in equation (5).
28 Results
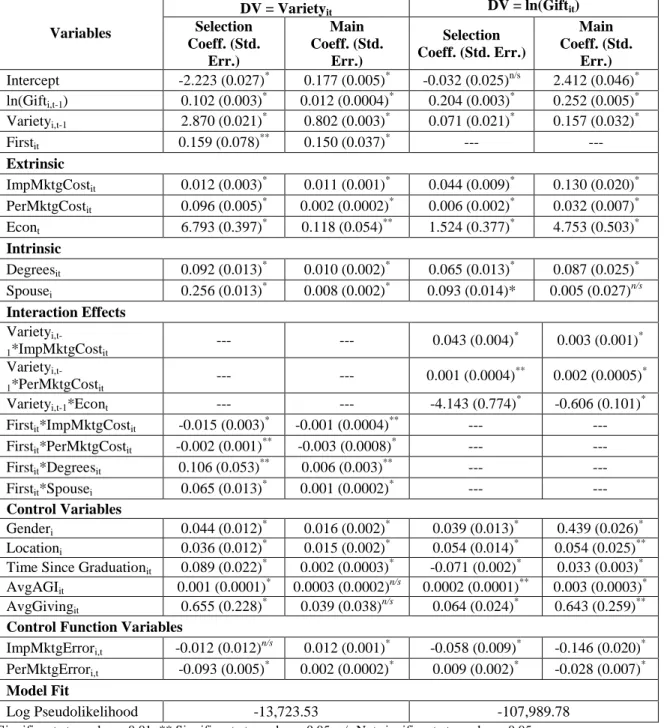
The results of estimation for Equations 3 and 5 are presented in Table 2.2. Both models have good fit and majority of coefficients are statistically significant. However, interpretation of coefficients in the Cragg model can be precarious, as the effect of an independent variable can vary in magnitude as well as direction across the Probit model and the truncated normal regression. The problem of interpretation of coefficients associated with interaction effects in non-linear models is even more complicated (Ai and Norton 2003). Thus to empirically test the hypotheses, we calculate the unconditional expected value of the dependent variables (i.e. Donation Variety and donation amount) at each time t. We can then compare the mean of the predicted values across the different groups we want to test (See Table 2.2)
To interpret the effect of intrinsic and extrinsic motivators on driving Donation Variety, we estimate the expected Donation Variety at different levels of intrinsic and extrinsic variables for both acquisition (first gift) and retention (repeat gift) stages of donor-nonprofit relationship. Estimations are presented in Figure 2a to 2d. Figure 2a and 2b present the interaction effect of intrinsic motivators and first donation indicator. These figures show that a donor’s multiple ties to the nonprofit are more influential on driving Donation Variety at the initial stage of the donor-nonprofit relationship than the retention stage. For first gift, donors who have multiple degrees from the university (Figure 2a) and donors whose spouse are also university alumni (Figure 2b) are more likely to have a higher Donation Variety than donors who have fewer different ties to the university. However, we also notice that in the retention phase the donor’s intrinsic
29
more influential in driving Donation Variety at the retention stage than the acquisition stage. For first gift, marketing seems to play small role in encouraging donors to give to increase Donation Variety. However for repeat gifts, donors who receive more marketing efforts from the university foundation have higher expected Donation Variety on average as compared to donors who
receive fewer marketing efforts.
In order to estimate the direct and moderating effect of Donation Variety on gift amount, we predict the expected gift amount given different levels of Donation Variety. For donors who give to only one initiative, Donation Variety is 0 (no variety). For donors who give to multiple
initiatives, we use median split to group them as donors with a low level of Donation Variety (0 < Donation Variety < 0.64) and with a high level of Donation Variety (Donation Variety >= 0.64). To test the direct effect of Donation Variety on gift amount, we compare the difference in average expected gift amount across donors with low and high levels of Donation Variety. The average expected gift size is $115.62 for donors who give to only one initiative. The average expected gift amount for donors with low and high levels of Donation Variety is $394.76 and $795.80, respectively. These results indicate a significant and positive direct effect of Donation Variety on gift amount.
30
foundation.10 However, the decrease in financial support is much greater for donors who give to a single initiative than donors who give to multiple initiatives.
While we do not formally hypothesize the moderating effect of Donation Variety on marketing efforts, we still include the interaction between the two marketing variables and Donation Variety to control for the potential impact of marketing efforts by the university foundation. We want to see whether there is some evidence that donors with different levels of Donation Variety tend to respond differently to marketing efforts (both impersonal and personal)
by the university foundation (See Figure 2.3b and 2.3c). Figure 2.3b shows the interaction of Donation Variety and impersonal marketing costs. As it is shown, donors who receive more
impersonal marketing efforts make larger gifts as compared to donors who receive fewer impersonal marketing efforts. The difference in average gift size for the two groups becomes larger as donors give to a more varied portfolio of initiatives. Figure 2.3c shows the interaction effect of Donation Variety and personal marketing effort. Given that the majority of donors receive no personal marketing effort, we split donors into two groups: donors who receive no personal marketing, and donors who receive some personal marketing. Figure 2.3c shows that personal marketing effort is mostly targeted at high-value donors. However, we can see that the difference in average gift size for donors who receive some marketing and donors who receive no marketing becomes much larger for donors with higher levels of Donation Variety.
10
31
Comparing Donation Variety with Breadth and Depth of Donations
Further, we want to see whether our proposed measure of Donation Variety (see Equation 1) outperforms measures commonly used to represent the depth and breadth of a customer or donor’s relationship with an organization (e.g. Crossbuy and Depth of Buying). In this case, we created 2 variables which represent the depth and breadth of giving: the total number of
initiatives supported by donor i up to time t-1 (breadth of giving) and the accumulated amount of gifts by donor i up to time t-1 (depth of giving).We called these two measures cross-donation and total donation. First, we measured the correlation of the Donation Variety with these other two measures. The correlation of Donation Variety with number of initiatives supported (breadth) and cumulative gift amount (depth) are 0.762 and 0.307 respectively.
This suggests that these variables seem to represent the same construct measuring the depth and breadth in relationship a donor has with a nonprofit organization. However, when we only compare the cases where the Donation Variety is positive (i.e. giving to multiple initiatives), the correlations with number of initiatives supported and cumulative gift amount are 0.604 and 0.034 respectively. This seems to suggest that, as the distribution of support to each initiative varies, the measure of Donation Variety we use in this study begins to capture subtle differences from the separate measures of the number of cross-donation and depth of donation.
32
MAD and MAPE of the expected donation value for all donors in all time periods in the observation window. We find the in-sample MAD (MAPE) for the Donation Variety model is $60.11 (17.27%) and for the cross-donation and total donation model is $70.97 (18.38%). This suggests that the model with a single measure of Donation Variety captures more of the variation in expected donation amounts than the model with separate variables representing the breadth (cross-donation) and depth (total donations) of donations. Next, we test the out-of-sample fit of the model. To do this, we used the coefficients from the models to select the ‘best’ donors based on the predicted expected donation in FY 2013, given the original observation window of the data is to the end of FY 2012. We then see if the foundation is better off selecting the top percentiles of donors (10%, 15%, and 25%) based on expected donation from the Donation Variety or cross-donation and total donation models (See Table 2.3).
We see from Table 2.3 that, whether the foundation selects the top 10%, 15%, or 25% of donors based on the expected giving amount predicted by the two different models, that the model using Donation Variety helps the university foundation select donors with higher giving amounts in FY 2013 by 6.7%, 6.2%, and 5.4% respectively. All of these results suggest that using the proposed measure of Donation Variety is more valuable than the traditional (and separate) measures of breadth (cross-donation) and depth (total donation), as Donation Variety is a single measure (rather than two independent measures) that captures both the breadth and distribution of depth of donations made to a nonprofit organization.
Discussion
33
motivations (marketing efforts) are more (less) effective at driving donors to give to multiple initiatives and increasing Donation Variety, confirming hypothesis H1 (H2). This suggests that at the acquisition phase, nonprofit organizations should look for donors with the ‘right’ donor profile (i.e. characteristics that match donors with higher Donation Variety) to acquire donors with the highest probability of giving to multiple initiatives in their initial gift. At the retention phase, nonprofit organizations seem to have more influence in getting donors to give to multiple initiatives and increase Donation Variety. This suggests that any initiative by the nonprofit organization to influence Donation Variety will likely be more effective if applied to donors who have already made gifts (retention) rather than donors who have yet to make a gift (acquisition).
In regard to the effect of a donor’s decision to distribute her gifts across multiple initiatives on the donor’s future value, we found donors who give to a more varied profile of initiatives in the past to be willing to donate more in the future, confirming H3. Level of Donation Variety has a significant positive effect on probability of donation. The average amount of a gift when a donation is made is also almost twice as large for donors who distribute their past donations across more initiatives evenly. We also find that Donation Variety has significant moderating impact on the effect of macroeconomic condition on a donor’s giving. We found donors with a higher degree of Donation Variety are far less affected by the bad economy and their support drops by only 1.84%. In contrast, donors who give to a single initiative, decrease their support by 87.5% as economic conditions significantly decline, confirming H4. Thus, encouraging donors to distribute their support across more initiatives can help nonprofit organizations retain their
34
To validate our empirical finding, we run a field study with the focal university foundation of the empirical study to test whether the university foundation can use targeted marketing efforts to influence current donors to increase Donation Variety.
Study 2: Field Study
Given that we find that donors with a higher Donation Variety are more valuable to the university foundation than donors with a lower Donation Variety, we propose a field study to determine the extent to which efforts by the university foundation can be targeted at donors to encourage giving across multiple initiatives. The main benefit of running this field study is two-fold. First, a field study offers strong causal evidence that nonprofit firms can actually motivate single initiative donors to increase their depth and breadth of giving. Second, it can provide a general framework for other nonprofit foundations to motivate donors to increase Donation Variety. In our field study, we manipulate the content of direct mail and email appeals from the focal university foundation to motivate single initiative donors to give to multiple initiatives and to motivate donors of multiple initiatives to further increase the number of initiatives supported.
Objective and Setup
Email and direct mail solicitations at this university foundation often ask donors to repeat their donation to the initiative(s) they have supported previously. We want to test whether
35 Method
The field study includes a stratified random sample of 1,200 alumni from the focal university who all graduated with a degree from the business school (undergraduate, MBA, and/or Ph.D.), made at least one donation in fiscal year (FY) 2012, and, as of January 2013, had yet to donate in FY 2013. We took a stratified random sample of donors which fell into one of four groups that include donors who had given: (1) only to the business school in the past (no Donation Variety; n=200), (2) to multiple initiatives including the business school in the past (positive Donation Variety; n=200), (3) only to one other initiative in the past, not including the business school (no
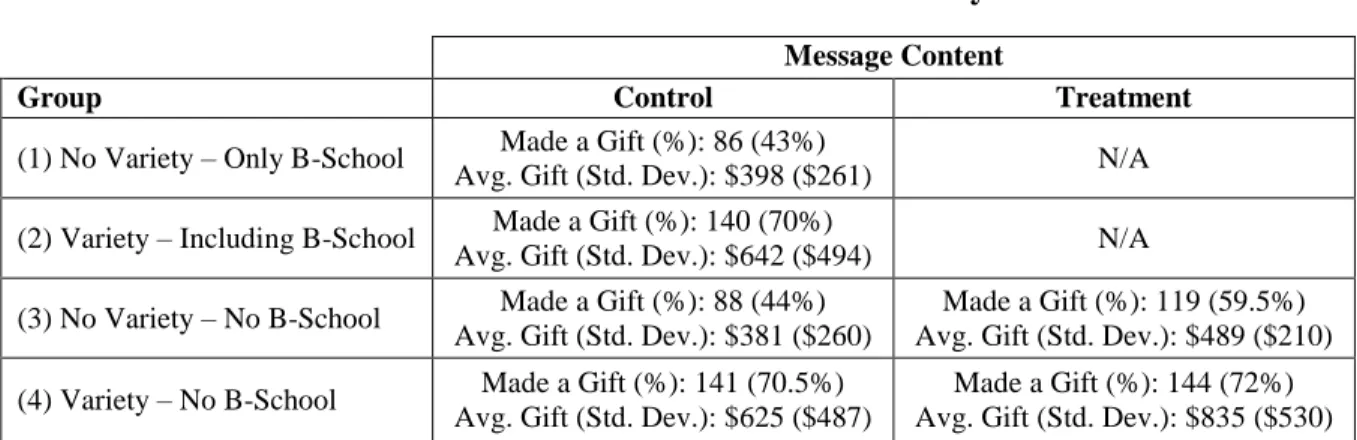
Donation Variety; n=400), and (4) to multiple initiatives in the past, not including the business school (positive Donation Variety; n=400). We use these four groups so that we can differentiate between the effect of encouraging an alumnus to increase Donation Variety and give to schools other than the one they graduated from and the effect of encouraging an alumnus to donate to the school in which they graduated. We try to control for the latter by choosing a set of donors who all graduated with a degree from the same school. Before we ran the study, we wanted to confirm whether our stratified random samples were not significantly different from each other. To do this, we provide some descriptive statistics for each of the four groups (See Table 2.4).
36
initiatives, whether it included (or did not include) the business school in the past, are not different in their donation behaviors over time.
For the field study, we treated each of the 200 donors from the two groups (1 and 2) who had given to the business school in the past as one set of controls by only targeting them with appeal letters which asked them to consider giving again to the same initiatives they had supported in the past, including the business school (i.e. the usual appeal all alumni from the focal university receive). We then randomly split the two groups (3 and 4) who had not yet given to the business school in the past into two groups of 200 each for each group. One half of each group (n = 200) received the control message asking them to consider giving again to the same initiatives they had supported in the past (not including the business school). Again, this is the usual appeal that each donor who gives the previous FY receives. The other half of each group received the treatment message asking them to consider giving to the same initiatives they had considered in the past and to also consider giving to the school where they had received their degree (i.e. the business school) as well. Thus, the only difference between the control and treated message was the addition of language which asked the donor to consider giving some money to the business school as well as the other initiative(s) that donor had supported in the past.
The study was run during the second half of FY 2013 (six months from January 1 to June 30, 2013). Initial emails and direct mails were sent to participants in January, and each donor
received one email and one direct mail. A follow-up email and direct mail was sent in the
37 Results
To determine whether the field study was successful, we first want to determine whether donors who have already given to the business school in the past are similar in their giving patterns to donors who have yet to give to the business school. To do this, we compare the results for the control Groups 1 and 3 (no Donation Variety) and for the treated Groups 2 and 4 (positive Donation Variety). For Groups 1 and 3, we see that, out of the 200 donors contacted for each
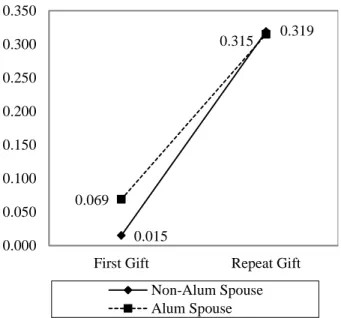
group with the control message, 86 and 88 donors respectively, responded positively with a donation (See Table 2.5 for detailed results). Further, we see that the average gift amount for Group 1 was $398 and for Group 3 was $381, which is not statistically significantly different (t = 0.65; p = 0.51). For Groups 2 and 4, we see that, out of the 200 donors contacted for each group with the control message, 140 and 141 donors respectively, responded positively with a donation. We also see that the average gift amount for Group 2 was $642 and for Group 4 was $625, which is not statistically significantly different (t = 0.35; p = 0.73). This suggests that any difference between the treatment and control groups for Groups 3 and 4 should be as a result of the change in marketing content and not from a donor’s different giving histories.
38
donor to consider the business school as an initiative to support led to an increase from 141 to 144 gifts, a 2% increase in repeat giving, and an increase in the average gift size from $625 to $835, a 33% increase in donation size (t = 4.13; p < 0.01). Further, we saw an increase in Donation Variety from 0.573 to 0.661.
Discussion
39
Implications to Marketing Theory and Practice
Theoretical Implications
This study empirically tests the effect of the distribution of gifts across multiple initiatives of a non-profit, i.e., Donation Variety, on a donor’s future value to the nonprofit and identifies factors that increase Donation Variety. The results of this study have several implications to marketing theory. First, we find that the amount and distribution of gifts across multiple donation options (measure of Donation Variety) is a good predictor of future donation behavior. We show that donors with a higher level of Donation Variety of their past gifts are more likely to give in the future and, conditional on the gift being made, are likely to give more than donors with a lower degree of Donation Variety. This offers some empirical validation to the literature on social impact theory and donor-nonprofit relationship management. In other words, donors who are more broadly tied to the nonprofit organization through multiple connections with various causes are more likely to stay engaged through subsequent gifts versus donors who may have given the same amount over time, but are more narrowly tied with fewer or even just one
initiative. Further, we found empirical evidence that Donation Variety can also change a donor’s responsiveness to the changes in macroeconomic environment. We find that donors with a higher degree of Donation Variety are less responsive to negative changes in the macroeconomic
condition, making them less risky, as their donation patterns have lower volatility with external shocks. Besides, we tested the interaction effect between marketing efforts and Donation
Variety. We found that donors with a higher Donation Variety are more responsive to marketing
40
evidence that nonprofits can increase their return on marketing investments (ROMI) by focusing their marketing efforts on donors with a higher level of Donation Variety.
Second, we find that our measure of Donation Variety is better able to capture the variation in donation amount and better predict the expected donation amount (both in-sample and out-of-sample) than a measure of the number of initiatives supported and total of gift amount. This contributes to the literature on measurements of the depth and breadth of customer relationships. Further, it suggests that measures such as crossbuy (i.e. number of product categories purchase) commonly used in the CRM literature to measure the breadth of a relationship, could be
enhanced by simultaneously capturing the depth of the relationship in each category purchased as a single measure (i.e. Purchase Variety).
Third, this study empirically shows that factors that drive Donation Variety systematically change over the course of the relationship between the donor and a nonprofit organization. We find that at the acquisition stage, donor intrinsic motivations (marketing efforts) are more (less) effective at driving donors to give to multiple initiatives at the acquisition stage rather than the retention stage. This is an important contribution to the literature on donation behavior, as studies to this point have not distinguished the changes in a donor’s responsiveness to marketing efforts over the course of the donor-nonprofit organization relationship. In all, these findings suggest that measuring and understanding the distribution of gifts across multiple donation options is important when trying to understand a donor’s motivation to make initial and subsequent gifts to nonprofit organizations.
Managerial Implications