Mixed ordered termination at the
SrTiO
3
surface
THESIS
submitted in partial fulfillment of the requirements for the degree of
BACHELOR OF SCIENCE in
PHYSICS AND ASTRONOMY
Author : L.J. Prins
Student ID : 1224921
Supervisor : Jan Aarts
2ndsupervisor : Koen Kuijken
Mixed ordered termination at the
SrTiO
3
surface
L.J. Prins
Huygens-Kamerlingh Onnes Laboratory, Leiden University P.O. Box 9500, 2300 RA Leiden, The Netherlands
July 14, 2017
Abstract
Even though both strontium titanate and lanthanum aluminate are insulators, the interface between them is conducting. This is only the case, however, when the terminated layer of the SrTiO3film or
crystal is TiO2. Because of this, the surface structure of strontium titanate has recently become an active area of research. Here we
show a mixed ordered termination can be achieved by a simple annealing process. Furthermore, we show that the new PLD installation in the ESCHER is capable of layer-by-layer ordered growth of LaAlO3on SrTiO3. We investigate this surface layer by Low Energy Electron Microscopy (LEEM). The surface of a mixed ordered terminated sample has been studied both before and after
growth of lanthanum aluminate. Pulsed laser deposition at the ESCHER provides exciting new opportunities for research on the
Contents
1 Introduction 7
2 Background 9
2.1 Strontium Titanate 9
2.2 The STO/LAO interface 9
3 Methods 11
3.1 LEEM 11
3.1.1 Experimental setup 11
3.1.2 Imaging modes 11
3.1.3 Pulsed Laser Deposition 15
3.2 Atomic Force Microscopy 15
3.3 Sample Production 16
4 Results 17
4.1 STO surface properties 17
4.2 Pulsed Laser Deposition on mixed terminated STO 25 4.2.1 Deposition on single terminated STO 25 4.2.2 Deposition on mixed ordered terminated STO 26
4.3 Conductance at the STO/LAO interface 29
5 Discussion 33
5.1 STO surface properties 33
5.2 Growth of LaAlO3on SrTiO3 34
5.3 Interface conductance 34
6 Conclusion 35
6 CONTENTS
Chapter
1
Introduction
In this thesis we study the mixed ordered termination of strontium titanate (STO) and the growth of lanthanum aluminate (LAO) on the mixed ordered STO termination. The STO-LAO interface is of interest mainly because of the two dimensional electron gas that forms on this interface. This electron gas is conductive even though both STO and LAO are band insulators. It has applications mainly in semiconductor interfaces.
The next chapter provides some general background on STO and the interface with LAO. After this, we look at the methods used to study these subjects. The main instruments used are AFM topography and the ESCHER, a world-leading Low Energy Electron Microscope (LEEM). A pulsed laser deposition setup has recently been added to the ESCHER to performin-situstudy of the growth of LAO on STO.
We then continue to the results, studying the surface properties of STO, the growth of LAO on mixed ordered STO and the conductivity of an STO/LAO sample produced in the ESCHER.
Chapter
2
Background
In this chapter, we look at some general background on strontium titanate and the strontium titanate-lanthanum aluminate interface.
2.1
Strontium Titanate
Strontium titanate is a perovskite oxide. This means it has a layered lat-tice, consisting of layers of SrO and TiO2. At the surface, the substrate can be terminated by either a strontium oxide or a titanium oxide layer. Commercially available substrates always consist of a mixture of strontium and titanium termination. However, this mixed termination is not ordered: there are no large scale areas consisting solely of strontium or titanium termination.
We can also produce ordered terminations: this means there are struc-tures which are solely titanium terminated or solely strontium terminated. The simplest and most easily achievable of these is a singly titanium termi-nated surface. More interesting is a mixed ordered termination. In such a case, there are relatively large scale (10 to 100 nm) structures that are solely strontium terminated, as well as titanium terminated structures. Such surface structures can be realized using an annealing process.[1]
2.2
The STO/LAO interface
10 Background
• The STO is singly terminated by TiO2.
• The LAO layer has a thickness of at least 4 unit cells.
Furthermore, the conducting interface can only form if the LAO is deposited by pulsed laser deposition or by molecular beam epitaxy. Sputtering of the LAO on the STO is not able to provide a conducting interface.[3]
Chapter
3
Methods
3.1
LEEM
This section provides an introduction to LEEM imaging in general and in particular the ESCHER setup used at Leiden University. It gives an overview of the experimental setup and the main advantages of the tech-nique.
3.1.1
Experimental setup
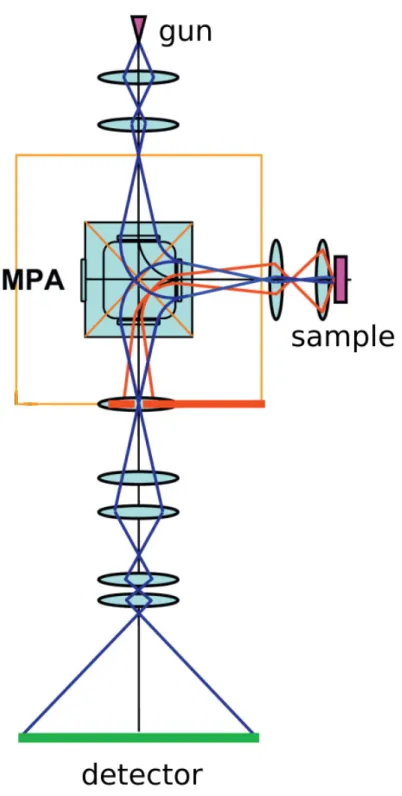
Figure 3.1 shows a basic LEEM setup. Electrons are emitted from the electron gun at a potential of 15 kV. They are then focused by lenses and deflected through a magnetic prism array. The beam is sent to the sample, which is held at a tunable potential close to that of the electron gun. This decelerates the electrons and makes them interact with the sample at low energies of about 0 to 100 eV. The electrons are then accelerated to the prism and deflected to the imaging optics. A more complete overview of the ESCHER setup can be found in the papers by Trompet al. [4, 5].
3.1.2
Imaging modes
12 Methods
3.1 LEEM 13
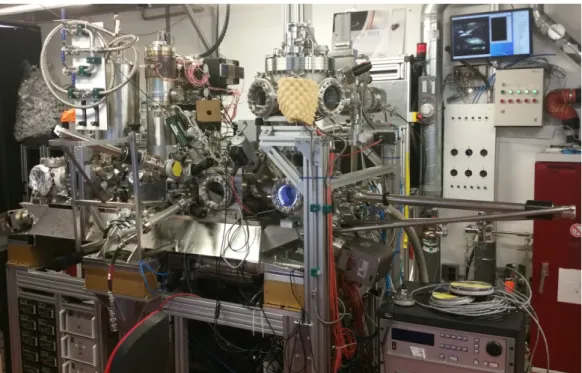
Figure 3.2:A photograph of the ESCHER as located in the measurement hall. Not shown are the power supply rack and the computers used for control.
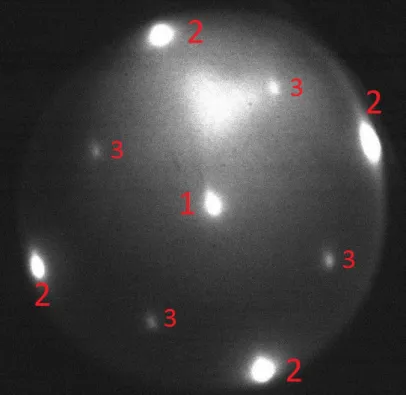
Another imaging mode is Low Energy Electron Diffraction (LEED), where we make reciprocal space images. This enables us to analyse the crystal structure of the sample. Surface reconstructions show up as ad-ditional spots in the diffraction pattern, besides the simple 1x1 spots. A typical LEED image is shown in figure 3.3, with numbers to mark the dif-ferent types of spots. SrTiO3has a cubic structure, which means for LEED that we see the spots in a square pattern. In the middle with the number 1, we see the intense centre spot. The spots numbered 2, on the outside, are the 1x1 diffraction spots. The spots with the number 3 correspond to a surface reconstruction. In this case, they indicate our sample has a c(2x2) reconstruction. We can identify the exact reconstruction the spots belong to by inspecting their position relative to the centre and 1x1 spots. The blurry spot between the centre spot and the top 1x1 spot corresponds to electrons which have interacted with the sample multiple times. This spot is displaced from the center by the dispersion of the prism.
14 Methods
Figure 3.3: A diffraction pattern of an STO sample. The numbers indicate the
3.2 Atomic Force Microscopy 15
can also place a contrast aperture over one of the spots belonging to a reconstruction. This way, we can see exactly which parts of the sample form this reconstruction. This is called dark-field imaging.
We can also do PEEM imaging, which stands for Photoemission Electron Microscopy. In PEEM, we illuminate the sample with a UV-lamp and image the electrons emitted as a result of this light. In this research, we use it mostly to align the optics and to inspect the large-scale structure of the sample. This way we can easily see dirty parts of our sample, as well as any markers we may have placed.
3.1.3
Pulsed Laser Deposition
To produce a conducting layer at the LAO/STO interface, the use of Pulsed Laser Deposition(PLD) is necessary. In PLD, a high power laser is used to vaporize a target. The target then emits a plasma plume which deposits material of the target on the substrate. The physics involved in this are very complex, but local oxygen pressure is very important for proper growth. This is especially important for LAO/STO because of the important role of oxygen defects in the conductivity.
3.2
Atomic Force Microscopy
Although LEEM is very sensitive to the sample surface, it does not give any direct information about the topography of the sample. A topographic map is a very reliable way of measuring (changes in) the surface termination. To produce such a map, we use Atomic Force Microscopy (AFM).
In standard AFM measurement, a very sharp tip is pushed on the surface of a sample. By measuring the deflection of the tip as a function of the position, we can make a map z = f(x,y). This technique, called ‘contact mode’, has several disadvantages. If there are large structures on the surface, high lateral forces can damage the tip. We can also damage the surface if we apply too much force with the tip. To avoid these problems, we can use ‘tapping mode’. In this mode, we let the tip oscillate near its resonant frequency close to the sample. The sample surface will exert van der Waals forces on the tip, changing the resonant frequency. Using a feedback system, the oscillation frequency is kept constant. The resonance frequency f changes according to:
16 Methods
wherecis the spring constant of the cantilever andF0is the gradient of the van der Waals forces. This means that a constant frequency of oscillation corresponds to a constant force gradient.[6]
3.3
Sample Production
The simplest method to obtain a well-defined STO surface is chemical etching in a buffered HF solution. The exact procedure can be found in the appendix, but the main idea of this method is that the strontium at the surface is preferentially removed by the HF. This leaves an STO sample that is singly titanium oxide terminated.
Chapter
4
Results
4.1
STO surface properties
We can produce mixed ordered terminated STO by annealing a sample in air at 1300◦C [1]. The precise ratio of SrO to TiO2can be controlled by adjusting the annealing time. Using AFM imaging, we can inspect the topography of such samples. In case of mixed termination, we should see steps of 0.5 unit cell height. Because the lattice parameter of SrTiO3is about 0.4 nm, we expect to see steps of about 0.2 nm for mixed ordered termination.
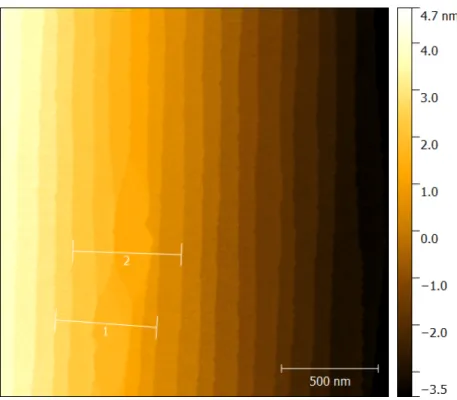
Figure 4.1 shows an AFM image of an STO sample after 12 hours of annealing at 1300◦C. The height profiles along the given lines are shown in figure 4.2. From these profiles we can deduce that the large ‘islands’ are differently terminated from the smaller terraces. For both profiles, we start with two atomically flat terraces, with a step size of 0.4 nm. After this we reach an island, giving us a step of 0.6 nm or 1.5 unit cells. After this we get another 0.6 nm step, confirming that the terraces and the island have different surface terminations. Note that for this sample we see only 1.5 unit cell steps and no 0.5 unit cell steps.
Figure 4.3 shows a LEEM bright-field image of the same sample. There is a clear contrast between the smaller terraces and the large islands. Looking more closely, we can also see step contrast in between the terraces. This shows mixed terminated STO samples can be produced reliably by the annealing process.
18 Results
Figure 4.1: AFM topography map of an STO sample annealed for 12 hours at
1300◦C. Two profiles are taken along the shown profile lines.
0.0 0.1 0.2 0.3 0.4 0.5
x (µm)
0.0 0.5 1.0 1.5 2.0 2.5
height (nm)
Profile 1 Profile 2
Figure 4.2: Profiles along the lines shown in figure 4.1. We can see 1 and 1.5 uc
4.1 STO surface properties 19
Figure 4.3: LEEM bright-field image of an STO sample annealed for 12 hours
at1300◦C. The small dark spots are a result of remaining electron beam resist.
Field of view is3.5 µmx2.8 µm. Clearly visible are large, dark islands, as well
as the smaller step structure. The large islands have a strontium oxide termina-tion, the other parts of the sample (showing step contrast) have a titanium oxide termination.
(a)Topography map (b)Phase map
Figure 4.4:Topography and phase images of an STO sample first HF-etched and
20 Results
Figure 4.5:Profile of the sample along the line shown in figure 4.4a. The different step sizes indicate a mixed termination.
Literature indicates that we should also obtain a mixed termination for chemically etched samples, but the effect of this etching before annealing is not entirely clear[1].
Figure 4.4 shows topography and phase maps of a chemically etched and subsequently annealed sample. Figure 4.5 shows the profile along the line in figure 4.4a. The profile contains both single and half unit cell steps, indicating a mixed termination of the sample. This is confirmed by the contrast in the phase map. The AFM images show little difference between etched and unetched samples after annealing.
Figure 4.6 shows a LEEM bright-field image of the sample. The image shows the atomic steps as well as a very large island with the same contrast as in figure 4.3. These very large structures can be seen all over the sample. On the sample that was not etched, no islands of comparable size can be found.
The etching should only influence the amount of SrO at the surface before annealing. These results seem to indicate that the strontium termina-tion grows preferentially from small spots of strontium already available at the surface. This would explain the larger size of the islands in HF-etched samples, since there would be fewer spots from which the islands can grow.
sam-4.1 STO surface properties 21
Figure 4.6: LEEM bright-field image of an STO sample HF-etched and then
an-nealed at1300◦Cfor 12 hours. The field of view is3.5 µmx2.8 µm. We can see
several smaller islands, as well as one very large island. The step structure is visible and the islands are aligned with this step structure.
(a)Topography map (b)Phase map
Figure 4.7:Topography and phase images of an STO sample annealed for 24 hours
22 Results
0.0 0.1 0.2 0.3 0.4 0.5
x (µm)
0.0 0.5 1.0 1.5 2.0 2.5 3.0 3.5 4.0 4.5 height (nm) Profile 1 Profile 2
Figure 4.8: Profile along the lines shown in figure 4.7a. The differing step sizes indicate mixed termination of the surface.
ple annealed for 24 hours, again at 1300◦C. The profile lines show that the sample is mixed terminated, but we can not easily see the different terminations in the topography map. More contrast is visible in the phase map, figure 4.7b. The phase contrast indicates mixed termination, but there is no clear difference in structure between the two terminations.
In comparison with both of the samples annealed for 12 hours, the 24 hour sample shows a very different structure. The step edges are less regular and more jagged. We can also see this structure in LEEM imaging, as shown in figure 4.9. Again, there is a clear contrast between terminations, but no clear difference in structure. There seems to be a major structural transition when annealing for more than 12 hours.
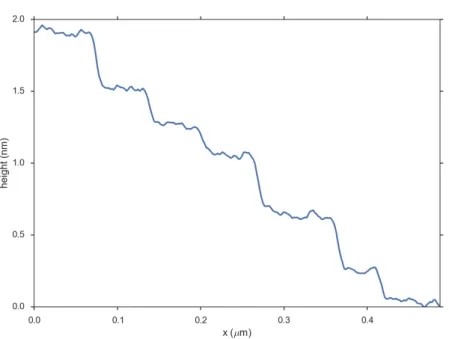
As shown in figure 4.10, annealing even longer produces a similar jagged structure, but the profile indicates single termination. The surface is now fully SrO terminated.
4.1 STO surface properties 23
Figure 4.9: LEEM bright-field image of an STO sample annealed at1300◦Cfor
24 hours. Field of view is3.5 µmx2.8 µm. The AFM profiles of figure 4.8 signify
a mixed ordered termination. There is however no indication which parts are Titanium and which are Strontium terminated.
(a)Topography map
0.0 0.2 0.4 0.6 0.8 1.0 1.2 1.4 1.6 x (µm)
0.0 0.5 1.0 1.5 2.0 2.5 3.0 3.5
height (nm)
(b)Profile along line shown in (a)
Figure 4.10: Topography map and profile of a sample annealed for 72 hours at
24 Results
Figure 4.11:LEED pattern of a sample HF-etched and annealed at1300◦Cfor 12 hours. The bright spots close to the centre spot correspond to two rotations of a √
13×√13R33.7◦reconstruction. Vaguely visible are the spots corresponding to
a2×2reconstruction. Circles correspond to the position of the aperture used in
4.2 Pulsed Laser Deposition on mixed terminated STO 25
(a)Multi-dark-field image (b)Bright-field image
Figure 4.12: Dark- and bright-field images of HF-etched STO subsequently
an-nealed for 12 hours at1300◦C. The dark-field image is colour-coded: every colour
corresponds to a single diffraction spot, as indicated in figure 4.11.
RT13 rotations.
4.2
Pulsed Laser Deposition on mixed terminated
STO
The previous section showed a reliable way of producing samples with large structures of mixed strontium and titanium oxide termination. These large structures allow us to follow the mixed terminations even if we lose some contrast or intensity during the pulsed laser deposition.
4.2.1
Deposition on single terminated STO
However, we should first take a step back and investigate deposition on singly-terminated samples. Although not the main focus of this research, re-sults on singly (titanium oxide) terminated samples provide a well-defined control measurement.
26 Results
0 1000 2000 3000
PLD pulses 0 10 20 30 40 FWHM (px)
Figure 4.13:Full width half maximum of the centre LEED spot as a function of the
number of pulses for growth of LaAlO3on titanium-terminated SrTiO3. The thin
vertical lines are placed at the minima, corresponding to growth of exactly one unit cell.
Therefore, growth of a full LAO monolayer corresponds to a minimum in the FWHM graph.
For the sample of figure 4.13, a total of 8 unit cells were grown on top of the substrate. Such a graph generally shows high peaks during the growth of the third monolayer. The exact cause of this effect is unknown.
The intensity of the centre spot sharply drops after the first few PLD pulses. This is likely due to the differing surface properties and reflective intensity of the LAO and is consistent with RHEED analysis. [7] Even accounting for this decrease in intensity, visible step contrast decreases steadily over the growth process.
4.2.2
Deposition on mixed ordered terminated STO
4.2 Pulsed Laser Deposition on mixed terminated STO 27
Figure 4.14: Two superimposed images of an STO sample annealed for 12 hours
at1300◦C. The field of view is5.7 µmx4.6 µm. The image in red was taken before
starting deposition, the image in green was taken after 4 monolayers had been grown. Step contrast is visible in both images and the step edges have not moved during the growth process.
during the growth of a monolayer. The maxima seen in figure 4.13 indicate there is significant disorder, i.e. that the coherence domains are small.
Figure 4.14 shows two superimposed LEEM images of an STO sample which was annealed for 12 hours at 1300◦C, but not etched with HF. The image in red was taken before growth. The image in green was taken after 4 unit cells of growth, as indicated by the FWHM graph. The dark spot in the lower right corner, probably dust, was used to align the two images. The yellow part of the figure indicates the overlap between the two images. As we can see, the steps have not moved. There is very little difference between the two images. The growth does not move the step edges or disrupt the surface structure.
28 Results
Figure 4.15:Phase image of an STO sample HF-etched and then annealed for 12
hours at1300◦C. The difference in phase between the terraces and the islands is
indicative of a different surface termination.
termination after LAO growth. If the amount of unit cells grown is an exact integer, the sample topography will still have the 0.5 or 1.5 unit cell steps between areas of different termination.
Figures 4.16 and 4.15 show AFM phase and topography images of an STO sample HF-etched and then annealed for 12 hours at 1300◦C. This is the same sample as in figure 4.12. The two images clearly show a mixed-ordered termination. The islands have 0.5 unit cell steps from the regular structures. From this and the reconstructions of figure 4.11, we can conclude that the islands are strontium terminated and the terraces are titanium terminated.
Figure 4.17 shows dark-field images color-coded as in figure 4.11. We again see the 2×2 reconstruction on the islands and domains of the√13× √
13R33.7◦ reconstruction on the terraces. The first image is before any pulses. All the contrast between the two rotations is lost after 30 pulses, corresponding to little more than one-tenth of a monolayer. After these 30 pulses, the only contrast left is between the terraces and the island. It is not clear whether this is due to reduced intensity and the limited resolution of the LEEM or due to a reordering of those two domains.
4.3 Conductance at the STO/LAO interface 29
Figure 4.16: Heavily cropped topography map of one of the islands seen in figure 4.15. The three different height values visible show that the island has a different termination from the two terraces beside it.
terrace and the island have the same termination. Therefore, the amount of LAO grown on top of either the island or the terraces was not an exact integer, i.e. the terrace and the island have ‘fused’ together.
4.3
Conductance at the STO/LAO interface
The aspect that has generated most interest in the STO/LAO interface is the existence of a conducting two-dimensional electron gas (2DEG) at this interface. This conducting interface only forms on titanium oxide terminated STO with at least 4 layers of LAO grown on top. Furthermore, the electrical properties of the interface are also critically dependent on the oxygen pressure at which the growth was performed.
However, there are several practical difficulties in measuring the con-ductance. Because the conductance only occurs below the surface, we require some way of contacting the interface layer. If the contact to the interface is not Ohmic, a resistance measurement will not be reliable.
30 Results
Figure 4.17: Dark-field images color-coded as indicated in figure 4.11. The first image is before growth and every subsequent image is after 5 PLD pulses. One monolayer is grown after about 250 pulses, so that the last image corresponds
to 30 pulses or about one tenth of a monolayer. Contrast between the two√13
4.3 Conductance at the STO/LAO interface 31
Figure 4.18: Topography map of the sample of figures 4.15 and 4.16 after 6 unit cells of LAO growth on a different spot of the sample. There is no clear height difference between the middle terrace (profile 1) and the island.
32 Results 7. 5 Ω SRLQWUHVLVWDQFHRIDXF/$2672VDPSOH
Figure 4.20: Resistance R versus Temperature T of a 4 unit cell LaAlO3 on
SrTiO3 sample. The measurements were performed in a van der Pauw
geom-etry
by tungsten probes. Contacting the pads by probes turned out impractical because of the difficulty of obtaining good contact, while at the same time not damaging the soft gold. Therefore, we switched to Al wire bonding without contact pads, also because of the time involved in depositing the contact pads.
Chapter
5
Discussion
In this chapter we will discuss the results shown in the last chapter and critically examine what we can conclude.
5.1
STO surface properties
We have seen that mixed-terminated STO samples can be reliably produced by an annealing step. It seems that at the annealing temperature of 1300◦C, the strontium termination is preferred and slowly forms at the surface.
At first, the strontium appears at the surface in the form of small islands of strontium termination besides terraces of titanium. The structure then changes to a more jagged one after about 24 hours of annealing. This jagged structure further changes into a straight terraced structure again, but now with a fully strontium terminated surface.
After HF etching and thus the removal of strontium from the surface, the ‘islands’ of strontium seem to be bigger after annealing. This suggests the strontium at the surface preferentially forms at places which are already SrO2terminated. The islands are always aligned with the steps, indicating they form at the edges of the steps.
34 Discussion
5.2
Growth of LaAlO
3on SrTiO
3The data from growth of LAO on titanium oxide terminated STO indicate well ordered layer-by-layer growth. We further know that the steps do not move over time in the growth process. This means that the ESCHER PLD setup is capable of well ordered growth and should be an invaluable tool for characterizing the growth of LAO on STO. Furthermore, the full width half maximum of the center spot provides a precise way of measuring the growth process.
However, the growth is not completely uniform. We have seen that a mixed-terminated sample can become single-terminated due to non-uniform growth. This would indicate that in the growth process, a mixed terminated LAO arrangement is less favourable than an uneven distribu-tion of the deposited material. A closer inspecdistribu-tion of under which precise conditions these changes occur would be advisable.
5.3
Interface conductance
Chapter
6
Conclusion
In this thesis we studied the surface properties of SrTiO3. We were able to reliably produce mixed ordered terminated samples with differing ratios of strontium to titanium termination. We have also shown the structural changes as a result of these differing ratios.
We were also able to show ordered growth of LaAlO3on both singly and mixed ordered terminated SrTiO3. The growth process does not move the step edges. However, a mixed ordered STO sample was singly terminated after growth, indicating a slightly uneven growth. The exact process by which this mixed termination is lost should be a useful opportunity for further research.
Unfortunately, we were not able to show conclusive evidence in favour of interface conductivity for the sample we tested grown in the LEEM. Much can be gained by a more systematic approach to and more testing of the resistance measurement. There is no theoretical reason why the ESCHER PLD system would not be able to produce the two-dimensional electron gas.
References
[1] R. Bachelet, F. S´anchez, F. J. Palomares, C. Ocal, and J. Fontcuberta,
Atomically flat SrO-terminated SrTiO3(001) substrate, Applied Physics Letters95, (2009).
[2] A. Ohtomo and H. Hwang, A high-mobility electron gas at the LaAlO3/SrTiO3 heterointerface, Nature427, 423 (2004).
[3] I. M. Dildar, M. Neklyudova, Q. Xu, H. W. Zandbergen, S. Harkema, D. Boltje, and J. Aarts, Growing LaAlO3/SrTiO3 interfaces by sputter deposition, AIP Advances5, (2015).
[4] R. Tromp, J. Hannon, A. Ellis, W. Wan, A. Berghaus, and O. Schaff,A new aberration-corrected, energy-filtered LEEM/PEEM instrument. I. Principles and design, Ultramicroscopy110, 852 (2010).
[5] R. Tromp, J. Hannon, W. Wan, A. Berghaus, and O. Schaff, A new aberration-corrected, energy-filtered LEEM/PEEM instrument II. Operation and results, Ultramicroscopy127, 25 (2013), Frontiers of Electron Mi-croscopy in Materials Science.
[6] K. Oura, V. Lifshits, A. Saranin, A. Zotov, and M. Katayama, Surface Science – An Introduction, Springer-Verlag Berlin Heidelberg, 2003. [7] M. Huijben, A. Brinkman, G. Koster, G. Rijnders, H. Hilgenkamp, and
D. H. A. Blank,Structure–Property Relation of SrTiO3/LaAlO3 Interfaces, Advanced Materials21, 1665 (2009).
Appendix
A
Sample recipes
T(◦C) Time (h) Description of structure
1300 12 Smooth strontium terraces, larger terraces if HF-etched before annealing
1300 24 Larger jagged strontium terraces 1300 72 Singly terminated strontium
1100 24 Irregular mostly titanium terminated structures