Metabolic reprogramming through fatty acid
transport protein 1 (FATP1) regulates
macrophage in
fl
ammatory potential and adipose
in
fl
ammation
Amy R. Johnson1,13, Yuanyuan Qin1,13, Alyssa J. Cozzo1, Alex J. Freemerman1, Megan J. Huang1, Liyang Zhao1, Brante P. Sampey1,14, J. Justin Milner1,15, Melinda A. Beck1,2,6, Blossom Damania3,5, Naim Rashid4,5, Joseph A. Galanko2,6, Douglas P. Lee7, Matthew L. Edin8, Darryl C. Zeldin8, Patrick T. Fueger9,10, Brittney Dietz11, Andreas Stahl11, Ying Wu12, Karen L. Mohlke12, Liza Makowski1,2,5,6,*
ABSTRACT
Objective: A novel approach to regulate obesity-associated adipose inflammation may be through metabolic reprogramming of macrophages
(M
F
s). Broadly speaking, MF
s dependent on glucose are pro-inflammatory, classically activated MF
s (CAM), which contribute to adipose inflammation and insulin resistance. In contrast, MF
s that primarily metabolize fatty acids are alternatively activated MF
s (AAM) and maintain tissue insulin sensitivity. In actuality, there is muchflexibility and overlap in the CAM-AAM spectrumin vivodependent upon various stimuli in the microenvironment. We hypothesized that specific lipid trafficking proteins, e.g. fatty acid transport protein 1 (FATP1), would direct MF
fatty acid transport and metabolism to limit inflammation and contribute to the maintenance of adipose tissue homeostasis.Methods: Bone marrow derived M
F
s (BMDMs) from Fatp1/ and Fatp1þ/þmice were used to investigate FATP1-dependent substratemetabolism, bioenergetics, metabolomics, and inflammatory responses. We also generated C57BL/6J chimeric mice by bone marrow transplant specifically lacking hematopoetic FATP1 (Fatp1B/) and controlsFatp1Bþ/þ. Mice were challenged by high fat diet (HFD) or low fat diet (LFD) and analyses including MRI, glucose and insulin tolerance tests,flow cytometric, histologic, and protein quantification assays were conducted. Finally, an FATP1-overexpressing RAW 264.7 M
F
cell line (FATP1-OE) and empty vector control (FATP1-EV) were developed as a gain of function model to test effects on substrate metabolism, bioenergetics, metabolomics, and inflammatory responses.Results: Fatp1is downregulated with pro-inflammatory stimulation of M
F
s.Fatp1/BMDMs and FATP1-OE RAW 264.7 MF
s demonstratedthat FATP1 reciprocally controled metabolicflexibility, i.e. lipid and glucose metabolism, which was associated with inflammatory response. Supporting our previous work demonstrating the positive relationship between glucose metabolism and inflammation, loss of FATP1 enhanced glucose metabolism and exaggerated the pro-inflammatory CAM phenotype.Fatp1B/ chimeras fed a HFD gained more epididymal white adipose mass, which was inflamed and oxidatively stressed, compared to HFD-fedFatp1Bþ/þcontrols. Adipose tissue macrophages displayed a CAM-like phenotype in the absence ofFatp1. Conversely, functional overexpression of FATP1 decreased many aspects of glucose metabolism and diminished CAM-stimulated inflammationin vitro. FATP1 displayed acyl-CoA synthetase activity for long chain fatty acids in M
F
s and modulated lipid mediator metabolism in MF
s.1
Department of Nutrition, Gillings School of Global Public Health, University of North Carolina at Chapel Hill, Chapel Hill, NC 27599, USA2Department of Nutrition, School of Medicine, University of North Carolina at Chapel Hill, Chapel Hill, NC 27599, USA3Department of Microbiology and Immunology, University of North Carolina at Chapel Hill,
Chapel Hill, NC 27599, USA4Department of Biostatistics, University of North Carolina at Chapel Hill, Chapel Hill, NC 27599, USA5Lineberger Comprehensive Cancer Center, University of North Carolina at Chapel Hill, Chapel Hill, NC 27599, USA6Nutrition Obesity Research Center, University of North Carolina at Chapel Hill, Chapel Hill, NC 27599,
USA7Omic Insight, Inc., Durham, NC 27713, USA8Division of Intramural Research, National Institute of Environmental Health Sciences, Research Triangle Park, NC 27709,
USA9Departments of Pediatrics, Indiana University School of Medicine, Indianapolis, IN 46202, USA10Departments of Cellular and Integrative Physiology, Indiana University
School of Medicine, Indianapolis, IN 46202, USA 11Department of Nutritional Sciences and Toxicology, University of California Berkeley, Berkeley, CA 94720,
USA12Department of Genetics, University of North Carolina at Chapel Hill, Chapel Hill, NC 27599, USA
13Co-first authors.
14
Current affiliation: Roivant Sciences, Inc. Roviant, NC, 27701, USA.
15
Current affiliation: Division of Biological Sciences, University of California San Diego, La Jolla, CA, 92093, USA.
*Corresponding author. CB7461, Department of Nutrition, University of North Carolina at Chapel Hill, Chapel Hill, NC 27599, USA. E-mail: [email protected] (L. Makowski).
Conclusion: Ourfindings provide evidence that FATP1 is a novel regulator of M
F
activation through control of substrate metabolism. Absence of FATP1 exacerbated pro-inflammatory activationin vitroand increased local and systemic components of the metabolic syndrome in HFD-fed Fatp1B/ mice. In contrast, gain of FATP1 activity in MF
s suggested thatFatp1-mediated activation of fatty acids, substrate switch to glucose, oxidative stress, and lipid mediator synthesis are potential mechanisms. We demonstrate for thefirst time that FATP1 provides a unique mechanism by which the inflammatory tone of adipose and systemic metabolism may be regulated.Ó2016 The Authors. Published by Elsevier GmbH. This is an open access article under the CC BY-NC-ND license (http://creativecommons.org/licenses/by-nc-nd/4.0/).
Keywords Adipose tissue macrophage; M2 macrophage; Obesity; Glycolysis; Crown-like structures; Mitochondria
1. INTRODUCTION
Chronic over-nutrition results in low-grade inflammation in metaboli-cally sensitive tissues that contributes to systemic metabolic dysre-gulation. In obese individuals, as much as 40% of total body composition is adipose. Adipose tissue M
F
s (ATMs) may account for up to 50% of the cellularity in the obese adipose microenvironment compared to just 10e20% in non-obese [1,2], demonstrating that ATMs play a central role in shaping the adipose inflammatory milieu. Indeed, ATMs are the primary source of inflammatory cytokines such as tumor necrosis factor alpha (TNF-a
) and interleukin 6 (IL-6) in adipose tissue, and, thus, perpetuate obesity-associated inflammation and subsequent comorbidities. Adipose inflammation in obesity has been linked to insulin resistance, type 2 diabetes, cardiovascular disease, and cancer [3,4]. Understanding the etiology of metabolic associated inflammation is critical for combating metabolic diseases. Dramatic changes within the adipose microenvironment occur with the onset and progression of obesity, including an influx of monocytes[5]. Initial studies in the early 2000s described dichotomous ATM pheno-types, either pro- or anti-inflammatory[6]. Several models suggested that monocytes differentiate into pro-inflammatory, or “classically activated” MF
s (CAM), in response to the conditions encountered within the obese adipose microenvironment. Persistent CAM activation is purported to sustain adipose inflammation, eventually leading toimpaired function of this tissue [4,7,8]. Resident anti-inflammatory M
F
s (AAM), also termed“alternatively activated”, are recognized to maintain tissue homeostasis, including insulin sensitivity, by sup-porting remodeling and secretion of anti-inflammatory cytokines[4]. In vitro, CAMs are modeled by activation of the so-called“M1” clas-sical pathway upon exposure to type 1 T-helper cytokines [9]. In contrast, AAMs are activated to the“M2”phenotype by exposure to type 2 T-helper cytokinesin vitro[6]. Recent evidence also has sug-gested that in both obesity and weight loss, ATMs can be“ metaboli-cally”activated and direct lipid trafficking, thus buffering against the excessive free fatty acid concentrations resulting from enhanced lipolysis in adipose [10e12]. These MF
s are characterized by expression of both CAM- and AAM-associated surface markers, enhanced lysosome biogenesis, expression of PPARg
responsive genes and inhibited autophagy[10,11].As appreciation of the complexity of the ATM inflammatory phenotype has evolved, so has understanding of the metabolic signature asso-ciated with ATMs [13e15]. We and others have demonstrated that CAMs exhibit a significant up-regulation of glucose metabolism, particularly flux through the pentose phosphate pathway (PPP) to generate reactive oxygen species (ROS) [16e19]. We reported that pro-inflammatory activation is achievable by enhancing glucose metabolism via glucose transporter 1 (GLUT1) overexpression using an in vitro model, even in the absence of external stimuli [20], in a Abbreviations
9-HODE 9-hydroxy-10,12-octadecadienoic acid AAM Alternatively activated macrophage ACK Ammonium-Chloride-Potassium ACSL Long chain acyl-CoA synthetase ATM Adipose tissue macrophage BMDM Bone marrow derived macrophage BMT Bone marrow transplant BSA Bovine serum albumin CAM Classically activated macrophage CDP-choline Cytidine diphosphate-choline CLS crown-like structures CoA coenzyme A
DMEM Eagle’s minimal essential medium ECAR Extracellular acidification rate eQTLs Expression quantitative trait loci eWAT Epididymal white adipose tissue FATP1 Fatty acid transport protein 1 FATP1-EV FATP1- empty vector FATP1-OE FATP1- over-expresser GLUT1 Glucose transporter 1 GTT Glucose tolerance test HFD High fat diet Hmox-1 Heme oxygenasee1
HOMAIR Homeostasis model assessment of insulin resistance
IFNg Interferon gamma
IL-1b Interleukin 1b IL-4 Interleukin 4 IL-6 Interleukin 6
iNOS Inducible nitric oxide synthase ITT Insulin tolerance test
Lamp2 Lysosome-associated membrane protein 2 LCFA Long chain fatty acids
LFD Low fat diet Lipa Lipase A LPS Lipopolysaccharide MF Macrophage
MCP-1 Monocyte chemoattractant protein-1 METSIM The METabolic Syndromes In Men
MTT 3-(4, 5-dimethylthiazolyl-2)-2,5-diphenyltetrazolium bromide MuTHER The Multiple Tissue Human Expression Resource
NADPH Nicotinamide adenine dinucleotide phosphate NLRP3 NLR family, pyrin domain containing 3 OCR Oxygen consumption rate
PGF2a Prostaglandin F2 alpha
PPARg Peroxisome proliferator-activated receptor gamma PPP Pentose phosphate pathway
PRPP phosphoribosyl pyrophosphate
Pycard Apoptosis-associated speck-like protein containing a CARD SAM S-adenosylmethionine
demonstration of the tight immunometabolic link between MV metabolic reprogramming and activation state. As second messen-gers, ROS drive production of inflammatory enzymes, cytokines, and chemokines such as inducible nitric oxide synthase (iNOS), TNF-
a
, monocyte chemoattractant protein-1 (MCP-1) and IL-6[4,16]. Overall, when considering metabolic phenotype of MF
s, CAMs are primarily glucose-dependent. In contrast, lysosomal lipolysis and fatty acid oxidative metabolism is necessary to generate AAMs[11,12,18,21], although other CPT1-mediated functions may also be important[22]. In a clear link between the immune response and metabolism, iNOS production of nitric oxide (NO) is a key mediator promoting the glycolytic/pro-inflammatory phenotype of MF
s and blunting the anti-inflammatory phenotype through NO’s role in inhibiting the electron transport chain associated with oxidative metabolism in AAM[23]. Thus, it is clear that while our understanding of MF
markers, function and immune response has increased, the complexity of metabolism in regulating MF
biology e especially in changing in vivo microenvi-ronmentseremains uncertain.Metabolic reprogramming of M
F
s offers a novel means of regulating inflammation, hence we hypothesized that metabolism of fatty acids by specific lipid trafficking proteins plays a critical role in suppressing ATM-mediated inflammation and maintaining glucose tolerance. Fatty acid transport protein 1 (FATP1, SLC27A1) is an ideal candidate for limiting pro-inflammatory activation: FATP1 is an acyl-CoA synthetase with affinity for long and very long chain fatty acids [24]e lending specificity to its functionewhich is important because some MF
fatty acid transporters, such as CD36, are promiscuous [21,25]. FATP1 expression levels are highest in tissues characterized by active fatty acid uptake and lipid metabolism, such as adipose, heart, and skeletal muscle and is primarily localized to the plasma membrane, mito-chondria, and peroxisomes[26e28]. In adipocytes, FATP1 activity is regulated by insulin-mediated translocation that increases fatty acid uptake[29]. Studies of total-bodyFatp1knockout mice demonstrated that loss of FATP1 protected mice from the effects of HFD-induced obesity, insulin resistance, and intramuscular lipid accumulation [29,30]. Functional characterization of FATP1 and activation of fatty acids through its ACSL activity have been conducted in these tissues and cell types, but, to date, not in MF
s[29e34]. Due to its complex expression pattern, the contribution of FATP1 to the development of insulin resistance is likely to be tissue- and cell-type specific.In silico analysis of existing Immunological Genome “ImmGen” Project expression data suggested thatFatp1is detected in MF
s and plas-macytoid dendritic cells[35], but not other cells that may contribute to inflammation including monocytes, microglia, B cells, T cells, neu-trophils, and eosinophils.Herein, we report that FATP1 plays a critical role in suppressing inflammationin vitro and reducing M
F
infiltration and inflammation in vivothrough modulation of lipid mediators and oxidative stress. We demonstrate for thefirst time that FATP1 provides a unique mecha-nism by which the metabolic and inflammatory tone of adipose and systemic metabolism may be regulated.2. MATERIALS AND METHODS
2.1. Reagents
All reagents were obtained from SigmaeAldrich (St. Louis, MO) unless otherwise noted. IFN
g
and IL-4 were obtained from R&D Systems (Minneapolis, MN). Lipopolysaccharide (LPS, Sigma E. coli L4391) was diluted in sterile PBS at afinal concentration of 1 mg/mL. NovolinÒ human insulin was purchased from Novo Nordisk (Plainsboro, NJ). Antibodies were purchased from the following sources: F4/80 (AbDSerotec/BioRad, Hercules, CA); CD16/32 (Fc Block, BioLegend, San Diego, CA), CD45-FITC, F4/80-PE, Ly6G/C-PE-Cy7, CD11b-APC, CD11c-APC-eFluor 780, CD11c-eFluor 450, CD206-APC (eBioscience, San Diego, CA), PhosphoAKT-Ser473 and total AKT (Cell Signaling Technology), and insulin (H-86; Santa Cruz Biotechnology, Inc., Santa Cruz, CA).
2.2. Animals and diets
Animal studies were performed with approval and in accordance with the guidelines of the Institutional Animal Care and Use Committee at the University of North Carolina at Chapel Hill. Animals were cared for according to the recommendations of the Panel on Euthanasia of the American Veterinary Medical Association. The veterinary care provided at UNC is in compliance with the Public Health Service Policy on Hu-mane Care and Use of Laboratory Animals and meets the National Institutes of Health standards as set forth in the Guide for the Care and Use of Laboratory Animals (DHHS Publication No. (NIH) 85-23 Revised 1985). The animal facility is Association for Assessment and Accred-itation of Laboratory Animal Care (AAALAC) approved and is respon-sible for the health and husbandry of animals. UNC also accepts as mandatory the PHS Policy on Humane Care and Use of Laboratory Animals be Awardee Institutions and NIH Principles for the Utilization and Care of Vertebrate Animals Used in Testing, Research, and Training. Animal studies comply with the ARRIVE guidelines. Mice were housed in a climate controlled Department of Laboratory Animal Medicine facility with a 12-hour light:dark cycle andad libitumaccess to food and water.Fatp1/mice[30]were backcrossed>12 gen-erations to the C57BL/6J genetic background. Fatp1 total body knockout (Fatp1/) and Fatp1 wild type (Fatp1þ/þ) bone marrow donor mice were generated usingFatp1/þbreeding pairs to generate littermate controls.
2.3. Adipose tissue M
F
sTo isolate ATMs from lean and obese adipose, male C57BL/6J mice were randomized onto either chow or an obesogenic diet (HFD, 45% kcal from fat, HFD; D06011802, Research Diets, New Brunswick, NJ) at weaning. After 23 weeks on diet, epididymal white adipose tissue (eWAT) was minced in 25 mM HEPES-buffered DMEM/1% fatty acid-free, low endotoxin BSA (Sigma) and completely digested with 0.5 mg/ mL Liberase TM (Roche Diagnostics, Indianapolis, IN) at 37. Samples were centrifuged at 200gfor 10 min at 4 to pellet the M
F
-rich stroma vascular fraction (SVF). The pellet was washed twice with in 25 mM HEPES-buffered DMEM/1% fatty acid-free, low endotoxin BSA and red blood cells were lysed and washed again. Samples were stained with anti-F4/80-PE and sorted on a MoFlo cell sorter (Beckman Coulter, Brea, CA). F4/80hiMF
s were collected for mRNA isolation and gene expression analysis.2.4. Fatp1genotyping
Genomic DNA was isolated from tail biopsies, eWAT, and BMDM using a DNeasy Blood and Tissue kit (Qiagen, Valencia, CA). Genotyping was performed using the following primers: Fatp1 forward: GGCGGT CAATGTTAAGTAAACTGG, Fatp1þ/þ reverse: CTCACACCACCCTGCAA-GACTCT, Fatp1/ neomycin cassette reverse: GTAATGGGATAGGT CACGTTGGTG[30]. iProof High-Fidelity PCR super mix (Bio-Rad, Her-cules, CA)-based genotyping was performed on a C1000 thermocycler (Bio-Rad, Hercules, CA).
2.5. BMDM isolation, differentiation, and activation
RPMI-1640 containing 30% L929 conditioned media supplemented with 10% FBS, 2 mM glutamine, 100 IU/mL penicillin and 100
m
g/mL streptomycin (SigmaeAldrich, St. Louis, MO). For bioenergetics as-says, BMDM were differentiated using M-CSF (20 ng/ml). BMDM were left as naïve unstimulated MF
s (Un), or activated using 5 ng/mL LPS and 10 ng/mL IFNg
(CAM) or 10 ng/mL IL-4 (AAM) for 24 h[18]. Cell densities and viability were determined by hematocytometer and try-pan blue exclusion, respectively. Cell size, volume, and viability were determined using a SceptorÔhandheld automated cell counter (Mil-lipore, Billerica, MA).2.6. Immunoblot
FATP1 protein expression was measured by immunoblotting as pre-viously described[36]. Polyclonal anti-sera raised against the C-ter-minus of FATP1 or antibody against
b
-tubulin diluted 1:1000 in PBS with 0.1% Tween-20, overnight was used. Primary antibodies were detected with LI-COR secondary antibodies and imaged on the LI-COR Odyssey Imaging System (Lincoln, NE). PhosphoAKT (ser473) and total AKT was measured by immunoblotting as previously described[37].2.7. Long chain acyl-CoA synthetase (ACSL) activity assay
Total ACSL activity was measured as previously described[38].14 C-Oleate acid (PerkinElmer Life Sciences, Akron, OH) was incubated with cell homogenate and reactions were terminated after 10 min. Heptane-washed aqueous phase (0.6 mL) was counted on a Wallac 1409 Liquid scintillation counter (PerkinElmer Life Science, Waltham, MA). Total ACSL activity was expressed as nanomoles of oleate-CoA ester formed/minute/mg protein.
2.8. Metabolomics and eicosanoid profiling
Fatp1þ/þandFatp1/BMDM or FATP1-EV and FATP1-OE RAW264.7 were plated on low binding, non-tissue culture treated plates. 24 h after plating, both RAW M
F
s and BMDM were left untreated (Un) or activated to CAM as above. Analysis of AAM-stimulated MF
s at Metabolon were cost prohibitive at the time of this study. PBS-washed cells were detached by scraping,flash frozen in liquid nitrogen, and metabolomics analysis on lysates was completed by Metabolon, Inc. (Research Triangle Park, NC)[39]. N¼4 replicates per group. Missing values were imputed with the minimum. Data are presented as relative measures of “scaled intensity” after normalization to protein and median scaling to 1. For measurement of eWAT 8-iso-PGF2aand cell media eicosanoids, lipids were extracted from 25 mg of pulverized eWAT tissue and eicosanoids were quantified by liquid chromatog-raphy with an Agilent 1200 Series capillary HPLC (Agilent Technolo-gies, Santa Clara, CA, USA) as previously described[40]. Negative ion electrospray ionization tandem mass spectrometry was used for detection. N¼8 per group for eWAT and N¼4 for cell media from Fatp1þ/þ and Fatp1/ BMDM or FATP1-EV and FATP1-OE RAW264.7.2.9. High fat diet study
M
F
Fatp1þ/þ(Fatp1bonemarrowþ/þ,Fatp1Bþ/þ) and deficient (Fatp1B/) chimeric mice were generated using bone marrow transplant (BMT) strategy as outlined insupplemental Figure appendix (“A”) A5 B. Briefly, 3-week-old male C57BL/6J recipient mice were purchased from Jackson Laboratories (Bar Harbor, ME). Upon arrival, C57BL/6J mice were ran-domized to either a purified low fat diet (10% kcal from fat, LFD; D07010502, Research Diets, New Brunswick, NJ) or HFD. At 6 weeks of age, recipient mice were administered 2 doses of X-ray radiation (500 cGy2, spaced 4 h apart; X-RAD, North Branford, CT). Simulta-neously, bone marrow was harvested from 6 week old maleFatp1/andFatp1þ/þdonor mice maintained on standard chow and transplanted as in Makowski et al. [41]. Control irradiated animals that were not reconstituted with bone marrow died within 10 days of irradiation. Fatp1Bþ/þandFatp1B/chimeric animals were maintained on LFD or HFD for a total of 23 weeks. N ¼16e17 mice per diet group and genotype.
2.10. Metabolic phenotyping
Body composition was measured immediately prior to BMT and prior to sacrifice (at 23 weeks on diet) using magnetic resonance imaging (MRI, EchoMRI, Houston, TX). Blood glucose was measured at 3 weeks on the diets and again at termination, both following a 6 h fast. Randomly fed blood glucose was measured at 9:00 AM after 23 weeks on diet. Intraperitoneal glucose tolerance tests (GTT) and in-sulin tolerance tests (ITT) were performed at weeks 19 and 20 on diet, following 6 or 4 h fast, respectively[42]. Briefly, 2.0 gm/kg body weight of glucose or 0.75U of insulin was injected intraperitoneally, and blood glucose was measured over 120 min. All blood glucose measurements were performed using a FreeStyle Freedom Lite glucometer (Abbot Diabetes Care, Inc., Alameda, CA). Plasma insulin was measured by ELISA (EMD Millipore, Billerica, MA). Fasting glucose (mg/dL) and insulin (pmol/L) concentrations measured just prior to euthanasia were used to calculate HOMAIRand HOMA%B[43]. N¼5 mice were injected with insulin (0.75 U) prior to euthanasia in 6 h fasted mice to determine insulin sensitivity by Western Immunoblot.
2.11. Tissue and blood collection
Animals were euthanized with tribromoethanol/amylene hydrate (1.25%, Sigma Aldrich, St. Louis, MO). Blood was collected via cardiac puncture and plasma was separated from other blood components by centrifugation at 200gfor 5 min at 4C. eWAT and pancreata were collected andfixed in 10% formalin for histological analyses. A portion of eWAT tissue wasflash frozen and pulverized in liquid nitrogen for Western immunoblot.
2.12. Hematologic analysis
Hematologic analysis was conducted on fed 10-week-old Fatp1þ/þ andFatp1/age-matched male and female mice maintained onad libitumchow. Blood was collected by submandibular bleed into EDTA-coated tubes. Hematologic analysis occurred in the UNC Mouse Clinical Chemistry Core using an automated hematology analyzer. In addition,
flow cytometry was used to enumerate circulating leukocyte pop-ulations. Blood was collected from samples for hematologic analysis, and red blood cells were lysed in ACK lysis buffer. Cells were washed twice in HBSS, resuspended in PBS, counted, and then 1105cells were stained with CD45-FITC, F4/80-PE, Ly6G/C-PE-Cy7, CD11b-APC, CD11c-APC-eFluor 780 in the presence of anti-CD16/32 (Fc block) in FACS buffer (1% FBS in PBS) as described in Murphy et al. [44]. Samples were analyzed on the Dako CyAN ADP flow cytometer (Beckman Coulter, Inc., Fullerton, CA) and FlowJo Software (TreeStar, Ashland, OR). Gating strategy is included assupplemental Figure A1.
2.13. Quantitation of secreted cytokines and chemokines
Concentrations of plasma leptin, IL-6, TNF
a
, and MCP-1 or conditioned media IL-1b
, IL-6, Il-10, and MCP-1 were measured using a MAGPIX Luminex kit (EMD Millipore, Billerica, MA).2.14. Gene expression analysis
determined using Nanodrop (ThermoScientfic, Wilmington, DE) and reverse transcribed using the iScript cDNA synthesis kit (Bio-Rad, Hercules, CA). Gene expression was quantitated by qPCR using Assay-On-Demand chemistries on an ABI 7900HT machine (Life Technolo-gies, Grand Island, NY)[45]. Expression levels of genes of interest were normalized to expression of18S. Animals whose body weight was at or above the mean body weight for the experimental group were selected for analysis; therefore, unless indicated, N¼8e9/group for mouse data and N¼3e6 experiments for cell culture studies.
2.15. Morphological and immunohistochemical analyses of eWAT and pancreata
Anti-F4/80 and 4-HNE immunohistochemistry staining was conducted as previously described[46]. Pancreatic islets of Langerhans were visualized by H&E[46,47]. All histological sections were scanned on an Aperio ScanScope CS Ultra-Resolution Digital Scanner and analyzed using ScanScope Image Analysis Toolbox software (Buffalo Grove, IL) [37].
2.16. FATP1-OE stable M
F
cell line generation andcharacterization
The DNA sequence forFatp1was obtained from the National Institutes of Health Mammalian Gene Collection.Fatp1cDNA containing a 50EcoRI site followed by a Kozak sequence and Flag tag and a 30NotIsite was cloned into the pCI-neo Mammalian Expression vector (Promega, Mad-ison, WI). The upstream primer: 50 -GATCGAATTCGCCACCATGGATTACA-AGGATGACGACGATAAGCGGGCTCCTGGAGCAGGAACAGCC-3’. The down stream primer: 50-GATCGCGGCCGCTCAGAGTGAGAAGTCGCCTGC-3’. Sequencing confirmed the fidelity of the sequence. Mouse RAW264.7 MV cells (ATCC, Manassas, VA; ATCC# TIB-71) were transfected with either the empty vector (FATP1-EV) or FATP1 expression construct (FATP1-OE) using the AMAXA Nucleofector V kit (Lonza, Co-logne, Germany). Stable cell lines were established and diluted serially to obtain clonal isolates under selection using 400
m
g/ml G418 Sulfate (Cellgro, Manassas, VA) for 2 weeks. All transfected MF
s were subse-quently maintained in 200m
g/mL G418 Sulfate. RAW264.7 FATP1-EV and FATP1-OE cells were grown in Dulbecco’s minimal essential me-dia (DMEM) 4.5 g/L glucose supplemented with 10% FBS, 100 IU/mL penicillin and 100m
g/mL streptomycin (SigmaeAldrich, St. Louis, MO). Studies reported herein were repeated in a second set of clones and the parent heterologous population of FATP-EV and FATP1-OE from which the clones were isolated (data not shown). Cell viability, size and volume were determined as above. Cell proliferation was determined by 3-(4, 5-dimethylthiazolyl-2)-2,5-diphenyltetrazolium bromide (MTT) assay (ATCC) over 24e96 h of culture[20].2.17. Substrate uptake and metabolism
FATP1-EV and FATP1-OE RAW264.7, or Fatp1þ/þ and Fatp1/ BMDM were plated at 1.5105or 7.5105cells/well, respectively, into 24 well plates, allowed to attach overnight and stimulated as above. Cells were washed with PBS and then incubated untreated or with 2
m
M BODIPYÒC16fluorescent palmitic acid (Molecular Probe, Grand Island, NY) in DMEM for 30 min at 37C[48]. Fluorescence was measured using a CyAn ADP Analyzer flow cytometer (Beckman Coulter, Fullerton, CA) and FlowJo software (TreeStar, Ashland, OR) [49]. To measure fatty acid oxidation, 1.0m
Ci/mL BSA-conjugated 1-[14C]-oleic acid (PerkinElmer Life Sciences, Waltham, MA) was added to DMEM containing 12.5 mM HEPES, 1 mM L-carnitine to a final concentration of 0.5%, 100m
M sodium oleate.14C-CO2was captured and counted using EcoScint H. Glucose uptake, oxidation and glycogensynthesis were measured as previously described[20]. Results were normalized to protein concentration.
2.18. Cellular bioenergetics
FATP1-EV or FATP1-OE RAW MVs (6104/well) were seeded into a Seahorse Bioscience (Billerica, MA) tissue culture plate, allowed to attach for 3 h and activated with 100 ng/mL LPS (RAW264.7) or PBS vehicle control.Fatp1þ/þor Fatp1/ BMDMs (2105/well) were seeded and allowed to attach for 3 h and then either left as naïve unstimulated M
F
s (Un), CAM, or AAM activated for 24 h as above. Prior to analysis, cells were washed twice with DMEM (RAW) or RPMI (BMDM) assay media (sodium bicarbonate- and glucose-free DMEM or RPMI supplemented with 2 mM glutamine, 100 IU/mL penicillin and 100m
g/mL streptomycin (SigmaeAldrich, St. Louis, MO) and equili-brated for 1 h at 37C without CO2.Measures of glycolytic rate and glycolytic capacity were determined by recording extracellularacidi-fication rates (ECAR, mpH/min) and oxygen consumption rates (OCR, pmol/min) on a Seahorse Bioscience XF24 Extracellular Flux Analyzer (Billerica, MA) [50]. The injection of glucose was used to measure glycolytic rate (final concentration 25 mM (RAW) or 11 mM (BMDM); Sigma, St. Louis, MO). Oligomycin was injected to measure glycolytic capacity (final concentration 2.5
m
M; Sigma, St. Louis, MO). 2-deoxyglucose was used to blunt glycolysis (final concentration 20 mM). N ¼ 6 replicates per genotype/treatment. Equal plating density was confirmed by protein assay. Experiments were repeated a minimum of three times.2.19. Human gene expression, variants, and trait association
To determine whether human genetic variants may act as cis-regu-lators ofFATP1expression, we searched for expression quantitative trait loci (eQTLs) for FATP1 (SLC27A1) located within 1 Mb of the coding sequence. We searched the Multiple Tissue Human Expression Resource (MuTHER) study of HapMap-imputed variants associated with gene expression in subcutaneous adipose tissue from 856 female twins[51]available in the Genvar database[51]. We used the same criteria to look upcis-eQTLs in subcutaneous adipose expression data from the METabolic Syndrome In Men (METSIM) study of 1000 Genomes-imputed variants in 1381 men[52]. Expression levels were analyzed after adjustment for 40 inferred determinants from factor analysis[53].
2.20. Statistics
Figure 1: Fatp1deletion decreased MFacyl-CoA synthetase (ACSL) activity and resulted in a metabolic shift from lipid oxidation to glycolysis that resulted in exacerbated CAM and reduced AAM activation. A.Fatp1-Fatp6mRNA was measured in BMDM generated fromFatp1þ/þandFatp1/mice on chow diet (n.d., not detected.
**P<0.01; ****P<0.0001Fatp1þ/þvs.Fatp1/). B. FATP1 protein expression was measured by Western immunoblot in unstimulated BMDM. Tubulin is used as a loading control. C. ACSL activity was measured using14Ceoleate in unstimulatedFatp1þ/þandFatp1/BMDMs (*P<0.05). D. Oxygen consumption rate (OCR) was measured using the Seahorse Extracellular Flux Analyzer in Un, CAM, and AAM activated BMDM fromFatp1þ/þandFatp1/mice. (***P<0.001). E. Fatty acid uptake was measured using BODIPYÒ -palmitate (*P<0.05 and ****P<0.0001,Fatp1þ/þvs.Fatp1/). F. Complete fatty acid oxidation was measured using14C-oleate (*P<0.0001). G. Glucose transporter 1(Glut1)
are shown as meanstandard error of the mean (SEM). P values less than 0.05 were considered statistically significant.
3. RESULTS
3.1. Lack of FATP1 induced a metabolic substrate switch from fatty acid to glucose metabolism
We hypothesized that FATP1 plays a role in supporting M
F
function and inflammation by directing lipid metabolism in MF
s. To test this hypothesis using a commonin vitromodel to study MF
biology, BMDM were isolated and differentiated from age-matched, chow-fed male Fatp1þ/þ and Fatp1/ mice. There were no differences in the number or gross morphology of BMDM generated fromFatp1/mice compared toFatp1þ/þmice (data not shown).Figure 1A shows that in Fatp1þ/þ BMDM, Fatp1 expression was 2-fold higher in AAM compared to CAM-stimulated BMDMs, replicating in silico findings [54].Fatp1expression was reduced (P<0.001) inFatp1/BMDM, as expected[30].Fatp2, 3, and 5 were undetected. Relative toFatp1, BMDMs expressFatp4at higher concentrations in all activation states. In contrast to Fatp1, Fatp4 expression is increased 3-fold in CAM activated compared to unstimulated and AAM-stimulated BMDM. No compensation forFatp1deficiency byFatp4orFatp6was detected; in fact, in CAM-stimulated BMDM,Fatp4was detected at lower levels in Fatp1/ compared to Fatp1þ/þ BMDM (P < 0.0001, Figure 1A). Minor non-translatedFatp1mRNA was detected due to where qPCR primers were located. The lack of FATP1 protein (Figure 1B) and a 40% reduction in total ACSL BMDM enzymatic activity (P<0.01,Figure 1C) had no effect on the size or viability of BMDMs (Figure A2 AeB). To examine effects of lack of FATP1 on MF
metabolism, we next examined cellular bioenergetics, fatty acid uptake, and substrate metabolism. Mitochondrial oxidative phosphorylation, as measured by oxygen consumption rate (OCR), was elevated in AAMs compared to unstimulated or CAMs, as expected[18]. OCR was significantly higher in Fatp1/ compared to Fatp1þ/þ BMDM in all activation states (P<0.001,Figure 1D). InFatp1þ/þBMDM, AAM-activation induced a 57% and 97% increase in fatty acid internalization when compared to unstimulated (P < 0.0001) or CAM, respectively (P < 0.001, Figure 1E). Compared toFatp1þ/þ, fatty acid uptake was reduced by 21% and 24% in unstimulated (P<0.05) and AAM-activatedFatp1/ BMDM (P<0.0001), respectively. The diminished fatty acid uptakein AAM-activatedFatp1/BMDM correlated with a 17% reduction in complete oleate oxidation compared to Fatp1þ/þ controls (P < 0.0001, Figure 1F). There were no significant differences in incomplete fatty acid oxidation as measured by14C incorporation into acid soluble metabolites (data not shown).
Because MVs markedly enhance glucose metabolism when CAM activated, we determined if inhibition of lipid metabolism via deletion of FATP1 would reprogram BMDM metabolism toward increased glucose usage, thus creating a CAM-like metabolic phenotype. Expression of glucose transporter 1 (Glut1) was significantly increased in CAM activated Fatp1/ compared to Fatp1þ/þ BMDM (P < 0.0001, Figure 1G). Next, extracellular acidification rate (ECAR) was used to measure glycolytic rate. Fatp1/ BMDM displayed significantly increased glycolytic rates in unstimulated (P < 0.05), CAM-(P<0.001) and AAM-activated (P<0.05) states compared toFatp1þ/ þBMDM (Figure 1H). Glycolytic capacity was similarly elevated in the
absence of FATP1 (Figure A2 C). Neither glucose oxidation or glycogen synthesis was affected byFatp1genotype (data not shown). Spearman correlation analyses revealed a significant inverse correlation between glycolytic rate and fatty acid oxidation (r¼ 0.63, P¼3104). Furthermore, both glycolytic rate (r ¼ 0.77, P ¼ 0.0053) and
capacity (r¼ 0.89, P¼1104) were inversely proportional to ACSL activity.
3.2. Lack of FATP1 primed MVs for exaggerated pro-inflammatory
response upon CAM activation and hindered activation to the AAM phenotype
Expanding on our observations thatFatp1/BMDM internalized and oxidized less fatty acid compared toFatp1þ/þ, together with existing evidence linking M
F
substrate metabolism and inflammatory pheno-type[16,18,20], we next measured the basal expression and infl am-matory response ofFatp1þ/þandFatp1/BMDMs. Expression of the classic CAM marker inducible nitric oxide synthase (Nos2) was 2-fold higher in Fatp1/ compared to Fatp1þ/þ CAM-activated BMDMs (P < 0.0001, Figure 1I). AAM marker Arginase-1 (Arg1) [18] up-regulation was significantly blunted in Fatp1/ compared to Fatp1þ/þBMDM (P<0.05,Figure 1J). Furthermore, heme oxygenase e1 (Hmox-1) expression, an anti-inflammatory marker[55,56], was reduced by 50% in both CAM- and AAM-activatedFatp1/BMDM (P < 0.001, Figure 1K). Antigen presenting molecules were also evaluated in BMDM. CD86 and CD80, two molecules that prime T cells, were increased by CAM activation, but regulation was not altered by Fatp1(supplemental Figure A3 AeB). HLA class II histocompatibility antigen gamma chain, or CD74, was increased by both CAM and AAM activation, but Fatp1 did not alter expression significantly (supplemental Figure A3 C).3.3. Metabolomic analysis ofFatp1/BMDM indicated enhanced
glucose metabolism, particularly through the PPP
To further test FATP1’s effects on substrate metabolism, compre-hensive metabolomics profiling was undertaken. Fatp1þ/þ and Fatp1/BMDM were isolated, left unstimulated or CAM activated, and then lysed for metabolite analysis. CAM activation increased 54 and 49 metabolites and downregulated 123 and 115 metabolites in Fatp1þ/þ and Fatp1/, respectively. As expected, carbohydrate metabolism was upregulated with CAM activation of BMDMs regard-less of genotype from the unstimulated state especially “Fructose, mannose, galactose, starch, and sucrose metabolism”, “Nucleotide sugars, pentose metabolism”, and most of the metabolites from glycolysis and the Krebs cycle. However, some metabolites were downregulated with CAM activation including glucose, fumarate, and malate, among others (Table A1, and P values within). Several path-ways were also downregulated when BMDMs were CAM activated from the unstimulated state, including the“glycine, serine and thre-onine metabolism”subpathway, several nucleotides, other amino acid metabolism, dipeptides, and gamma-glutamyl amino acid metabolites. Likewise, most of the cofactor and vitamins were downregulated with the exception of biopterin and two nicotinate and nicotinamide me-tabolites. There was little regulation of fatty acid metabolism except a decrease in the essential fatty acids docosapentaenoate (n6 DPA; 22:5n6), docosahexaenoate (DHA; 22:6n3), and medium chain fatty acid caproate (6:0) with CAM activation. Increased concentrations of metabolites in glycerolipid metabolism, some lysolipids, and prosta-glandinsewith a tremendous 40þ-fold increase in PGD2ewith CAM stimulation in both genotypes were detected.
BMDM were CAM activated, there were 12 upregulated and 13 downregulated inFatp1/compared toFatp1þ/þ.Fatp1/in both unstimulated and CAM activated states had greater concentrations of metabolites including glutamate, hypotaurine, taurine, N-acetylneur-aminate, and the medium chain fatty acid pelargonate (9:0). Signifi -cantly lower concentrations of some metabolites in the pathways entitled“Fructose, mannose, galactose, starch, and sucrose meta-bolism”, “Glycolysis, gluconeogenesis, pyruvate metabolism” and
“Glycine, serine and threonine metabolism” were detected. For example, significantly lower concentrations of sorbitol, glucose, glycine, serine, and asparagine were detected inFatp1/ in both unstimulated and CAM activated states compared toFatp1þ/þ. 22% less intracellular lactate was detected inFatp1/BMDM compared to Fatp1þ/þ in the CAM-stimulated state. Fatp1/ displayed signifi -cantly less ethanolamine in the unstimulated state compared to Fatp1þ/þ (P < 0.05), but concentrations between Fatp1þ/þ and Fatp1/were identical in CAM. Riboflavin (or Vitamin B2) was another metabolite that was significantly 1.97-fold greater in Fatp1/ compared toFatp1þ/þBMDM in the unstimulated state (P<0.05, Figure 1L) but was significantly lower (0.27-fold or 73% less) in Fatp1/BMDMs compared toFatp1þ/þBMDM in the CAM-activated state (P<0.01,Figure 1L). Glycerophosphorylcholine (GPC) was 0.81-fold lower inFatp1/BMDMs in the unstimulated state (P<0.0001); however, upon CAM activation,Fatp1/BMDMs contained 1.20-fold (P<0.001) greater GPC compared toFatp1þ/þin respective states. Finally, eicosanoids were detected in media from the same BMDM
experiment where metabolites in lysates were measured (Table A3). One of the most strikingly regulated eicosanoids was 15-Hydroxyicosatetraenoic acid (15-HETE), which was significantly upre-gulated in unstimulated and CAM activated Fatp1/ compared to Fatp1þ/þ BMDM (P < 0.0001 for both states, Figure 1M and Table A3). Other arachidonic acid metabolites including 12-HETE and 5-HETE as well as linoleic acid metabolite 9,10-Dihydroxy-12Z-octa-decenoate (9,10-di-HOME) were also significantly increased inFatp1/ compared toFatp1þ/þBMDM (P<0.05,Table A3).
3.4. A lack of M
F
FATP1 exacerbated HFD-induced weight gainand induced glucose intolerance and greater accretion of epididymal white adipose tissue (eWAT)
Because Fatp1 regulated substrate metabolism and directed M
F
activationin vitro, we sought to test effects of loss of functionin vivo. Wefirst demonstrated thatFatp1mRNA was elevated 7.5-fold in F4/ 80 þ ATMs isolated from the stromovascular fraction from obese eWAT compared to lean mice at 23 weeks of age (Figure A5 A, P<0.001). Based on the fact thatFatp1is expressed in obese ATMs and may play a role in MF
lipid metabolism and inflammation, we next created chimeras to study Fatp1 deficiency in ATM function. Male C57BL/6J recipient mice were randomized onto either LFD or HFD at 3 weeks of age so mice would remain lean or gain weight, respectively. After 3 weeks on the diets (i.e., at 6 weeks of age), fasting glucose and MRI-determined body composition were identical for all mice regard-less of diet group (data not shown). At this time point, recipient mice Figure 2: Deletion of MFFatp1increased susceptibility to HFD-induced weight gain, glucose intolerance, and increased epididymal white fat mass. A. Body weights were measured weekly (Fatp1B/vs.Fatp1Bþ/þmice on HFD; ***P<0.001). B. Randomly fed blood glucose was measured at 23 weeks on diet (*P<0.05). C. Intraperitonealglucose tolerance tests were conducted at 19 weeks on diet after a 6hr fast. HFD-fedFatp1Bþ/þvs.Fatp1B/(**P<0.01 and *P<0.05). D. Epididymal white fat mass was
were lethally irradiated and transplanted with bone marrow from Fatp1þ/þ and Fatp1/ donor mice to generate chimeric mice harboring eitherFatp1bonemarrowþ/þ(FATP1Bþ/þ) orFatp1bonemarrow/ (Fatp1B/) (see study design cartoon inFigure A5 B). Control mice
that were irradiated but did not receive marrow died within 10 days of irradiation (data not shown). To confirm successful ablation and reconstitution ofFatp1-deficient marrow, BMDM were isolated from a cohort of LFD-fed and HFD-fedFatp1Bþ/þandFatp1B/mice. There were no significant differences in number or appearance of BMDM isolated from the transplanted and diet-exposed mice (data not shown).Figure A5 Cillustrates that the irradiation and reconstitution with Fatp1þ/þ or Fatp1/ marrow was successful as only the mutatedFatp1null allele, not wildtypeFatp1, was detectable in BMDM isolated from mice transplanted withFatp1/bone marrow. Gene expression (not shown) and immunoblot analysis of these BMDM demonstrated that FATP1 was successfully ablated from M
F
s in thismodel (Figure A5 D). In addition, hematologic and flow cytometric analysis ofFatp1þ/þandFatp1/mice demonstrated no significant differences in any measure including white blood cells, lymphocytes, granulocytes, monocytes, by either total numbers of cells or per-centage of cells within the total blood cell population (Table A4 and A5). After irradiation and reconstitution, Fatp1B/ mice gained signifi -cantly more weight compared toFatp1Bþ/þon HFD (P<0.0001 from 15 weeks through to sacrifice at 23 weeks on diet) (Figure 2A). After 23 weeks on diet, random-fed blood glucose concentrations were 14% higher inFatp1B/mice compared toFatp1Bþ/þon HFD (P<0.05, Figure 2B). Six-hour-fasted blood glucose concentrations did not differ significantly by genotype; LFD-fedFatp1Bþ/þ, andFatp1B/fasted blood glucose concentrations at termination were an average of 133 mg/dL for both genotypes, whereas HFD-fed concentrations were 131.5 and 147 mg/dL, respectively. Six-hour-fasted plasma insulin concentrations at termination revealed no significant differences Figure 3: Lack of MFFATP1 increased adipose inflammation, shifted ATM phenotype, increased inflammasome expression and oxidative stress in HFD-fed mice. Ae D. F4/80þMFstaining was conducted in eWAT. Representative 10X images are presented. E. Quantification of crown like structures (CLS, arrows in D) in eWAT in 5 random 20X
fields (P<0.01 inFatp1Bþ/þvs.Fatp1B/-). F. mRNA expression of MFmarkersEmr1(F4/80),Cd11bandCd11cwas measured by qPCR in eWAT (**P<0.01 and *P<0.05 Fatp1Bþ/þvs.Fatp1B/within the same diet group). G. Flow cytometric analysis of % F4/80þCD11c-eFluor450 and % F4/80þCD206-APC positive staining inFatp1Bþ/þand Fatp1B/ATMs cells isolated from eWAT stromovascular fraction from eWAT fromFatp1Bþ/þandFatp1B/mice fed HFD for 23 weeks (N¼3).Il-6(H) andIl-1b(I) mRNA
among the groups (supplemental Figure A6 A). Likewise, there were no differences in homeostasis model assessment of insulin resistance (HOMAIR) or homeostasis model %
b
cell function (HOMA%b) (data not shown).Glucose tolerance tests (GTT) were performed to evaluate systemic metabolic responses inFatp1Bþ/þandFatp1B/LFD- and HFD-fed mice. Overall, HFD in this BMT model did not induce dramatic de-fects in glucose disposal, which was expected and similar to other BMT models due to lack of extensive weight gain associated with irradiation[42,57,58]. However, circulating glucose concentration at 15 min post glucose injection was significantly higher inFatp1B/ mice on HFD (P<0.001), which correlated to delayed and inefficient disposal of glucose compared toFatp1Bþ/þfor the remainder of the time course (30 min: P ¼ 0.004; 60 min: P ¼ 0.03, 120 min: P ¼ 0.04) (Figure 2C). Insulin tolerance tests (ITT) indicated that neither diet nor genotype affected the glucose response to an injection of insulin (supplemental Figure A6 B and C). Furthermore, histologic and immunohistologic analysis of insulin staining and morphology of islets in pancreata did not demonstrate significant alterations in number or size of islets between diet and genotypes (supplemental Figure A6 D). Finally, eWAT was analyzed in mice that received in-sulin prior to sacrifice to determine insulin signaling capacity (supplemental Figure A6 E). Quantification revealed that in LFD-fed mice, regardless of genotype, insulin induced a 1.5e2-fold increase in pAKT/AKT concentrations. There was no Fatp1 genotype effect; however, insulin-stimulation reached significance in Fatp1Bþ/þ (P ¼0.041) but failed to reach significance in Fatp1B/ LFD-fed mice. In mice fed HFD, the insulin response was only 1-fold as compared to 1.5e2-fold in lean mice. The insulin response was statistically reduced in HFD-fed mice compared to LFD-mice in both Fatp1Bþ/þ(P¼0.0008) andFatp1B/(P¼0.0008).
Body composition was next investigated to determine if M
F
FATP1 contributed to alterations in adipose tissue. Mice fed a HFD displayed significantly increased percent body fat as measured by MRI as well as elevated plasma leptin concentrations (P<0.001,Figure A7 A and B, respectively). A trend forFatp1B/mice to have greater adiposity and leptin was evident, yet no significant genotype differences were detected. However, isolated eWAT depots in HFD-fedFatp1B/mice were 40% heavier compared to HFD-fedFatp1Bþ/þmice (P<0.01, Figure 3D). Neither lean mass nor liver and brown adipose weights were altered by genotype (Figure A7 CeE). Furthermore, no difference was found in respiratory exchange rate (RER), measured by metabolic chamber, during the day or at night betweenFatp1B/andFatp1Bþ/þ mice either on LFD or HFD despite a significant nighttime diet effect (P¼0.01) (Figure A7 F and G).3.5. Deletion of M
F
Fatp1led to augmented eWAT MF
influx,crown-like structure (CLS) formation, inflammation, activation of the
NLRP3 inflammasome, and oxidative damage in HFD-fed mice
Infiltration of M
F
s from transplanted marrow into eWAT was confirmed by PCR-based genotyping of eWAT genomic DNA to detect the mutatedFatp1allele (Figure A7 H). There was a 60% increase in the number of F4/80þCLS observed in eWAT from HFD-fedFatp1B/ mice compared to HFD-fed wild type controls (Figure 3AeD andquantified in 3E, P < 0.01). Furthermore, qPCR gene expression analysis for monocyte/M
F
markersEmr1(F4/80),Cd11b, andCd11c indicated significant increases in HFD-associated MF
influx in HFD-fed Fatp1B/eWAT compared toFatp1Bþ/þ(2.7-fold higher, P<0.01; 1.7 fold, P<0.05; and 2.8-fold, P<0.001, respectively,Figure 3F). Importantly,flow cytometric analysis of F4/80þmacrophages from the SVF of eWAT demonstrated that more CAM-like CD11cþCD206-ATMS were present in eWAT from Fatp1B/ mice compared to Fatp1Bþ/þ on HFD. Likewise, a decrease in AAM-like CD11c-CD206þATMS were present in eWAT fromFatp1B/mice compared toFatp1Bþ/þon HFD (Figure 3G, with gating strategy and scatter plots inFigure A8 A and Brespectively).
Upon the discovery of greater M
F
influx and a shift towards more inflammatory ATM phenotype in Fatp1B/ mice compared to Fatp1Bþ/þon HFD, we next investigated pro-inflammatory cytokine expression. Expression of the pro-inflammatory cytokineIl-6was 5-fold higher in eWAT from Fatp1B/ mice compared to Fatp1Bþ/þ on HFD (P < 0.01, Figure 3H). Likewise, expression of the pro-inflammatory cytokine Il-1b
, was doubled in eWAT fromFatp1B/ mice compared to Fatp1Bþ/þ on HFD (P <0.05, Figure 3I). IL-1b
production results from activation of the inflammasome [59]. We observed significantly elevated expression of NLRP3 inflammasome subunits includingNlrp3andPycardin eWAT from Fatp1B/mice compared toFatp1Bþ/þon HFD (P<0.01,Figure 3J). Furthermore, elevated 4-HNE (data not shown) and significantly increased concen-trations of 8-iso-PGF2a, an indicator of non-enzymatic oxidative damage, indicated increased oxidative damage in eWAT from HFD-fed Fatp1B/mice compared to HFD-fed Fatp1Bþ/þ mice (P <0.05, Figure 3K). Finally, there were trends for increased eicosanoids in LFD-fed eWAT such as 15-HETE, 5-HETE and 9,10-DiHOME (metabolites that were significantly regulated in BMDMs byFatp1), however these did not reach statistical significance in eWAT (data not shown).3.6. FATP1 gain of function model drove ACSL activity and fatty acid uptake
Given that lack of Fatp1 led to dramatic changesin vitroandin vivo, we next determined if the highly glycolytic CAM-like RAW264.7 mouse M
F
cell line could be metabolically reprogrammed toward an AAM-like phenotype via FATP1 overexpression (FATP1-OE). First, expression levels of the 6 members of theFatpfamily were examined by qPCR. RAW MF
s expressed only Fatp1 and Fatp4, both of which were induced 2-fold by 24 h LPS activation (Figure 4A).Fatp2, 3, 5, and 6 were not detected. Overexpression of bothFatp1mRNA (P<0.001, Figure 4A) FATP1 protein in FATP1-OE was achieved compared to empty vector controls (FATP1-EV, Figure 4B). FATP1 protein is essentially undetected in unstimulated RAW MF
s, thus FATP1 over-expression created a gain of function model. A significant decrease in Fatp4expression in FATP1-OE MF
s upon LPS activation was evident compared to FATP1-EV (P <0.05). FATP1 over expression had no effect on cell size, viability, or growth(Figure A2 DeE).ACSL activity assays were performed on FATP1-EV and FATP1-OE M
F
s to ensure that the over-expressed FATP1 was functional. Total ACSL activity was increased by 20% in OE compared to FATP1-EV (P<0.05,Figure 4C). A 17% increase in fatty acid uptake was detected in FATP1-OE compared to FATP1-EV in the unstimulated state (P<0.01,Figure 4D). LPS activation increased fatty acid uptake by 2.3-fold in FATP1-EV, while FATP1-OE showed a 2.7-fold increase. Thus, fatty acid uptake in FATP1-OE was 36% greater than FATP1-EV in LPS-stimulated cells (P<0.0001,Figure 4D).3.7. FATP1 overexpression reprograms RAW M
F
s toward anAAM-like metabolic phenotype.
Figure 4: Overexpression of FATP1 in RAW264.7 MFs induced a substrate switch with enhanced lipid metabolism and reduced glucose metabolism resulting in blunted CAM-activation.Fatp1was stably over-expressed in RAW264.7 MFs (FATP1-OE) and controls were empty vector (FATP1-EV). A.Fatp1-6were measured by qPCR (n.d., not detected; ***P<0.001, *P<0.05). B. FATP1 Western immunoblot in unstimulated RAW264.7 (RAW) MFs, FATP1-EV, and FATP1-OE. Tubulin was used as a loading control. C. FATP1-mediated long chain ACSL activity was measured using14Ceoleate (*P<0.05). FATP1-EV and FATP1-OE were left untreated or stimulated for 24 h with 100 ng/ml LPS.
baseline, there were no significant differences in Glut1expression, however with LPS stimulation Glut1 expression was 39% lower in FATP1-OE compared to FATP1-EV (P<0.01,Figure 4E). Acute glucose uptake was reduced in FATP1-OE MVs, though this result did not reach statistical significance (Figure A2 G). However, long-term bio-energetics measurements demonstrated a significant 60% reduction in glycolytic rate in FATP1-OE M
F
s compared to FATP1-EV controls in both unstimulated and LPS-stimulated conditions (P < 0.01, Figure 4F). Glycolytic capacity was also significantly reduced with FATP1 overexpression to levels 60% of those in FATP1-EV (P<0.05, Figure 4G). In addition, FATP1-OE MF
s demonstrated a 23% reduction in glucose oxidation upon LPS-activation (P<0.05,Figure 4H). Finally, glycogen synthesis was unaffected by FATP1 expression in either unstimulated or LPS-activated MF
s (data not shown).3.8. FATP1 gain of function inhibited M
F
pro-inflammatoryresponse
To examine the consequence of FATP1-mediated alterations in metabolism on the inflammatory response in RAW M
F
, pro- and anti-inflammatory mediators in unstimulated and LPS-stimulated cells were examined. In direct contrast to expression patterns observed in Fatp1/BMDM, FATP1 overexpression significantly suppressed the induction of LPS-induced pro-inflammatory enzymeNos2(P<0.01, Figure 4I) and cytokine Tnf-a
(P < 0.01, Figure 4J). Hmox-1 expression was 2.3- and 2.8-fold higher in unstimulated and activated FATP1-OE, respectively (Figure 4K). Secretion of IL-6 and MCP-1 protein was significantly diminished in response to LPS stimulation in FATP1-OE compared to FATP1-EV (P < 0.01 and P < 0.05, Figure 4L and M, respectively). IL-1b
protein secretion was also significantly reduced in FATP1-OE compared to FATP1-EV (P<0.01, Figure 4N). AAM-markersMrc-1andArginase-1were not detectable in FATP1-EV and FATP1-OE cells in either the unstimulated or LPS-stimulated state.3.9. Metabolomic and lipidomic analysis demonstrated that FATP1 overexpression down-regulated glucose metabolic pathways and biomarkers of oxidative stress
Based on significant alterations to metabolism and inflammation, we next used metabolomics and lipidomics to query potential mediators or biomarkers associated withFatp1. Metabolomic profiling revealed that RAW264.7 M
F
s are highly metabolically active, especially in com-parison with BMDM, because they are proliferating as an immortalized cell line (Tables A1 and A2). In total, CAM activated upregulated 116 or 97 metabolites, with 25 or 56 downregulated in EV or FATP1-OE, respectively. In contrast to BMDM, RAW MF
s that were CAM stimulated greatly upregulated amino acid metabolism, did not downregulate dipeptides, and greatly increased metabolites in car-bohydrate metabolism and the Krebs cycle. CAM activated RAW MF
s also upregulated lipid metabolism including many fatty acid metabo-lites, glycerolipids, and sphingolipids (but downregulated lysolipids). RAW activation also increased pyridoxal metabolism, riboflavin meta-bolism and thiamine metameta-bolism, while BMDM did not regulate these metabolites.CAM stimulation of the RAW model altered the biochemical profiles of FATP1-EV and FATP-OE along parallel but distinct trajectories (supplemental Figure A4). Upon examining effects of FATP1 gain of function on metabolites, FATP1 overexpression resulted in an up-regulation of 40 and down-up-regulation of 73 metabolites in unstimu-lated RAW cells, while CAM activation resulted in up-regulation of 38 and downregulation of 120 metabolites in FATP1-OE compared to FATP1-EV (Table A2, and P values within). Regardless of activation
state (unstimulated or CAM activated), examples of metabolites significantly downregulated by FATP1-OE included glutamate and glutamine, reduced glutathione (GSH), glucose, 3-phosphoglycerate, PRPP, UDP-glucose, citrate, butyrlcarnitine, choline phosphate, pal-mitoyl sphingomyelin and stearoyl sphinomelin, inosine, and AMP (Table A2, and P values within, a subset are highlighted in pathway in supplemental Figure A9 A). Examples of metabolites significantly upregulated by FATP1-OE (regardless of activation state) include pyroglutamine, gamma-aminobutyrate (GABA), imidazole propionate, 3-(4-hydroxyphenyl)lactate, 5 aminovalerate, 4-guaninobutanoate, sorbitol, ribitol, 2-hydroxyglutarate, deoxycarnitine, 2-dehydrocarnitine, acetylcarnitine, ethanolamine, choline, 5-methyltetrahydrofolate, and riboflavin vitamin B2 (Table A2, and P values within, and pathwaysupplemental Figure A9A). Furthermore, regardless of activation, several fatty acids were downregulated, including essential fatty acids (docosapentaenoate (n3 DPA; 22:5n3), docosapentaenoate (n6 DPA; 22:5n6), docosahexaenoate (DHA; 22:6n3)), stearate (18:0), arachidonate (20:4n6), and adrenate (C22:4n6), reaching significance in CAM-stimulation for all fatty acids listed, with the exception of adrenate, which reached significance in both unstimulated and stimulated states. Of note, arachidonate (20:4n6) was essentially undetectable in FATP1-OE after CAM stimu-lation. Interestingly, not every long chain fatty acid was downregulated; eicosenoate (20:1n9 or 11) and docosatrienoate (22:3n3) were upre-gulated. Finally, intracellular lipid metabolite 9-hydroxy-10,12-octadecadienoic acid (9-HODE) was essentially undetectable in unstimulated cells but was significantly 3-fold increased in activated FATP1-OE CAM stimulated cells (P¼0.0001 for EV vs. FATP1-OE,Figure 4O).
When cells were CAM activated compared to unstimulated, FATP1-EV controls upregulated metabolites in the Krebs cycle including citrate, succinate, fumarate, and malate, while FATP1-OE downregulated these metabolites (Table A2, supplemental Figure A9 A). In contrast, many lysolipids were upregulated with CAM stimulation in FATP1-OE that were not regulated or downregulated in control EV cells, including 1-palmitoylglycerophosphocholine, and 1-stearoylglycero-phosphocholine. In line with radiotracer and bioenergetic data, FATP1-OE demonstrated significant down-regulation of glucose in both unstimulated and CAM-activated cells. PPP metabolites including phosphoribosyl pyrophosphate (PRPP), 6-phosphogluconate, xanthine, inosine, and UDP-glucuronate were at lower concentrations in CAM-activated FATP1-OE compared to CAM-CAM-activated FATP1-EV controls (Table A2, supplemental Figure A9 A).
2-aminoadipate (supplemental Figure A10 AeC, P¼0.01, 0.0001, and 0.0001, respectively).
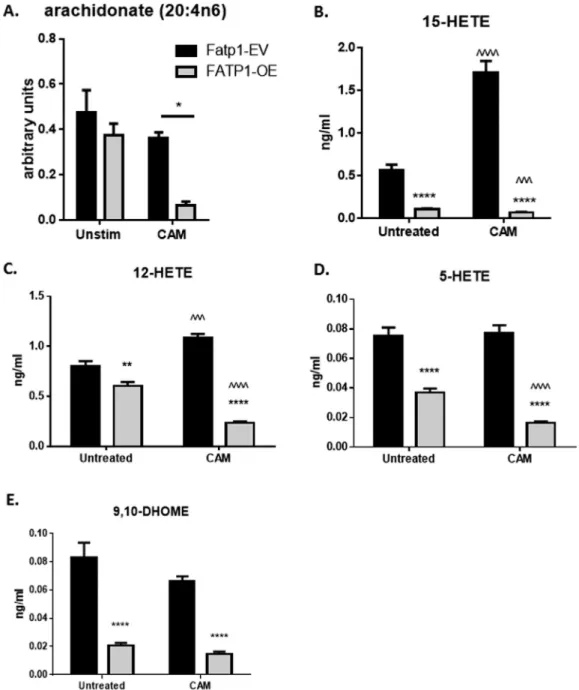
3.10. FATP1 overexpression reduced free arachidonic acid and certain eicosanoid synthesis
Because FATP1 is a long and very long chain ACS, we next investigated long chain fatty acids including arachidonic and lineolate acid and eicosanoid metabolism in our RAW control and gain of function model. Significant alterations in arachidonate (20:4n6) were evident in FATP1-OE lysates using metabolomic analysis with an 85% reduction when FATP1 was over expressed (P < 0.05 FATP1-EV vs. FATP1-OE, Figure 5A). Hence, we investigated eicosanoid metabolism in our RAW control and gain of function model. Arachidonate metabolites including
15-HETE, 12-HETE and 5-HETE were significantly downregulated in the media by overexpression of FATP1 (P <0.0001 in both unsti-mulated and CAM activated cells,Figure 5BeD). Linoleate (18:2n6) was significantly upregulated by 50% in FATP1-OE in unstimulated cell lysates (P<0.05,Table A2) and non-significantly downregulated by 20% in CAM activated cells. When media was examined from the same cells, FATP1-OE significantly downregulated linoleate metabolite 9,10-diHOME (P<0.0001,Figure 5E andTable A3).
3.11. FATP1variants are associated withFATP1expression levels
in human adipose
We searched public databases for genetic variants located within 1 Mb of FATP1 that were associated with FATP1 expression (eQTLs) in
human adipose tissue. The Multiple Tissue Human Expression Resource (MuTHER) study of 856 female twins showed the strongest eQTL forFATP1with rs9137 (P¼1.31013), which is located in the 30UTR ofFATP1. In the METabolic Syndromes In Men (METSIM) study of 1,381 men, the strongest association with adiposeFATP1 expres-sion was observed for rs3212793 (P¼1.8104), locatedw300 kb downstream of theFATP1gene. These results demonstrate thatFATP1 levels vary between individuals and that these and/or other nearby variants may be involved in the regulation ofFATP1expression.
4. DISCUSSION
Over the past 35 years, the prevalence of obesity has increased in both Western nations and globally [63]. Immune-based therapies offer promising interventions for obesity induced Type 2 Diabetes[64,65] including several approaches aimed at increasing insulin sensitivity by blocking the action of inflammatory mediators. Specifically, previ-ous reports implicate IL-1
a
, IL-1b
, TNFa
, MCP-1 (CCL2), and IL-6 [64e70]. Our previous work demonstrated that modulating bioactive lipid generation and trafficking in MF
s is an effective tool against obesity, insulin resistance, and diabetes[71e73]. Thus, we hypoth-esized that maintaining sufficient lipid metabolism by modulating transport and metabolism of specific fatty acids would suppress ATM-mediated inflammation and preserve metabolic health. FATP1 is a fatty transporter through its capacity to trap long and very long chain fatty acids intracellularly via its ACSL activity. ACSL-mediated generation of acyl-CoAs targets fatty acids to certain metabolic fates, which may participate in the regulation of inflammation. Herein, to study FATP1 in MF
biology, complementary ex vivo BMDM loss-of-function and in vitroRAW MF
gain-of-function models as well as LFD- and HFD-exposed mice were used to elucidate the metabolic and mechanistic alterations stemming from modulation ofFatp1expression.BMDM and RAW M
F
s express onlyFatp1andFatp4. No compensatory expression of other Fatp gene family members was detected in response to loss of FATP1. Therefore, total ACSL activity was signifi -cantly reduced in Fatp1/ BMDM, demonstrating that while other ACSLs are present to activate fatty acids, such as ACSL1[74], there was a lack of enzymatic compensation overall. Metabolic and bio-energetics analysis ofFatp1/BMDM demonstrated that along with reduced ACSL activity, deletion ofFatp1resulted in blunted fatty acid uptake and oxidation, particularly in AAM-activated BMDMs, which are established to be more fatty acid-dependent. Findings of reduced fatty acid uptake and oxidation occurred even in the setting of elevated oxygen consumption rate inFatp1/compared toFatp1þ/þBMDMs, suggesting that there was no global defect in mitochondrial capacity. In fact, anapleurotic substrates and BCAA were decreased in CAM-activatedFatp1/ BMDM, which could have driven and sustained the observed elevated mitochondrial respiration. Importantly, deletion ofFatp1reprogrammed MF
s: a shift in metabolism toward increased carbohydrate metabolism was detected. Notably, increased Glut1, glycolysis and PPP metabolites were evident. Furthermore, both glycolytic rate and capacity were inversely proportional to ACSL ac-tivity. Less lactate was detected inFatp1/BMDMs, corroborating the increase in extracellular lactate as measured by ECAR. Taken together, greater OCR, ECAR, and glycolytic metabolites indicated that Fatp1/MF
s have a higher energetic status compared toFatp1þ/þ MF
s [75]. Deletion of Fatp1 fundamentally altered an aspect of mitochondrial, biogenesis, function or activity of the electron transport chain, perhaps uncoupling, which is under further investigation. Spearman correlation analyses revealed a significant inverse correla-tion between glycolytic rate and fatty acid oxidacorrela-tion, demonstrating thecompensatory responsiveness of these pathways, or metabolicfl exi-bility, in response to lack ofFatp1. The shift from fatty acid oxidation to increased glycolysis appears to create a more CAM-like phenotype of M
F
lackingFatp1. Indeed, lack ofFatp1resulted in increasedNos2 expression, a hallmark of CAM activation, as well as reduced Arginase-1expression, a classic AAM marker, andheme oxygenase 1, an anti-inflammatory enzyme. CAM induction of iNOS and NO production leads to NO-mediated downregulation of the electron transport chain, providing a direct link between inflammation and metabolism[23]. In sum, data suggest that while the lack of Fatp1 appears to activate mitochondrial activity, specific defects in fatty acid uptake and oxidation are linked to the inflammatory phenotype in the MF
. Sinceex vivoBMDM studies were supportive of FATP1 reducing pro-inflammatory activation of MF
, the role of FATP1 in diet-induced metabolic dysfunction was investigated next. Using a model of HFD-induced weight gain, we investigated the contribution of MF
FATP1 to inflammation and glucose tolerance. ATMs isolated from obese adipose expressed greater Fatp1 than ATMs from lean mice, demonstrating the relevance of this transporter to obesity-associated MF
function and lipid trafficking. Importantly, ATMs isolated from mice fed HFD demonstrated that, in the absence ofFatp1, ATMs were polarized towards CAM phenotype and less towards AAM. Thus, we provide evidence that Fatp1B/ ATMs fail to maintain the AAM phenotype and are skewed towards CAM compared to Fatp1Bþ/þ ATMs, akin toin vitroloss of function BMDM studies. A detailed time course would be ideal to understandFatp1’s regulation on AAM and CAM ATMs during obesogenesis.In striking contrast to the total-bodyFatp1/mice[29,30], we report that chimeric mice harboring M
F
that were deficient inFatp1were more susceptible to diet-induced metabolic dysfunction including greater weight gain and adiposity, hyperglycemia, and glucose intol-erance compared to diet-matchedFatp1Bþ/þmice. Impaired glucose tolerance occurred in the setting of noFatp1-mediated differences in ITT, islet morphology, insulin signaling capacity, plasma insulin levels, or calculated HOMA scores. It is possible that the discrepancy between impaired glucose tolerance with no detectable impairment of ITT was due to the timing of the GTT at 19 weeks, while the ITT and plasma measures that occurred at sacrifice did not occur until 20 and 23 weeks on diet, respectively, when Fatp1-mediated effects may have been lost. In the LFD-fed lean state, no significant Fatp1-mediated effects were observed, demonstrating that HFD-induced stress was necessary to observe the phenotype. Importantly, there were no sig-nificant differences in circulating immune cell population numbers by hematologic andflow cytometric analysis in cells isolated from whole bodyFatp1/mice compared toFatp1þ/þ, demonstrating that FATP1 does not likely play a strong role in hematopoiesis. There were also no differences in metabolic activity such as RER in LFD- or HFD-fed mice in aFatp1-dependent manner. Taken together, dietfindings indicate that MF
FATP1 plays a specific role in limiting HFD-induced metabolic dysfunction through local tissue homeostasis when deficiency is restricted to MVs. The role of ACS activity in MF
has been reported in only one other model. Deletion of ACSL1 protected againstthe CAM phenotype in diabetes and atherosclerosis [74]. Importantly, our directly opposedfindings in our chimeric model highlight the existence of non-redundant roles for ACSLs within MF
s.irradiation and diet exposure did not lead to a greater weight gain differential between LFD- and HFD-fed wildtype-transplanted mice. Still, wildtype-transplanted HFD-fed mice developed larger fat pads by weight, greater fat mass by MRI, higher leptin, and had reduced RER, as well as blunted insulin signaling by Western immunoblot. Perhaps if a different diet, such as a sucrose-free LFD, a higher percent fat HFD, or a different diet exposure time course were chosen, then there would have been greater differences in weight gain and exaggerated FATP1-mediated metabolic dysfunction. Our results beg the question of M
F
-specific FATP1 effects, especially in an inducible manner. Thus, future directions include studying FATP1-mediated effects specifically on ATMs. Althoughin silicoanalysis using the ImmGen Project suggested that FATP1 is only detected on MF
s and plasmacytoid dendritic cells [35], it is possible that T, B or other granulocytes could expressFatp1 at high levels in an obesity-dependent manner, which further supports the need for additional studies using MF
-specific Fatp1 over-expression and deletion.MVFATP1 may affect adipogenesis and systemic glucose metabolism in several ways. First,Fatp1B/mice fed a HFD accumulated excess white adipose mass that was characterized by excessive CLS forma-tion, M
F
infiltration, and inflammatory cytokine production. CLS are classic histologic markers of adipose inflammation and obesity asso-ciated with the metabolic syndrome[4]. Xu et al. have argued that adipose tissue inflammation is influenced to a greater extent by sheer MF
number rather the phenotype of those MF
s[11]. Herein, we report an approximately 2-fold increase in MF
marker expression, a 3-fold increase of CLS, and an overall shift toward a CAM phenotype in the absence ofFatp1 (represented by a doubling of Il-1b
and 3.7-fold higherIl-6expression) in HFD-Fatp1B/adipose tissue suggesting that both MF
number and ATM phenotype were affected by FATP1 expression. In addition, data support that FATP1 plays a role in limiting both priming and activation of the NLRP3 inflammasome, which is an established regulator of inflammation. Obesity activates the NLRP3 inflammasome, a nutrient sensor and potent regulator of the innate immune system, leading to insulin resistance and diabetes[76]. The NLRP3 inflammasome is activated by a“two-hit”process initiated by many metabolites and other stimuli, thereby inducing CASPASE 1-mediated cleavage of pro-IL-1b
to active IL-1b
[76]. Once secreted, IL-1b
induces production of cytokines and chemokines including IL-6, IL-8, TNFa
, and monocyte chemoattractant protein 1 (MCP-1, or CCL2), which collectively promote further MF
activation and migration [70]. Transcription of the NLRP3 inflammasome components and its productIl-1b
was significantly increased in adipose from HFD-fed Fatp1B/compared to controls.Oxidative stress is another hallmark of obesity. ROS are signaling cascade second messengers known to enhance expression of pro-inflammatory mediators. We and others have shown that persistent activation of ROSegenerating pathways results in increased oxidative damage[20,77,78]. Using targeted metabolomics and immunohisto-chemistry, we detected increased adipose oxidative damage in HFD-fedFatp1B/mice with reductions in small molecule biomarkers of oxidative stress including methionine sulfoxide, cysteineglutathione disulfide, and 2-aminoadipate in FATP1-OE. Methionine sulfoxide is a product of methionine oxidation and is a biomarker of oxidative stress [79]. Aminoadipic acid (2-aminoadipate) is a lysine breakdown metabolite that is a biomarker of oxidative stress and predicts diabetes risk[80e83]. Cysteineglutathione disulfide is a derivative of gluta-thione and can generate S-glutathionylation, a signaling molecule for oxidative stress[84]. Furthermore, it is possible that the high iNOS expression in the absence ofFatp1reported herein in BMDMs will also be found in ATMs and would explain the significant increase in
oxidative damage detected in HFD-fedFatp1B/adipose, which will be investigated future studies.
Comprehensive metabolic analysis of FATP1’s effect on M