ADAPTIVE ELECTORAL MANIPULATION IN HYBRID REGIMES: A Multi-Level Analysis of Vote-Buying and Ballot-Rigging in the 2011 Russian Election
Cole J. Harvey
A thesis submitted to the faculty of the University of North Carolina at Chapel Hill in partial fulfillment of the requirements for the degree of Master of Arts in the Department of Political Science.
Chapel Hill 2013
ii Abstract
COLE J. HARVEY: Adaptive Electoral Manipulation in Hybrid Regimes: A multi-level analysis of vote-buying and ballot-rigging in the 2011 Russian election
(Under the direction of Graeme Robertson)
Elections have become a commonplace feature of authoritarian regimes, yet the dynamics of such elections remain murky. Do authoritarian governments employ different strategies under different conditions to manipulate elections? This article considers the conditions under which electoral authoritarian regimes employ two such strategies, vote-buying and ballot-rigging. I propose new measures of vote-buying and ballot-rigging, and examine the correlates of each strategy using a multilevel analysis of data from the 2011 election in Russia’s regions. I conclude that authoritarian regimes adapt to varying political conditions, and employ ballot-rigging strategies in places where the regime has a high degree of control over the political system. Vote-buying, by
iii
ACKNOWLEDGEMENTS
iv
TABLE OF CONTENTS
LIST OF TABLES……….v
LIST OF FIGURES………..vi
Introduction………1
Theory………3
Research design……….7
A measure of vote-buying………..9
Explanatory variables………...17
Measuring ballot-rigging using a last-digits test………..20
Multi-level model of vote-buying effectiveness………..22
Results and interpretation………23
Conclusion………...31
APPENDIX………..36
v
LIST OF TABLES
Table
1. Predictors of estimated ruling-party vote-share in the absence of nonstandard
votes……….25
2. Predictors of vote-buying effectiveness………...26
vi
LIST OF FIGURES
Figure
1. Nonstandard vs. United Russia vote-share, Kabardino-Balkaria……….13
2. Nonstandard vs. United Russia vote-share, Pskov………...13
3. Fraud vs. vote-buying effectiveness………28
4. Russia ethnicity vs. vote-buying effectiveness………29
5. Competitiveness vs. vote-buying effectiveness………...29
6. Petrov democracy scores vs. vote-buying effectiveness………..30
7. Fraud score vs. gap between nonstandard and standard votes for United Russia……40
Introduction
In many countries in the modern world, multiparty elections take place within a political environment that severely restricts the ability of opposition parties and candidates to win office. In these hybrid, or competitive authoritarian regimes, the ruling party submits itself to regular judgment from the voters, but in a setting where the outcome is heavily biased toward incumbents (Levitsky & Way, 2010). The contradiction raises an interesting puzzle: if the outcome of the election is all but pre-determined, how do political machines in such countries motivate enough voters to both ensure the regime’s victory and avoid an embarrassingly low turnout? While authoritarian rulers may earn a certain level of genuine popularity among voters, they have several tools at their disposal to inflate their support at the ballot box, including vote-buying and behind-the-scenes ballot-rigging.
In this study, I develop a theory of when authoritarian regimes opt for ballot-rigging, and when they must adopt a less efficient vote-buying strategy. To test this theory, I employ new measures that infer vote-buying and ballot-rigging using statistical analysis of electoral data. This is a departure from earlier studies of electoral manipulation, which have often used general allegations of fraud as the dependent variable. Using these measures, I test this theory using electoral data from the 2011 parliamentary election in Russia. Making use of
information from more than 94,000 precinct-level returns available from the Central Election Commission of the Russian Federation, I conduct a multilevel analysis of electoral
2
from evidence of ballot-rigging, and evaluate the correlates of each brand of election management. I argue that because vote-buying is costly and inefficient, there is a trade-off between the two strategies. Authoritarian governments prefer to rely on ballot-rigging, but such a strategy cannot be employed when political competition is high and the risk of exposure elevated. As a result political machines tend to favor vote-buying over ballot-rigging in more competitive settings.
This theory has implications for two strands of research. First, it will help illuminate the sometimes murky internal operation of hybrid regimes. Much of the analysis of such regimes has focused what causes such regimes to democratize. Comparatively less work has sought to uncover the domestic mechanisms by which such regimes perpetuate themselves, even while permitting open competition for office. This study helps illustrate one of the ways in which authoritarian regimes can be ‘competitive’ without undermining the regime itself,
by marshaling resources to motivate voters in competitive districts. Secondly, separating vote-buying from ballot-rigging will help clarify some contradictory findings with regard to election manipulation and competitiveness in the literature on electoral fraud, which arise from the conflation of multiple election-management strategies into a single measure.
3
Theory: Hybrid regimes, electoral misconduct, and political control
As elections have become a defining feature of authoritarian governments, scholars have paid increasing attention to the dynamics of party competition in authoritarian regimes. This strand of research is motivated by the desire to understand what functions are performed by elections and political parties in settings where those institutions do not directly determine the direction of policies or the fate of incumbents (Geddes, 2006). Authoritarian elections have been shown to benefit rulers in a variety of ways. Multi-party elections allow
authoritarian rulers to co-opt the opposition (Gandhi & Przeworski, 2007), and channel their demands into the structured setting of the legislature (Gandhi & Przeworski, 2006). Elections can also be used as an information-gathering device for authoritarian leaders, or to deter elite defections by demonstrating overwhelming support for the regime (Magaloni, 2006). They, along with ruling parties, can be a means of binding together elites and managing elite disagreements (Brownlee, 2007). Elections can also serve as a recruitment mechanism, whereby authoritarian rulers distribute patronage resources to those lower-level politicians who are best able to deliver votes in favor of the regime (Lust-Okar, 2006).
Despite this increasing attention paid to the politics of hybrid and electoral authoritarian regimes, relatively little work has been done to uncover how exactly ruling groups manage elections in such systems. Given a number of tools with which to tilt the electoral scales in their favor (Schedler [2002] lists seven), when do political machines in hybrid regimes choose to engage in different strategies? This paper will focus on two strategies in particular, both of which occur at election time. The first, vote-buying, refers here to attempts by local political operatives to purchase a citizen’s vote through either direct
4
payments, but can also include other material rewards. Negative inducements can include threatening a voter with the loss of a job, expulsion from housing, and so on, unless the voter casts his or her vote correctly. The second strategy, ballot-rigging, refers to the manipulation of vote-counts by election officials in order to boost the ruling group’s share of the total. These kinds of interference at election time are often both illegal and out of public view, making them more difficult for researchers (and citizens) to detect and analyze.
If ballot-rigging is feasible, political machines can directly control the election by directly manipulating the results. By contrast, vote-buying allows them to tip the probability of winning in their favor by increasing the number of actual votes cast for their party or candidate. The first strategy, ballot-rigging, is preferred by virtue of its cost-efficiency (Lehoucq 2007) and certainty. Controlling a small number of election workers is cheaper than buying off large numbers of voters: in a study of Costa Rica’s elections in the first half of the twentieth century, Lehoucq & Molina (2002, pp. 159, 169) find that a major vote-buying effort in a presidential election could cost as much as twenty percent of a major candidate’s budget. Second, ballot-rigging provides guaranteed results. By contrast,
vote-buying is a messy and inefficient strategy. In the absence of strict monitoring, some voters may take the machine’s payment while nevertheless voting for a different party. One study of
5
represents a real loss of resources, and risks not generating enough votes to win the election. Finally, Sjoberg (2012) shows evidence that authoritarian regimes adapt their electoral manipulation strategies to fit the circumstances: when faced with observers in the polling place, he finds, authorities in Azerbaijan and Georgia were able to shift their manipulation efforts to the street or to the counting room (p. 34).
I therefore argue that ballot-rigging is a political machine’s preferred strategy. By its nature, however, it requires greater control of the political system to execute successfully. If publicly exposed, ballot-rigging calls the entire electoral process into question and threatens the legitimacy of the leadership. Vote-buying, by contrast, can be more easily blamed on overzealous party activists, or justified by the alleged vote-buying activities of other parties. In other words, I assume that the cost of being exposed in a ballot-rigging strategy is higher than the cost of being exposed in a vote-buying strategy. Additionally, election rigging requires the complicity of the vote counters. This is easier to obtain when the political dominance of the ruling party is unquestioned. Where the ruling party is the primary source of political patronage, this dominance reduces the likelihood that election workers would balk at falsifying returns.
6
vote-buying strategy if they have the means to manipulate the vote directly. Second, there should be a negative correlation between ballot-rigging and indicators of political
competitiveness, since in more competitive regions political machines will lack the control necessary to pull off such a strategy. I still expect ballot-rigging to occur in the least competitive regions, even though the regime is not likely to lose the election there, since fraud can be used to give the appearance of heavy turnout, and to deter potential competitors (Magaloni 2006). Third, there should be a corresponding positive correlation between vote-buying and indicators of competitiveness. If the authorities are unable to manipulate the vote directly in such regions, they must adopt an indirect strategy such as vote-buying, since it is in the competitive regions that the ruling party is most likely to lose.
As mentioned above, previous work on electoral fraud often relies on formal post-election accusations of fraud (e.g., Anderson 2000, Lehoucq & Molina 2002, and Ziblatt 2009) as a dependent variable. This approach uses a measure that encompasses a variety of misdeeds, including vote-buying, coercion, and ballot-rigging, and thus does not distinguish between various vote-manipulation strategies. If, as Lehoucq (2007) argues, ruling parties engage in different strategies under different conditions, this type of measure can provide unclear or contradictory reports across studies. In addition, if the allegations are filed by losing parties, the measure may report a spurious relationship between fraud and the
7
Magaloni 2006), and that the relationship between competition and fraud is contingent on political institutions (Lehoucq & Molina 2002, Birch 2007).
The study presented here helps resolve the ambiguity within these two strands of research. It does not rely on accusations of electoral misconduct, but infers fraud statistically from the extensive data available in precinct-level elections returns from Russia. While this approach is still not a direct measure of electoral misconduct, it improves upon allegation-based measures by disaggregating evidence of vote-buying from evidence of ballot-rigging and by removing the potential bias introduced by losing parties’ reporting incentives. Second,
this sub-national comparative study of Russia’s regions holds institutional factors constant.
In addition, this study provides a new approach to measuring vote-buying. Much earlier research on vote-buying has relied on surveys to determine which voters are targeted by political operatives in vote-buying operations (eg. Stokes 2005; Nichter 2008; see
Schaffer 2007 for a review). Survey-based research can be prone to under-report vote-buying, since respondents may be reluctant to admit to participating in an activity with such negative connotations (Gonzalez-Ocantos et al, 2011). Here I attempt to measure the overall
pervasiveness of a vote-buying effort, rather than which individual voters are targeted.
Research design
8
ballot box. I use this information to conduct a multilevel analysis of the correlates of an effective vote-buying operation.
Russia is in many ways an excellent case for the study of election management in a hybrid regime. Elections are high-stakes affairs because they are the only legitimate route to political power, and are tightly managed by the incumbent elite. Russia is large and diverse, and its regions vary considerably in terms of support for the ruling party, average per capita income, ethnic makeup, and other socio-economic factors. Crucially, the uniform, pyramidal nature of Russian politics in the Putin-era makes Russia an ideal case for this study. President (and Prime Minister) Putin has made major investments in party building, turning United Russia into the dominant party in the Duma and in the regions, as well as the major conduit of political patronage and recruitment into the elite (Reuter 2010). Since no regional
governorships or legislative majorities were held by opposition parties, an analysis that looks for suspicious voting patterns with regard to United Russia can be applied in all regions, maximizing the amount of information available.
9
comparison of highly similar units, while still allowing for results that can be generalized. Since regional and national leaders in authoritarian regimes face similar incentives, the theory outlined above is applicable in both subnational and cross-national settings. Russia is well suited as a test case, falling roughly in the middle of the spectrum of competitive authoritarian cases.1
A measure of vote-buying: the absentee ballot and the mobile ballot box
Russian electoral law allows citizens to cast an absentee ballot to vote at a polling place that is not their own. Such a provision allows voters to cast multiple ballots, and provides mid- and low-level patrons with a means of monitoring their clients’ voting behavior. The Russian election-monitoring group Golos wrote in its report on the 2011 election that,
As in the previous federal election, a large number of reports concerned coercion to obtain absentee ballots. At best, such coercion was a manifestation of the struggle for voter turnout, but in other cases it was associated with a desire to control the vote, or even falsify it. (GOLOS 2011, chapter 8)
The report described examples of the abuse of the absentee provision, some of which are reproduced here.2
“On December 1, at Kindergarten No. 620 of the Central District, a meeting was held in which employees were compelled to take absentee ballots in order to vote on school grounds. It was said that otherwise the district would be cut off from funding, but that voting by absentee would be rewarded with cash bonuses and time off. The party for which it was necessary to vote was not directly named, but it was pointed out that [Duma] Deputy S. Shatunovskii (a member of United Russia) had done a lot for the district and it was necessary to support him (St. Petersburg).”
1
Using the Polity IV measure, for example, Russia in 2011 was more democratic than Morocco (-4), Tajikistan (-3), and Venezuela (-3) but less democratic than Georgia (6) and Ukraine (6). Russia was on par with Nigeria (4).
2
10
“On December 2, the director [of a construction company] brought together the staff and announced that Saturday (December 3) would be a day off, but that Sunday [Election Day] would be a working day. All were instructed to obtain absentee ballots on Saturday and to vote at the workplace—strictly for United Russia, under penalty of dismissal (Nizhny Novgorod).”
The absentee ballot enables the leaders of firms and institutions to compel their subordinates to vote en masse and under their supervision. In addition, it also permits citizens to cast multiple votes, often in the pay of a political machine. Two examples from Golos are below.
“An acquaintance proposed that we meet tomorrow at 8:30 in the morning, in order to spend all day riding on buses and voting by absentee ballot for United Russia. For this work they promised to pay us, and to provide food and drink. They asked us to bring as many people as possible with Russian passports.”
“The other day my friend went to the training for observers from United Russia. In the group were ten people; they pay them ten thousand rubles [approximately $300] so that, on election day, having received absentee ballots, they would ride around in a special car to 37 polling places and vote for United Russia….And this is not the only such voting group!”
As these anecdotes illustrate, the absentee ballot helps facilitate so-called “carousel” voting, where United Russia voters are shuttled from one polling place to another.
Another form of absentee voting permitted in Russia is the mobile ballot box. Russian law permits voters who are unable to leave their homes to request that a ballot box be
11
voting before the mobile ballot boxes were opened (GOLOS 2011, chapter 8). Mobile votes make up an increasingly large portion of the electorate. In 2011, mobile votes accounted for 6.6% of votes cast, the most of any Duma election (GOLOS 2011, chapter 9). Voting via the mobile ballot box was more than three times as common as voting by absentee, which accounted for just shy of two percent of total votes.
Given the evidence from election-monitoring groups that highlights the potential for abuse of mobile ballot boxes and absentee voting, I argue that the two can be combined into a single measure I call nonstandard votes. I construct the combined measure, Percent
Nonstandard, by adding the number of votes recorded at mobile ballot boxes to the number of absentee voters at each station, and dividing this sum by the total number of votes (valid plus invalid) in each precinct.
A large percentage of nonstandard votes itself does not indicate vote-buying. Rather, it is the relationship between the percentage of nonstandard votes and the percentage support for United Russia that is telling. I propose a new measure, in the form a regression coefficient describing the relationship between nonstandard voting and support for the ruling party, that can be used to estimate authoritarian ruler’s reliance on vote-buying to boost their showing at the ballot box. In this study, I use a multi-level regression model, described below, to
estimate this measure and determine the effectiveness of vote-buying efforts in each of Russia’s 83 regions. In a region where vote-buying is an important aspect of machine
12
is associated with an average increase in United Russia’s overall support of one percent.
Since nonstandard votes are only a portion of overall votes, such a correlation indicates that United Russia’s share of the nonstandard votes far outpaces its overall share of the vote in
that region.
I do not claim that all votes cast by nonstandard means are bought votes; certainly legitimate voters may make use of the practice. Nor do I argue that this measure captures all of a regime’s efforts to inflate the number of ballots cast in its favor. A voter can be paid to vote once at his or her regular polling place; such manipulation of ‘standard’ votes is not
covered here. In addition, this measure does not cover more entrenched, durable forms of clientelism that rely on clients dutifully casting standard votes without much prodding from patrons. However, I do suggest that a strong, positive correlation between nonstandard votes and the ruling-party’s vote share can be taken as an indicator of ballot-stuffing in the form of vote-buying and/or voter intimidation, and is indicative of wider efforts to indirectly
influence election outcomes.
I use two regions as examples below, to illustrate how the relationship between nonstandard votes and United Russia’s vote-share can be used to evaluate a vote-buying effort. One region, Kabardino-Balkaria, is an ethnic republic in the Caucasus which saw almost no nonstandard votes but very high support for United Russia overall. Pskov, a region on Russia’s western border, recorded a very high number of nonstandard votes, and low
13
relationship can be detected in Pskov.3 However, in Kabardino-Balkaria the relationship is negative, and highly affected by outliers.4 Each point represents a precinct.
Figure 1
Figure 2
The misuse of absentee voting and the mobile ballot box has been documented in the 2011 Duma election, which provides an important justification for using non-standard votes
3 The regression coefficient comparing percent nonstandard to United Russia’s percent vote in Pskov is .41
with a standard error of .02. The mean percentage of nonstandard voting as a share of total votes was approximately 30 percent.
4 In Kabardino-Balkaria, the coefficient is -.12, the standard error is .01, and the mean nonstandard percentage
14
as a proxy for vote-buying. In the more general sense, however, non-standard votes are simply a special form of turnout. As Myagkov et al (2009) write, in a clean election with homogeneous districts, increasing turnout should not be positively correlated with an increased vote-share for any particular candidate or party. Non-standard votes, though, are not drawn from the population as a whole, but from subsets—people who are ostensibly away from their home polling place (absentee ballots), or unable to reach the polling place (mobile ballot box ballots). As a result, analyzing the relationship between non-standard votes and United Russia’s share of the vote requires the use of control variables.
Ideally such control variables would be found at the precinct level. If it were known, for example, how many pensioners were living in each precinct, it would be possible to control very precisely for the effect of elderly residents on the relationship between
nonstandard voting and support for the ruling party. Unfortunately such precise data does not exist, and as a result all of the control and explanatory variables used in this study are taken at the regional level. These regional-level variables will not help explain variation within regions, but between them. This is appropriate, however, since regional variation in the relationship between nonstandard voting and support for the ruling party is the question of interest. The control and explanatory variables used are described in detail below.
The mobile ballot box is primarily meant to be used by the elderly and by those in hospitals. Consequently, I include a regional level control variable Pensioners in the second-level of the model. This variable is the number of pensioners in each region, per 1000 residents, as of 2010 (Russian State Statistical Service 20115). The pensioners variable does
15
double duty, since the elderly are also more likely to find themselves in hospitals on election day.
No data is available on what types of voters might be more inclined to vote by absentee in the Russian context. However, studies in the United States have shown statistically significant effects for age and level of education on propensity to vote by absentee (Karp & Banducci 2001, Dubin & Kalsow 1996), along with income (Barreto et al 2006). Old age is captured by the Pensioners variable described above. Education is
measured using the variable Higher Education, which is the number of people in each region who have completed tertiary education, per 1,000 population (2010 Russian Census).6 Per capita income is the average income of each region in rubles as of 2010 (RSSS 2011).7
I also control for those factors that have been identified as important in the literature on vote-buying and clientelism. Poverty, low education, and low economic development have all been identified as factors that can make an individual more susceptible to vote-buying appeals. Poor people face more pressing immediate needs, and therefore are more inclined to prefer an immediate reward in exchange for their vote over the distant benefits of policy change (Brusco et al., 2004). Likewise, they may have fewer educational resources and be less equipped to understand and evaluate programmatic appeals (Kitschelt and Wilkinson 2007, pp. 25-26). I therefore include a measure of Poverty, the percentage of citizens with incomes falling below the official poverty line (RSSS 2011), along with the higher education variable described above.
6
Specifically, the Russian degrees of ‘bakalavr,’ ‘spetsialist,’ and ‘magistr’ as of 2010.
7 Values for Income and Poverty were imputed for one region, Chechnya, using the ‘mi’ package for R (Yu-Sung
16
Monitoring voters’ actions is easiest in small, densely-knit communities (Stokes
2005). In polities with large populations, the political machine must not only deploy more resources to purchase a relevant share of votes, but must also monitor voters across larger, more diffuse networks (Hicken 2007). Large districts are predicted to pose a challenge to vote-buying efforts, and so I include each region’s Population in thousands (RSSS 2011). Additionally, the structure of the economy in a particular polity can influence both the susceptibility of voters and the ease of monitoring by patrons. Large public sectors provide government officials with resources—such as jobs, funds, and administrative assets—to distribute, and the ability to directly oversee a large swath of voters (Kitschelt & Wilkinson 2007, p. 36). The same can be said of economic concentration generally. The more
centralized an economy is, the more influence particular industries may be able to wield over their employees (Hale 2007, p. 235). I include two variables to control for these effects. The variable Government Employment reflects the number of regional and municipal government employees in each region per 10,000 residents (RSSS 2011). Economic Concentration is constructed using statistical data that reports the percentage share of regional economies attributed to each of fifteen economic sectors: agriculture, mining, manufacturing, retail, and so on (RSSS 2011). The variable is the sum of the squares of those percentages.8
I also include two variables to control for the availability of media in each region. In a study on clientelism in Russia in 1999, Hale (2007) includes measures of TV and newspaper coverage as indicators of development. I likewise make use of a Newspaper variable, which refers to the number of copies of newspapers published per 1,000 residents (RSSS 2011).
8
17
However, as of 2010 there was almost no variation in broadcast television coverage across Russia. As an update to Hale’s approach, I exclude a television variable, but add a measure ofInternet access: the percentage of organizations in each region that reported regular use of the Internet (RSSS 2011).9
Explanatory variables
The theory outlined above predicts that vote-buying will occur in places where the regional political machine lacks the control necessary to implement a ballot-rigging strategy. I operationalize such control in three ways. One measure is Competitiveness, which is defined as the difference between the leading party’s share and the second-place party’s vote-share in the most recent regional election. The difference between the two parties is then subtracted from one, so that a high score indicates a higher degree of competitiveness. Readers will reasonably be concerned that this measure, being derived from electoral
competition (albeit at a different level), is endogenous to the phenomenon of interest. I hope to address this concern as follows.
First, recall that the object of interest in this study is the effectiveness of vote-buying, modeled by regression coefficients that compare non-standard voting to United Russia’s vote-share across 83 regions. The dependent variable is not United Russia’s vote itself, which would certainly be endogenous to the competitiveness scores. It is true that a strong vote-buying effort could possibly be used to inflate United Russia’s spread over its competitors in
regional elections, but it is also true that such a strategy might be only employed when United Russia’s position is precarious and competitiveness is high. It is precisely this
9
18
relationship that this study intends to uncover, and precisely this relationship that has generated conflicting findings in the earlier studies of electoral fraud described above.
Second, I provide two non-electoral measures of political control to provide confirmation for the competitiveness variable. First, Petrov (2004) and Petrov and Titkov (2010) report expert evaluations of the ‘democratic-ness’ of each region in Russia. These ratings, which range from a least-democratic score of 10 to 50, are calculated using scores for ten dimensions of regional politics, such as the degree of media freedom, none of which rely on the relative size of political parties’ vote (Petrov 2004, p. 243).10
Unfortunately the most recent rankings are aggregated from 2001-2006, making them less substantively interesting than the more recent competitiveness numbers. Nevertheless, my theory predicts that if political conditions in 2011 were proportionate to those in the first half of the decade, more democratic regions according to the Petrov scores should rely more on vote-buying, and less democratic regions should rely more on ballot-rigging.
In the Russian context, it is also possible to use ethnicity as a proxy for
competitiveness. Since the early days of the Soviet Union, minority ethnicity has been politicized by the central government. From the 1920s, the Soviet government recognized titular ethnic homelands within the Soviet Union and the Russian Soviet Republic, and recognized the native language of the titular minority as the official language in each such region. Ethnic elites were promoted into leadership positions in the regional party,
government, industries, and schools. Ethnic identity was reinforced through
officially-promoted symbols: national museums, folklore, art, music, and literature (Martin 2001, pp. 9-17).
10
19
Secondly, ethnic territories of the Russian Federation were among the most assertive regions following the collapse of the Soviet Union. Many of them claimed a sort of quasi-sovereignty in their own domestic affairs in the 1990s, going so far as to sign bilateral treaties with the central government. By 1999 there were 42 such ‘treaties,’ with ethnic territories having led the way in the effort to carve out independent jurisdiction over economic, social, trade and other issues (Stoner-Weiss 2006, pp. 52, 65-66).
These regions tend to provide strong support for the ruling party (e.g., Hale 2007). It may seem ironic that the very regions that claimed the most independence in the 1990s are the most devoted to United Russia in the present period. It is important to recall the extensive efforts of the Putin administration to subdue the regions and bring them under the authority of the Kremlin (Konitzer & Wegren 2006). As a result of these efforts, the assets that allowed the ethnic territories to assert their independence—stocks of local political resources
(Treisman 1997), a shared collective identity, and relatively unified elites (Ross 2000)—were put in the service of the center. In this study, I use Percent Russian, which is the percentage of each region’s population that identifies as ethnically Russian, to measure ethnicity (2010
Russian Census). Percent Russian is strongly, positively correlated with both competitiveness and Petrov’s regional democracy scores. My theory predicts that Percent Russian will be
positively correlated with vote-buying, as regions where ethnic minorities make up a larger share of the population are more politically unified and able to rely on ballot-rigging.
20
percent to 97 percent of the population, though most regions are dominated by ethnic Russians. Democracy score ranges from a minimum of 16 to a maximum of 41.
Measuring ballot-rigging using a last-digits test
The final element needed to test this theory is a measure of ballot-rigging. In recent years, scholars have proposed several methods for statistically detecting electoral fraud, a broad category that includes ballot-rigging. Myagkov et al (2009) have advanced three methods for assessing whether an election was clean or fraudulent overall. First, a researcher can use regression analysis to compare turnout with the support for political parties or
candidates across precincts. In a clean election, assuming homogenous precincts where turnout is a function of factors uncorrelated with a candidate’s support, increasing turnout
should not lead to an increased vote-share for any candidate. In fraudulent elections, however, ballot-stuffing, vote-buying, and election rigging can all inflate the relationship between turnout and overall level of support for a candidate. Similarly, researchers can look for a bimodal distribution of turnout across all precincts, where one mode corresponds to the results from free-and-fair precincts and the other corresponds to districts where turnout has been artificially boosted. Lastly, regression analysis can be used to track ‘the flow of votes’ between parties and candidates across elections (Myagkov et al, 2009, pp. 31-32).
21
result. In an election where no post-hoc rigging takes place, the distribution of trailing digits in the totals for each party should be uniform across all precincts. That is, the one’s digit for a particular party’s vote total in a given district is a random product of that precinct’s voters’
idiosyncratic decisions to vote. Across all precincts, a trailing digit of 2 should be no more likely to occur than a trailing digit of 9. Each digit from 0-9 should occur in approximately 10 percent of precincts (Beber & Scacco 2012).
The probability that an underlying uniform population distribution would produce a non-uniform sample distribution due to chance can be ascertained using a chi-square test. To score vote-rigging in this study, I conducted chi-square tests of uniformity for trailing digits of the vote totals of the four parties that won seats in the Duma in 2011, in each of Russia’s 83 regions. This information was used to create a variable, Fraud score, that ranges from 0-4. Each region received a point on this scale for each party that returned a p-value of less
than .05 in the chi-square test. I do not perform this test on smaller parties’ vote totals, since a high proportion of precincts with single- and double-digit votes can interfere with the assumption of uniform distribution of last digits in clean elections (Beber & Scacco 2012, p. 217). I rely on the last-digit method to measure fraud rather than methods based on Benford’s Law, such as those proposed by Mebane (2006), because of the former’s somewhat firmer theoretical foundations (Deckert et al, 2011).
The advantage of a digits-based test is that it exclusively targets direct human
22
election clean or fraudulent, since it only targets one type of fraud, it does provide a means of distinguishing between vote-buying and vote-rigging.11
As a purely descriptive statistic, this measure of election fraud shows that vote-rigging was not the dominant strategy employed in Russia in 2011. Forty-one of the 83 regions received a score of zero, meaning that the distribution of last digits for all four parties in those regions were not statistically significantly (at the .05 level) different from uniform. The number of regions in each category declines as fraud score increases: twenty regions scored a 1, twelve regions were scored at 2, nine regions12 received a 3, and only one—the Republic of Dagestan—recorded a score of 4. High fraud scores are associated with very high support for United Russia: the ten regions with fraud scores of 3 and 4 averaged 76 percent support for the ruling party, compared to a mean of 42 percent in those regions with a score of zero.
Multilevel model of vote-buying effectiveness
The multi-level model presented below uses the precinct-level data from the 2011 Duma election to generate regression coefficients for the effect of non-standard votes on United Russia’s support in the 83 regions of Russia. The percentage vote for United Russia in
each of the approximately 94,000 precincts serves as the bottom-level dependent variable y. The percentage non-standard vote is also tallied for each precinct, and used as an
independent variable at this level (z). The intercept (α) and the regression coefficient (β) for
11 The precinct-level data analyzed here is well-suited to this test, since the number of precincts in each region
is generally large. The mean sample size is 1142 precincts, while the median value is 962. There is no
statistically significant correlation between sample size and fraud score, which lends support to the claim that fraud score is an estimate of election manipulation behavior and not an artifact of random chance.
12
23
the nonstandard vote variable are allowed to vary for each of the 83 regions, as shown in Equations 2 and 3, with a matrix of region-level independent variables (X). The effect of nonstandard votes on United Russia vote-share (again, β) is treated as a function of X and a vector of regression coefficients Φ. Equations 1-3 can be re-expressed as Equation 4, which treats β as an interaction between X, Φ, and the nonstandard vote variable z. This level of the
model produces the information of ultimate interest: what factors contribute to a more effective vote-buying effort across regions?
Eq. 1) yij=αj + βjzij + e1
Eq. 2) αj=Γ0 + ΓXj + e2
Eq. 3) βj= Φ0 + Φ Xj + e3
Eq. 4) yij =(Γ0 + Γ Xj + e2) + (Φ0 + Φ Xj + e3) zij+e1
Results and interpretation
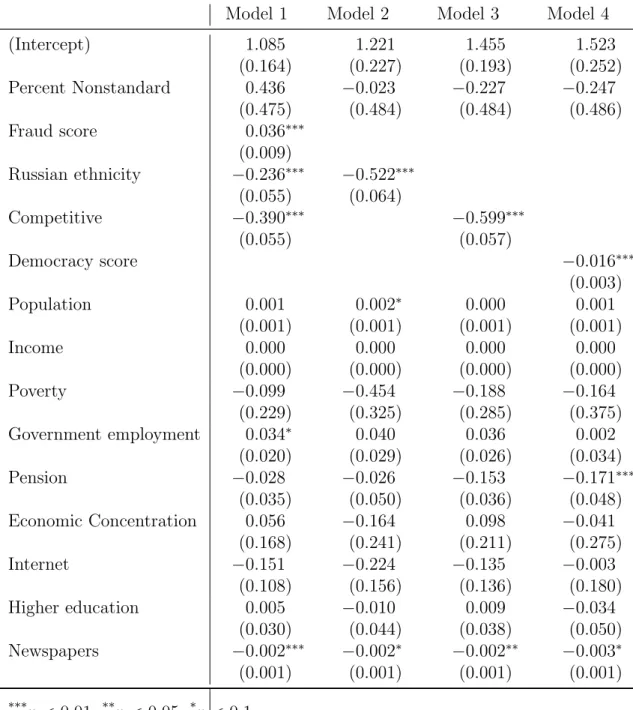
The tables below summarize the results of four regression models.13 Both tables report the results from the same models, Table 1 with regard to intercepts and Table 2 with regard to slopes. Model 1 includes all control variables, along with fraud score, in order to test the proposition that vote-buying and ballot-rigging are strategies employed under different circumstances. This hypothesis predicts that high vote-buying coefficients will be correlated with low fraud-scores and vice versa. Models 2, 3, and 4 exclude fraud score, in order to ascertain what conditions are more favorable to vote-buying, and each apply a single measure of political control. If election rigging and vote-buying are indeed opposite poles of a
13 In these tables, the variables Population, Income, Poverty, Government Employment, Pension, Internet,
24
continuum of election manipulation strategies, as I argue, then explanatory variables that are positively correlated with vote-buying will be negatively correlated with fraud score and vice versa. Consequently it is essential to remove fraud score to examine which structural factors contribute to more effective vote-buying.14
14 Of course, it is also possible to remove vote-buying from the equation and test for correlates of
Model 1 Model 2 Model 3 Model 4
(Intercept) 1.085 1.221 1.455 1.523
(0.164) (0.227) (0.193) (0.252)
Percent Nonstandard 0.436 −0.023 −0.227 −0.247
(0.475) (0.484) (0.484) (0.486)
Fraud score 0.036∗∗∗
(0.009)
Russian ethnicity −0.236∗∗∗ −0.522∗∗∗
(0.055) (0.064)
Competitive −0.390∗∗∗ −0.599∗∗∗
(0.055) (0.057)
Democracy score −0.016∗∗∗
(0.003)
Population 0.001 0.002∗ 0.000 0.001
(0.001) (0.001) (0.001) (0.001)
Income 0.000 0.000 0.000 0.000
(0.000) (0.000) (0.000) (0.000)
Poverty −0.099 −0.454 −0.188 −0.164
(0.229) (0.325) (0.285) (0.375)
Government employment 0.034∗ 0.040 0.036 0.002
(0.020) (0.029) (0.026) (0.034)
Pension −0.028 −0.026 −0.153 −0.171∗∗∗
(0.035) (0.050) (0.036) (0.048)
Economic Concentration 0.056 −0.164 0.098 −0.041
(0.168) (0.241) (0.211) (0.275)
Internet −0.151 −0.224 −0.135 −0.003
(0.108) (0.156) (0.136) (0.180)
Higher education 0.005 −0.010 0.009 −0.034
(0.030) (0.044) (0.038) (0.050)
Newspapers −0.002∗∗∗ −0.002∗ −0.002∗∗ −0.003∗
(0.001) (0.001) (0.001) (0.001)
***p <0.01, **p <0.05, *p < 0.1
Table 1: Predictors of estimated ruling party vote-share in the absence of nonstandard voting (intercepts)
Model 1 Model 2 Model 3 Model 4
Nonstandard:Fraud score -0.091∗∗∗
(0.027)
Nonstandard:Russian ethnicity 0.148 0.352∗∗∗
(0.155) (0.136)
Nonstandard:Competitiveness 0.000 0.280∗∗
(0.154) (0.139)
Nonstandard:Democracy score 0.010∗
(0.005)
Nonstandard:Population -0.002 -0.002 -0.001 -0.001
(0.002) (0.003) (0.003) (0.003)
Nonstandard:Income -0.001 -0.001 0.000 -0.001
(0.001) (0.001) (0.001) (0.001)
Nonstandard:Poverty -0.461 0.008 -0.117 -0.162
(0.664) (0.691) (0.707) (0.715)
Nonstandard:Gov. employment -0.037 -0.042 -0.042 -0.019
(0.065) (0.068) (0.069) (0.071)
Nonstandard:Pension 0.030 0.065 0.179∗∗ 0.171∗
(0.100) (0.105) (0.089) (0.092)
Nonstandard:Concentration 0.116 0.275 0.139 0.195
(0.478) (0.505) (0.517) (0.517)
Nonstandard:Internet -0.174 -0.109 -0.156 -0.241
(0.309) (0.329) (0.334) (0.340)
Nonstandard:Higher education 0.023 0.009 0.006 0.024
(0.088) (0.093) (0.095) (0.094)
Nonstandard:Newspaper 0.004 0.003 0.003 0.003
(0.002) (0.003) (0.003) (0.003)
AIC -102,269 -102,230 -102,256 -102,198
BIC -101,985 -101,984 -102,011 -101,952
Log Likelihood 51,164 51,141 51,154 51,125
Num. obs. 94,688 94,688 94,688 94,688
***p <0.01, **p <0.05, *p <0.1
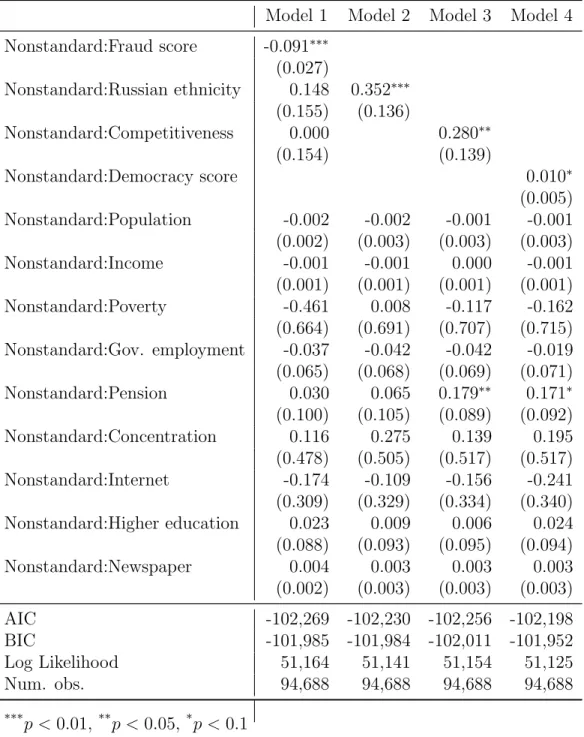
Table 2: Predictors of vote-buying effectiveness (i.e., the estimated relationship between nonstandard voting and ruling party vote-share)
27
For simplicity, Table 1 reports a fixed-effect coefficient for ‘Percent Nonstandard’; this represents the average of the 83 slopes (βj) estimated by the model, comparing
nonstandard voting to United Russia’s vote-share in each region. The model also estimates
83 intercepts (αj), the average of which is represented by the ‘Intercept’ term. Each intercept is an estimate of United Russia’s vote-share in a region in the absence of any nonstandard
votes. The parameters in Table 1 are the predictors of the 83 estimated intercepts; the interaction terms in Table 2 are predictors for the 83 estimated slopes. For the purposes of this study, slopes are the dependent variable of interest, as they are the measure of vote-buying effectiveness. I include Table 1 to show the effects of the constituent terms of the interactions in Table 2, and because intercepts help confirm that the models accurately corresponds to political realities in Russia. I analyze the effects of intercepts in Appendix 1, and discuss the main findings with regard to slopes below.
The results presented in Table 2 are generally supportive of the three hypotheses proposed above. I show these results graphically in the following four figures. In each, the dots represent regions, and the vertical bars represent 95% confidence intervals of the estimated marginal effects. The diagonal line illustrates the relevant regression coefficient listed in Table 2.
First, Model 1 shows a clear negative relationship between evidence of ballot-rigging and the indicators of vote-buying, as predicted by Hypothesis 1. This relationship is
28 Figure 3
As fraud score increases, the marginal effect of nonstandard voting on United
Russia’s vote-share declines to nearly zero. As regional party machines rely more heavily on
fraud to manage elections, they invest less in redundant vote-buying strategies. This finding suggests that earlier studies that group vote-buying and ballot-rigging strategies together under a unified rubric of electoral fraud—while accurately describing when and why fraud generally takes place—do not analyze when and why political machines engage in particular types of fraud.
29
democracy scores. The vertical bars indicate 95% confidence intervals for the estimated slope of each region.
Figure 4
30 Figure 6
That three different indicators of political openness produce similar results is
supportive of the hypothesis that vote-buying efforts increase along with openness. Returning to the examples of Pskov and Kabardino-Balkaria will help further clarify these findings, using Model 3 to illustrate. When controlling for the other variables included in the model, at Pskov’s value of competitiveness, it is estimated that a one-percentage-point increase in
nonstandard vote share is associated with a .067-percentage point increase in United Russia’s vote share on average in that region. This may not sound like a substantively large effect at first glance, but consider that at the mean value of nonstandard voting in Pskov—
approximately 30 percent of all votes—the average precinct records support for United Russia that is 2.01 percentage points higher than the average precinct where zero nonstandard votes were cast. Such precincts add up, to say nothing of those with even heavier
31
percentage points in United Russia’s support on average. Nonstandard voting is likewise much less common in Kabardino-Balkaria, where the mean value is nine percent of total votes.
What purpose does ballot-rigging serve in non-competitive districts, where the regime is most likely to win in the absence of such manipulation? Anecdotal evidence suggests that ballot-rigging is used, not to ensure the victory of the ruling party, but to boost turnout. Golos, the election monitoring group, obtained a copy of the preliminary results of the 2011 election in one precinct in Dagestan, a non-competitive region that received the highest possible score for ballot-rigging. The preliminary copy, signed and sealed, shows only 174 residents of the precinct voted, of whom 128 supported United Russia. However, when the final results for that precinct were released, United Russia had won 1,077 votes! As a result of the inflated vote, turnout in the district increased from 15 to 96 percent. Only a handful of these new votes were recorded as non-standard, implying that they were not drawn from absentee ballots or mobile ballot boxes counted later, but added behind the scenes with the stroke of a pen. Two Russian websites have catalogued preliminary results obtained by observers, totaling almost 1,000 reports, and compared them to the official results of the same precincts. They find that, on average, United Russia’s share in the official results increases by
approximately 270 votes in each precinct, compared to the preliminary results.15
Conclusion
In this article I have advanced a new theory of election manipulation, based on the degree to which authoritarian rulers control the political environment. To test this theory, I
15 These websites are http://ruelect.com/ru/?nr=1 and http://www.kartaitogov.ru/diff. Summary results are
32
have employed new measures of vote-buying and ballot-rigging that rely on large-scale statistical analysis of election data. I apply these measures to the results of the 2011 parliamentary election in Russia, a dataset that is publicly available but has not been extensively analyzed previously. I find evidence that political machines face a tradeoff between ballot-rigging and vote-buying strategies. This tradeoff implies that vote-buying efforts are costly and inefficient, and that political machines will eschew such efforts where a more effective means of managing electoral outcomes is available. The availability of ballot-rigging as a strategy is determined by the extent to which political machines control their regions. Ballot-rigging is not feasible in regions where competition is elevated, politics is more open, and opposition parties control a larger share of the legislature. In Russia,
politicized ethnicity provides another means of limiting competition and maintaining enough control over the political process to rig elections. In regions where such control is
unavailable, political machines use vote-buying to increase the probability that they will win elections. Though this study is subnational, I argue that the same mechanisms operate both within and across hybrid regimes. Highly authoritarian regimes that hold elections are likely to experience more direct fraud and less indirect fraud on average, though to the extent that there is subnational variation in the degree of political risk within such countries there will also be variation in the prevalence of indirect fraud. Likewise, highly competitive
authoritarian regimes are likely to experience more pervasive indirect fraud and less ballot-rigging, though direct fraud may still occur in particularly low-risk enclaves.
33
whether fraud causes a lack of competitiveness or vice-versa, it is clear that ballot-rigging is the strategy employed more frequently in non-competitive districts, and is more rarely found in competitive ones. By contrast, ruling party leaders in competitive regions are faced with the need to win elections under more difficult circumstances. Lacking the elite and social cohesion necessary to manipulate the results after the fact without fear of consequences, they rely on the inefficient strategy of vote-buying to boost their results on election day.
These findings are relevant to two strands of research. First, they contribute to a debate in scholarship on electoral fraud over the role of electoral competitiveness: does competitiveness increase or decrease the likelihood that the authorities will manipulate elections? This study does not compare the overall amount of fraud across regions, but it does suggest that competitiveness influences the form that electoral manipulation will take. More elevated competition should lead to more indirect fraud but less ballot-rigging; whether high levels of vote-buying represents more or less fraud than large-scale ballot-rigging is a difficult question to answer. Indirect fraud requires larger networks and more money to execute than direct fraud, but is also more detectable and less efficient. Thus higher levels of competition might lead to more prevalent fraud, but of a less damaging variety.
These questions lead to the second relevant area of research. The study of hybrid regimes like Russia has often been concerned with the effect of elections on eventual
transitions to democracy. However, such regimes have proved relatively stable on the whole, even if when they do collapse it is often in the direction of democracy (Brownlee 2009). Howard and Roessler (2006) have shown that such a ‘liberalizing electoral outcome’ is more
34
resources into vote-buying efforts where necessary, and relying on tight control of ballot counting where possible, authoritarian governments can tolerate outright opposition with a minimum of risk. Authoritarian regimes are adaptive, and adopt different strategies to suit the varying political conditions within their own territories. As a result, electoral competition may in fact serve to bolster the stability of hybrid regimes, by co-opting the opposition into a process they stand little chance of winning. It remains to be seen whether, and how,
opposition groups behave in such environments. Do they also engage in vote-buying efforts in competitive regions, or are they unable or unwilling to do so?
Additionally, this study has practical implications for election monitors. First, international organizations and donors should encourage states to disclose information on nonstandard voting, as Russia does. Second, election monitors in more competitive districts should be alert for evidence of vote-buying and other indirect forms of ballot-stuffing, while monitors in tightly controlled districts might see no evidence of that sort of electoral
manipulation. Monitors clearly cannot be everywhere, but this study suggests that in
competitive regions they should turn their attention to practices that enable vote-buying, such as not announcing the number of mobile ballot applications prior to tallying those votes, and the arrival of ‘carousels’ of voters. Likewise, monitors in less competitive regions might
35 Appendix:
Additional Notes on Model and Method
This appendix includes additional methodological and substantive justifications for the model presented in the article. First I discuss the findings of the multilevel models with regard to intercepts, or the estimated level of the ruling party’s vote-share in the absence of
vote-buying. I then describe the results of one major robustness check of the findings
presented in the article, using King’s method of ecological inference to approach the problem of detecting vote-buying. The results of the EI model largely confirm the results of the multilevel model. I also offer additional evidence that the fraud score variable captures a real phenomenon and is not a statistical artifact of small parties or small sample size. Finally, I briefly discuss the reasoning for analyzing the 2011 election in Russia in particular, provide another argument in support of the competitiveness variable used in the model, and describe the imputation of missing data in the model.
Intercepts
All four models’ findings with regard to intercepts can be interpreted in brief. Model
1 shows that fraud score has a positive relationship with intercepts. As mentioned above, intercepts represent United Russia’s estimated vote share without non-standard votes, leaving
36
Russian ethnicity, competitiveness, and democracy score consistently show a
statistically significant effect on intercepts across models, which is negative in all three cases. The effect of competitiveness on intercepts is straightforward. In regions where United Russia faces more competition, its vote share in the 2011 election is likely to be lower than in less competitive regions. Similarly, the ethnic makeup of regions in Russia is closely
intertwined with competitiveness, high levels of support for United Russia reported at the polls, and higher incidence of fraud. Lastly, as regions score higher on the democracy score variable, United Russia’s vote tally is likely to decrease, as political competition becomes
increasingly open.
Newspapers have a statistically significant negative effect on intercepts across all four models (though not always at the .05 level). Newspapers remain a relatively free form of media in Russia, where national television is tightly controlled by the state (Freedom House 2012). As such, a large number of newspapers in a region allows for a broader range of views, including those critical of the regime, to be aired.
37
While these findings with regards to intercepts are not themselves surprising, they do help confirm that the model conforms to expected aspects of Russian politics, and thus increase confidence in the more interesting results with regard to slopes.
Robustness check using King’s method of ecological inference
As a test of the validity of the multilevel models presented here, I compared the findings presented above with models that make use of the method of ecological inference proposed by King (1997). Using this method, it is possible to estimate the percentage of nonstandard votes going to United Russia on average in each region, as well as the same percentage for standard votes. To continue the running example, I estimate that 84 percent of nonstandard votes went to United Russia in Kabardino-Balkaria, compared to 82 percent of standard votes. By contrast, I estimate that 69 percent of nonstandard votes went to United Russia in Pskov, but only 40 percent of standard votes. After estimating equivalent figures for all 83 regions, I constructed a new variable, using the difference between the estimated proportion of nonstandard and standard votes for United Russia (e.g., .02 in the case of Kabardino-Balkaria and .29 in the case of Pskov). The larger the gap between the two estimates, the more effective I consider a votebuying effort to be. The variable ranges from -.43 (which means that standard votes were estimated to be much more likely to be cast for United Russia than nonstandard votes) to .53, with a mean of .27. This difference was then used as the dependent variable in an OLS regression, using the same independent variables as in the multilevel models.
38
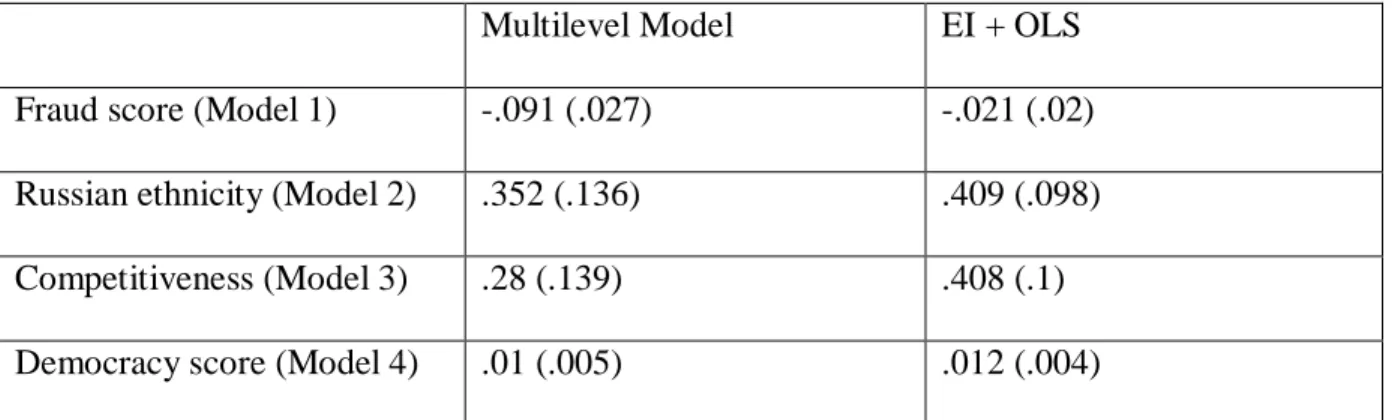
Russian ethnicity, and fraud score, the latter variable has the predicted negative effect but is not statistically significant. The estimated magnitudes of the effects of the key variables were also similar, as illustrated in the table below.
Multilevel Model EI + OLS Fraud score (Model 1) -.091 (.027) -.021 (.02) Russian ethnicity (Model 2) .352 (.136) .409 (.098) Competitiveness (Model 3) .28 (.139) .408 (.1)
Democracy score (Model 4) .01 (.005) .012 (.004) Table 3: Estimated coefficients (standard errors) across models.
These effects are not quite measures of the same thing, since the dependent variables of the models are different. Furthermore, for the multilevel model, the coefficients listed above are those for the interaction terms (that is, the given independent variable multiplied by Percent Nonstandard), and give the effect of a one-unit change in the interaction term on United Russia’s vote share on average, holding all other variables constant. By contrast the
second column of the table shows the size of the effect of the standalone independent
variables, on the difference between United Russia’s nonstandard vote share and its standard
39
The results of the EI model are generally supportive of the multilevel model
presented in this article. With the exception of fraud score, the size, sign, and significance of the effects are comparable. The most damaging result is the lack of statistical significance for the effect of fraud score. Despite this, I argue that the results found in the multilevel model remain compelling. First, there is a clear negative relationship between fraud score and the difference between EI estimates of nonstandard and standard support for United Russia, which mirrors the relationship found in the multilevel model (though it is weaker).
Figure 7
Secondly, by definition King’s EI method introduces measurement bias into the
dependent variable (Herron & Shotts 2003). In this case, the dependent variable that I have constructed is composed of two different sets of estimates of United Russia’s vote-share: for
40
dependent variable twice. Assuming that it is uncorrelated with the independent variables, this measurement error in the dependent variable does not bias the coefficient estimates in the OLS regression. It does, however, make them inefficient. It is possible that if the true values of nonstandard and standard voting for United Russia could be known, there would be more confidence in the negative estimate of the coefficient. Finally, it should be noted that in a regression that includes all control variables but none of the three explanatory variables (ethnicity, competitiveness, or democracy score), the coefficient for fraud score is -.057 with a standard error of .02, which is statistically significant at the .01 level. I take this as further evidence that, with greater precision in the dependent variable, the effect of fraud score would be both negative and significant, but that the EI results are overall supportive of the multilevel model.
Fraud score, party size, and region size
As described in the article, fraud score ranges from a minimum of zero to a maximum of four. Interestingly, in no region that received a fraud score of 1 was United Russia the party that appeared irregular. In most such cases, it was one of the two smaller parliamentary parties that produced the score (the Liberal Democratic Party of Russia or Just Russia). This raises two possibilities. Election authorities in low-fraud environments could be altering the vote of the smaller parties, but not those of United Russia and the largest opposition party, the Communists. Alternatively, the statistical test could be producing false positives. In one sense this latter possibility is inherent in the chi-square test: a uniform distribution will ‘naturally’ produce a distribution of last digits that triggers the test five percent of the time in
repeated sampling. More fundamentally however, it could be that smaller parties are
41
number of precincts in the region. Neither appears to be the case. The smaller opposition parties included in this study are still considerable contenders, usually receiving well over the number of votes needed to win representation in the parliament (seven percent of the national vote, in 2011). Furthermore, sample size is not correlated at all with fraud score—neither low nor high scores are found disproportionately in small regions.
Figure 8
Why 2011?
42
of support implies that political machines would have to step up their election-management efforts in order to safeguard the large majority in the Duma necessary to prevent elite defection and unilaterally control political institutions (Magaloni 2006). Under such circumstances, ballot-rigging and vote-counting should be easier to detect than in earlier elections when United Russia enjoyed more overwhelming popular support.
Institutional justification for competitiveness variable
An additional comment on the competitiveness variable: there is a sound institutional reason for including it. In Russia, preeminence in the regional legislature is itself an
important asset for a ballot-rigging strategy. Official results are tallied by a regional election commission; half of the members of this commission are appointed by the regional governor, while the second half is appointed by the regional legislature.16 A large majority in the
regional legislature provides greater leeway to appoint pliant election officials. Even the local courts were found to be susceptible to pressure from the regional government, in an analysis of 1999 election disputes (Popova 2006), suggesting that election officials complicit in fraud would be less likely to face prosecution or conviction in regions where the ruling party’s influence is most pronounced.
Multiple imputation of region-level missing data
Regional level data was missing in four instances. No data was available for income, poverty level, or democracy score in Chechnya, and no democracy score was available for Zabaikalsky Krai. These data points are not missing at random. Data is missing for Chechnya because of that region’s particularly troubled history, while no democracy score is available
16
See Chapter IV, Article 23, paragraph 6 of federal law 67-FZ, “The order of formation and authority of the electoral commissions of the subjects of the Russian Federation.”
43
for Zabaikalsky Krai because it did not exist as an administrative region at the time the scores were calculated. Running the regression as a complete-case analysis not only requires the researcher to discard all of the data associated with the two regions (since the missingness is at the regional level), but also generates bias (Gelman and Hill 2007). To reduce these problems, as noted in the main article, I used the ‘mi’ package for R to impute the missing
data. I imputed income using variables for higher education, economic concentration,
government employment, number of pensioners, and percentage of the gross regional product derived from agriculture. I imputed poverty levels using the income, government
44
BIBLIOGRAPHY
Anderson, M. L. (2000). Practicing Democracy: Elections and Political Culture in Imperial Germany. Princeton University Press.
Barreto, M. A., Streb, M. J., Marks, M., & Guerra, F. (2006). Do Absentee Voters Differ from Polling Place Voters? Public Opinion Quarterly, 70(2), 224–234.
Beber, B., & Scacco, A. (2012). What the Numbers Say: A Digit-Based Test for Election Fraud. Political Analysis, 20(2), 211–234. doi:10.1093/pan/mps003
Birch, S. (2007). Electoral Systems and Electoral Misconduct. Comparative Political Studies, 40(12), 1533–1556. doi:10.1177/0010414006292886
Brownlee, J. (2007). Authoritarianism in an Age of Democratization. Cambridge University Press.
Brownlee, J. (2009). Portents of pluralism: How hybrid regimes affect democratic transitions. American Journal of Political Science, 53(3), 515–532.
Brusco, V., Nazareno, M., & Stokes, S. C. (2004). Vote Buying in Argentina. Latin American Research Review, 39(2), 66–88.
Chandra, K. (2007). Why Ethnic Parties Succeed: Patronage and Ethnic Head Counts in India. Cambridge University Press.
Deckert, J., Myagkov, M., & Ordeshook, P. C. (2011). Benford’s Law and the Detection of Election Fraud. Political Analysis, 19(3), 245–268. doi:10.1093/pan/mpr014
Dubin, J. A., & Kalsow, G. A. (1996). Comparing absentee and precinct voters: A view over time. Political Behavior, 18(4), 369–392.
Freedom House. (n.d.). Russia. Retrieved September 20, 2012, from http://www.freedomhouse.org/report/nations-transit/2012/russia
Gandhi, J., & Przeworski, A. (2006). COOPERATION, COOPTATION, AND REBELLION UNDER DICTATORSHIPS. Economics & Politics, 18(1), 1–26. doi:10.1111/j.1468-0343.2006.00160.x
Gandhi, J., & Przeworski, A. (2007). Authoritarian Institutions and the Survival of Autocrats. Comparative Political Studies, 40(11), 1279–1301. doi:10.1177/0010414007305817 Geddes, B. (2006, March). Why Parties and Elections in Authoritarian Regimes. UCLA. Gelman, A., & Hill, J. (2007). Data Analysis Using Regression and Multilevel/Hierarchical
45
GOLOS. (2011). Elections in Russia, December 4 2011: An Analytic Report. GOLOS. Retrieved from http://www.golos.org/asset/5878
Gonzalez-Ocantos, E., de Jonge, C. K., Meléndez, C., Osorio, J., & Nickerson, D. W. (2012). Vote Buying and Social Desirability Bias: Experimental Evidence from Nicaragua. American Journal of Political Science, 56(1), 202–217.
doi:10.1111/j.1540-5907.2011.00540.x
Hale, H. (2007). Correlates of clientelism: political economy, politicized ethnicity, and post-communist transition. Patrons, Clients, and Policies: Patterns of Democratic
Accountability and Political Competition (pp. 227–250). Cambridge University Press. Herron, M. C., & Shotts, K. W. (2003). Using Ecological Inference Point Estimates as
Dependent Variables in Second‐Stage Linear Regressions. Political Analysis, 11(1), 44– 64. doi:10.1093/pan/11.1.44
Hicken, A. (2007). How Effective Are Institutional Reforms? Elections for Sale: The Causes
and Consequences of Vote Buying (pp. 145–160). Boulder, CO: Lynne Reiner Publishers.
Howard, M. M., & Roessler, P. G. (2006). Liberalizing electoral outcomes in competitive authoritarian regimes. American Journal of Political Science, 50(2), 365–381. Karp, J. A., & Banducci, S. A. (2001). Absentee voting, mobilization, and participation.
American Politics Research, 29(2), 183–195.
Kitschelt, H., & Wilkinson, S. (2007). Patrons, Clients, and Policies: Patterns of Democratic Accountability and Political Competition. Cambridge University Press.
King, G. (1997). A Solution to the Ecological Inference Problem: Reconstructing Individual Behavior from Aggregate Data. Princeton University Press.
Konitzer, A., & Wegren, S. K. (2006). Federalism and Political Recentralization in the Russian Federation: United Russia As the Party of Power. Publius: The Journal of Federalism, 36(4), 503–522. doi:10.1093/publius/pjl004
Lehoucq, F. E. (2007). When Does a Market for Votes Emerge? Elections for Sale: The
Causes and Consequences of Vote Buying (pp. 33–46). Boulder, CO: Lynne Reiner
Publishers.