The Journal of Nutrition Nutritional Epidemiology
Artificially Sweetened Beverage Consumption
Is Positively Associated with Newly Diagnosed
Diabetes in Normal-Weight but Not in
Overweight or Obese Brazilian Adults
1–3
James Yarmolinsky,4Bruce B Duncan,4,5* Lloyd E Chambless,6Isabela M Bensenor,7,8Sandhi M Barreto,9 Alessandra C Goulart,7,8Itamar S Santos,7,8Maria de F ´atima Sander Diniz,9and Maria Ineˆs Schmidt4,5
4Postgraduate Program in Epidemiology, School of Medicine and Hospital de Cl´ınicas de Porto Alegre, Federal University of Rio Grande
do Sul, Porto Alegre, Brazil;5Department of Epidemiology, and6Department of Biostatistics, University of North Carolina, Chapel Hill, NC;7Department of Clinical Medicine, Faculty of Medicine and8Center for Clinical and Epidemiological Research, University Hospital, University of Sa˜o Paulo, Sa˜o Paulo, Brazil; and9Faculty of Medicine, Federal University of Minas Gerais, Belo Horizonte, Brazil
Abstract
Background:Recent animal studies suggest that artificially sweetened beverage (ASB) consumption increases diabetes risk.
Objective:We examined the relation of ASB intake with newly diagnosed diabetes and measures of glucose homeostasis in a large Brazilian cohort of adults.
Methods:We used cross-sectional data from 12,884 participants from the Brazilian Longitudinal Study of Adult Health (ELSA-Brasil). ASB use was assessed by questionnaire and newly diagnosed diabetes by a 2-h 75-g oral glucose tolerance test and/or glycated hemoglobin. Logistic and linear regression analyses were performed to examine the association of ASB consumption with diabetes and continuous measures of glucose homeostasis, respectively.
Results:Although ASB consumption was not associated with diabetes in logistic regression analyses after adjustment for body mass index (BMI; in kg/m2) overall, the association varied across BMI categories (P-interaction = 0.04). Among those with a BMI <25, we found a 15% increase in the adjusted odds of diabetes for each increase in the frequency of ASB consumption per day (P= 0.001); compared with nonusers, ASB users presented monotonic increases in the adjusted ORs (95% CIs) of diabetes with increased frequency of consumption: 1.03 (0.60, 1.77), 1.43 (0.93, 2.20), 1.62 (1.08, 2.44), and 2.51 (1.40, 4.50) for infrequent, 1–2, 3–4, and >4 times/d, respectively. In linear regression analyses, among normal-weight individuals, greater ASB consumption was also associated with increased fasting glucose concentrations (P= 0.01) and poorer
b-cell function (P= 0.009). No such associations were seen for those with BMI$25. In fact, in overweight or obese participants, greater ASB consumption was significantly associated with improved indexes of insulin resistance and 2-h postload glucose.
Conclusions:Normal-weight, but not excess-weight, individuals with greater ASB consumption presented diabetes more frequently and had higher fasting glucose and poorerb-cell function. J Nutr2016;146:290–7.
Keywords: type 2 diabetes, artificially sweetened beverage consumption, BMI, glucose intolerance,b-cell function
Introduction
Consumption of artificial sweeteners in the United States in-creased from near zero in the 1960s to about 15% of individuals
in 2003–2004 (1). By 2007–2008, NHANES data suggest that approximately one-third of the adult population regularly consumed low-calorie sweeteners and that 22% of normal-weight individuals did so (2). Perhaps owing to the perceived status as a healthy alternative to sugar-sweetened beverages and foods, consumption of low-calorie sweeteners has not been limited solely to those with a disease such as diabetes or obesity but has been adopted more broadly as a healthy habit. Recently, animal experiments have suggested that artificial noncaloric sweeteners may contribute to glucose intolerance through alterations of the composition and function of intestinal microbiota, which may in turn upregulate de novo glucose synthesis pathways by the host (3).
1
Supported by the Brazilian Ministry of Health (Science and Technology Department) and the Brazilian Ministry of Science and Technology [Financiadora de Estudos e Projetos and Conselho Nacional de Desenvolvimento Cient´ıfico e Tecnol´ogico (CNPq) National Council for Scientific and Technological Development], grants 01 06 0010.00 RS, 01 06 0212.00 BA, 01 06 0300.00 ES, 01 06 0278.00 MG, 01 06 0115.00 SP, and 01 06 0071.00 RJ.
2
Author disclosures: J Yarmolinsky, BB Duncan, LE Chambless, IM Bensenor, SM Barreto, AC Goulart, IS Santos, MdFS Diniz, and MI Schmidt, no conflicts of interest.
3
Supplemental Tables 1–5 are available from the ‘‘Online Supporting Material’’ link in the online posting of the article and from the same link in the online table of contents at http://jn.nutrition.org.
*To whom correspondence should be addressed. E-mail: [email protected].
ã2016 American Society for Nutrition.
290 Manuscript received July 10, 2015. Initial review completed August 20, 2015. Revision accepted November 12, 2015.
Evidence from human studies concerning health benefits of artificial sweeteners is inconsistent (4, 5). Some studies link higher consumption of artificially sweetened beverages (ASBs)10 with weight gain, metabolic dysfunction, and elevated risk of type 2 diabetes (6–9), independently of baseline BMI (in kg/m2) (9–11). Others report nonsignificant associations after adjust-ment for BMI (12–16). Recently, it has been reported that substitution for sugar-sweetened beverages by water or non-sweetened coffee or tea reduces the risk of developing diabetes, but substitution by ASBs does not (16). Few epidemiologic studies have assessed the potential effect modification by BMI of the ASB-diabetes association. Moreover, few epidemiologic studies have examined the association of regular ASB consump-tion with measures of glucose homeostasis, which can help identify the putative mechanisms through which ASBs may affect diabetes development (9, 17).
In light of the inconsistent evidence that ASBs may increase the risk of diabetes and other conditions that they are intended to prevent and of the relative paucity of epidemiologic literature on this association across the different strata of BMI, further examination is warranted of the association of regular ASB consumption with both diabetes and markers of the underlying pathophysiologic processes. Thus, we studied the association of ASB consumption with newly diagnosed diabetes, intermediate hyperglycemia, and underlying laboratory measurements related to glucose homeostasis.
Methods
Study design and population.The Brazilian Longitudinal Study of Adult Health (in Portuguese, Estudo Longitudinal de Sa ´ude do Adulto– Brasil or ELSA-Brasil) is a cohort study designed to identify risk factors for diabetes and cardiovascular disease. The details of the study, including design, eligibility criteria, sources and methods of recruitment, and measurements obtained, have been described in detail elsewhere (18). The cohort comprises 15,105 civil servant volunteers, aged 35–74 y at baseline (2008–2010), who were sampled from universities or re-search institutions located in 6 cities of 3 different regions in Brazil. All currently active employees of the selected institutions and those retired but living within the metropolitan area of the study centers were eligible; individuals were excluded for pregnancy, mental incapacity, or major diseases such as terminal cancer that severely limited the projected life span. All data for the current cross-sectional analyses were collected at baseline. The study was approved by the local research and ethics committees of all involved institutions.
For the current investigation, we excluded those with known diabetes (participants who reported having been previously diagnosed with diabetes by a physician and/or using diabetes medication in the 2 previous weeks; n = 1473) from all analyses. We also excluded participants with missing data at baseline for the following variables: BMI (n= 6), waist-hip ratio (n= 8), race/skin color (n= 184), beverage consumption (n= 55), current smoking status (n= 1), hypertension (n= 13), leisure time physical activity (n= 221), dietary changes in previous 6 mo (n= 45), total energy intake (n= 36), and laboratory measurements (n= 362). Some participants had missing data for$2 variables. Consequently, our main analyses were performed on 12,884 participants.
Exposure assessment. ASB intake was assessed at the baseline examination through a validated 114-item food-frequency questionnaire
(19). Participants were asked to provide information on their typical eating habits, including attempts to modify their diet, in the 6 months before the baseline examination of the ELSA-Brasil. For assessment of beverage intake specifically, participants were asked to provide both the typical frequency with which they consumed ASBs (>3 times/d, 2–3 times/d, 1 time/d, 5–6 times/wk, 2–4 times/wk, 1 time/wk, 1–3 times/mo, never/almost never) and the typical quantity of the beverage consumed on each occasion in relation to a reference cup size. Possible types of beverage were soda, coffee, tea, natural juice (which is frequently sweetened in Brazil), reconstituted natural juice, and fruit-flavored drinks (e.g., Tang, Kool-Aid, or Crystal Light/Clight). Participants who consumed these beverages were further asked to specify whether each beverage was typically sugar sweetened (if sugar was an ingredient in the beverage and/or an individual manually added sugar to the beverage), artificially sweetened (if an artificial sweetener was an ingredient in the beverage and/or an individual manually added artificial sweetener—in either a liquid or a solid form—to the beverage), or unsweetened when consumed. Last, for secondary analyses, intakes of diet and ‘‘light’’ foods, which can contain artificial sweetener—including yogurt, ice cream, popsicles, caramel candy, gelatin desserts, chocolate, pudding/mousse, jam, and cereal bars—were examined in a similar manner.
Outcome ascertainment.A 12-h fasting blood sample was drawn by venipuncture soon after each participant arrived at the baseline clinic visit. A 2-h 75-g oral-glucose-tolerance test was then administered to participants without known diabetes. Glucose was measured by the hexokinase method (ADVIA Chemistry; Siemens), glycated hemoglobin (HbA1C) was measured using high-pressure liquid chromatography (Bio-Rad Laboratories), a National Glycohemoglobin Standardization Program certified method, and insulin was measured with an immu-noenzymatic assay (ELISA) (Siemens).
Diabetes was classified according to blood glucose measurements. Specifically, a participant was defined as having newly diagnosed diabetes if he or she reached the threshold for fasting plasma glucose ($126 mg/dL), 2-h postload plasma glucose ($200 mg/dL), or HbA1c ($6.5%; 48 mmol/mol) (20, 21). Given the age range of our participants and the fact that none were using medications, most of these newly diagnosed cases will have type 2 diabetes.
Impaired glucose tolerance (IGT) was defined as a 2-h postload glucose concentration$140 mg/dL and <200 mg/dL, impaired fasting glucose (IFG) as a fasting glucose concentration$100 mg/dL and <126 mg/dL (20, 21), and elevated HbA1c as a value$5.7% (39 mmol/mol) and <6.5% (48 mmol/mol) in individuals not otherwise classified as having diabetes (22).
HOMA-IR was defined as the product of fasting glucose (in mmol/L) and insulin concentrations (mIU/mL) divided by 22.5, and HOMAb-cell function (HOMA-b) was defined as the product of 20 and fasting insulin (mIU/mL) divided by fasting glucose (mmol/L) minus 3.5 (23). Compos-ite insulin sensitivity index (ISI-composCompos-ite), as proposed by DeFronzo and Matsuda (24), was calculated as 10,000 divided by the square root of the product of fasting and 2-h postload glucose and insulin concentrations.
Covariate assessment.A comprehensive set of questionnaires, tests, and measurements was carried out (25). Blood pressure was measured using an oscillometric method (HEM 705CP; Omron). Waist-hip ratio was calculated as the ratio of measured waist to measured hip circumference.
Statistical analyses. Baseline characteristics of the sample were summarized using unadjusted means and SDs for continuous variables and frequencies and percentages for categorical variables, according to ASB intake categories [nonuser (<1 time/wk; referent category), infre-quent (at least 1 time/wk but <1 time/d), 1–2 times/d, 3–4 times/d, >4 times/d]. Because quantity of ASB typically consumed on each occasion did not differ markedly by frequency of ASB consumption, analyses were performed using just the frequency of ASB consumption.
Multiple linear regression was performed to assess the association between category of ASB intake and continuous measures of fasting glucose, 2-h postload glucose, HbA1c, and the indexes HOMA-IR, 10
Abbreviations used: ASB, artificially sweetened beverage; ELSA-Brasil, Estudo Longitudinal de Sa ´ude do Adulto–Brasil; HbA1C, glycated hemoglobin; HOMA-b, homeostasis model assessment ofb-cell function; IFG, impaired fasting glucose; IGT, impaired glucose tolerance; ISI-composite, composite insulin sensitivity index.
HOMA-b, and ISI-composite. Multivariable logistic regression was performed to generate ORs and 95% CIs for the association of categories of ASB intake with newly diagnosed diabetes. After exclusion of cases of newly diagnosed diabetes (n= 1426), we also analyzed ASB associations with states of intermediate hyperglycemia (IFG, IGT, and HbA1c $5.7%, <6.5%) in the remaining 11,458 participants. In secondary analyses, multivariable logistic regression was also performed to examine the association of diet or ‘‘light’’ food intake (using the same categories of consumption as for ASBs) with diabetes and measures of intermediate hyperglycemia. To control for confounding, we selected established risk factors for diabetes and factors known to be associated with ASB consumption, based on prior studies and theoretical consider-ations, as follows: sex, age (y), race/skin color, study center, educational attainment, current smoking status, leisure time physical activity, hypertension, family history of diabetes, dietary changes in previous 6 mo, alcohol consumption (g/d), sugar-sweetened beverage consump-tion, unsweetened beverage consumpconsump-tion, diet/light food consumpconsump-tion, total energy intake (kcal/d), BMI, and waist-to-hip ratio.
In modeling, interaction terms were used to investigate whether associations differed by sex, age (<51,$51 y; median cutoff), or BMI (<25,$25 to <30,$30). Although the <25 group includes participants with both ‘‘normal’’ and ‘‘underweight’’ BMI classifications, only 130 (2.6%) participants in this group were deemed to be in the ‘‘underweight’’ classification, and thus this group is referred to as ‘‘normal weight’’ in the text. All statistical tests were 2-sided and significance was defined atP< 0.05. Statistical analyses were performed with SAS 9.4 (SAS Institute, Inc.).
Results
Baseline descriptive data of ELSA-Brasil participants by frequency of ASB consumption are presented in Table 1.
Approximately 33% of participants reported consuming ASBs at least 1 time/d,;15% (1934) reported consuming ASBs 3–4 times/d, and;5% (644) reported consumption of >4 times/d. Artificially sweetened coffee was consumed by 59.6% of those reporting ASBs consumption, diet soda by 54.1%, artificially sweetened natural juice by 32.3%, tea by 26.7%, artificially sweet-ened reconstituted fruit juice by 23.8%, and artificially sweetsweet-ened fruit-flavored drinks by 10.5%. When considering frequencies of consumption of these beverages, total ASB consumption in the sample was mainly accounted for by addition of artificial sweeteners to coffee (62.0%), followed by consumption of diet soda (12.7%), artificially sweetened natural juice (10.2%), tea (7.2%), artificially sweetened reconstituted fruit juice (5.4%), and artificially sweetened fruit-flavored drinks (2.5%). Gener-ally, those with greater use of ASBs, compared with nonusers, were more likely to have reported modifying their diet in the previous 6 mo, had a higher BMI, and were more likely to have hypertension and a family history of diabetes.
At baseline, we found 1426 cases of newly diagnosed diabetes, 7,556 cases of IFG, and 2,965 cases of IGT.
In a model adjusted for age, sex, race, and study center, ASB consumption was significantly associated with odds of newly diagnosed diabetes among those consuming ASBs 1–2 times/d (OR: 1.35; 95% CI: 1.14, 1.59), 3–4 times/d (OR: 1.27; 95% CI: 1.08, 1.49), and >4 times/d (OR: 1.54; 95% CI: 1.21, 1.95) compared with nonusers (P< 0.0001) (Table 2). This association became nonsignificant after further adjustment for sociodemo-graphic, lifestyle, and dietary variables, most notably after adding BMI and waist-to-hip ratio (P= 0.14). ASB consumption was significantly associated with odds of impaired fasting
TABLE 1 Characteristics of ELSA-Brasil participants without a previous diabetes diagnosis by frequency of ASB consumption per day at baseline (2008–2010)1
Characteristic
Total sample
(n= 12,884)
Nonusers
(n= 7702)
Infrequent
(n= 902)
1–2 times/d
(n= 1702)
3–4 times/d
(n= 1934)
.4 times/d (n= 644)
ASB intake, occasions/d 0.9561.60 0.0060.02 0.3060.14 1.2260.47 3.2460.65 5.5161.08
Coffee 0.5961.17 0.0060.00 0.0160.07 0.4860.47 2.4161.18 3.2061.12
Soda 0.1260.40 0.0060.01 0.1960.18 0.2460.35 0.2860.67 0.6561.00
Natural juice 0.1060.37 0.0060.00 0.0360.11 0.1960.32 0.2360.56 0.6861.00
Other beverages2 0.1460.47 0.0060.01 0.0760.13 0.3160.41 0.3260.65 0.9861.22
Women 7057 (54.8) 3794 (49.3) 547 (60.6) 1066 (62.6) 1261 (65.2) 389 (60.4)
Age, y 51.568.9 51.168.9 51.469.0 51.869.2 52.668.9 52.668.6
Race/color
Black 1983 (15.4) 1361 (17.7) 111 (12.3) 209 (12.3) 230 (11.9) 72 (11.2)
Mixed ``Pardo ` ` 3620 (28.1) 2363 (30.7) 201 (22.3) 423 (24.8) 455 (23.5) 178 (27.6)
White 6855 (53.2) 3719 (48.3) 564 (62.5) 1007 (59.2) 1186 (61.3) 379 (58.9)
Other3 426 (3.3) 259 (3.3) 26 (2.9) 63 (3.7) 63 (3.3) 15 (2.3)
Low educational attainment4 5034 (39.1) 3578 (46.5) 262 (29.0) 488 (28.7) 545 (28.2) 161 (25.0)
Current smoker 1702 (13.2) 1141 (14.8) 88 (9.8) 156 (9.2) 213 (11.0) 104 (16.2)
Total energy intake, kcal/d 296461230 296461219 297261200 295261278 298661260 292161178
Low physical activity5 10720 (83.2) 6516 (84.6) 741 (82.2) 1368 (80.4) 1560 (80.7) 535 (83.1)
Hypertension 4205 (32.6) 2424 (31.5) 283 (31.4) 562 (33.0) 703 (36.4) 233 (36.2)
Family history of diabetes 4661 (36.2) 2648 (34.4) 326 (36.1) 643 (37.8) 773 (40.0) 271 (42.1) Modified diet in previous 6 mo 3798 (29.5) 1853 (24.1) 314 (34.8) 634 (37.2) 720 (37.2) 277 (43.0)
BMI, kg/m2 26.864.6 26.164.5 27.164.7 27.764.6 27.764.7 28.464.9
WHR 0.8960.09 0.8960.09 0.8960.09 0.8960.09 0.8960.09 0.9060.09
1Values are means6SEMS orn(%). ASB, artificially sweetened beverage; ELSA-Brasil, Estudo Longitudinal de Sa ´ude do Adulto–Brasil;
WHR, waist-to-hip ratio.
2‘‘Other beverages’’: reconstituted natural juice, fruit-flavored drinks, and tea. 3‘‘Other’’: those reporting their race/skin color as ‘‘Asian’’ or ‘‘indigenous.’’ 4Highest level of instruction completed was high school or less. 5Typically engage in leisure time physical activity 1 d/wk or less.
glucose in both the minimally adjusted model and a model adjusting for all covariates (OR: 1.27; 95% CI: 1.02, 1.59 among those consuming ASBs >4 times/d compared with nonusers in the fully adjusted analysis; P = 0.03). ASB consumption was also significantly inversely associated with odds of impaired glucose tolerance in both the minimally adjusted and fully adjusted models (OR: 0.68; 95% CI: 0.54, 0.87 among those consuming ASBs >4 times/d compared with nonusers in the fully adjusted analysis; P = 0.005). No association was found when we examined ASB consumption with intermediate hyperglycemia as assessed by HbA1c ($5.7%, <6.5%) in either model (P$0.69, for both). Analyses modeling ASB consumption in a continuous fashion, also seen in Table 2, showed similar results as those modeling ASB consumption in a categorical fashion.
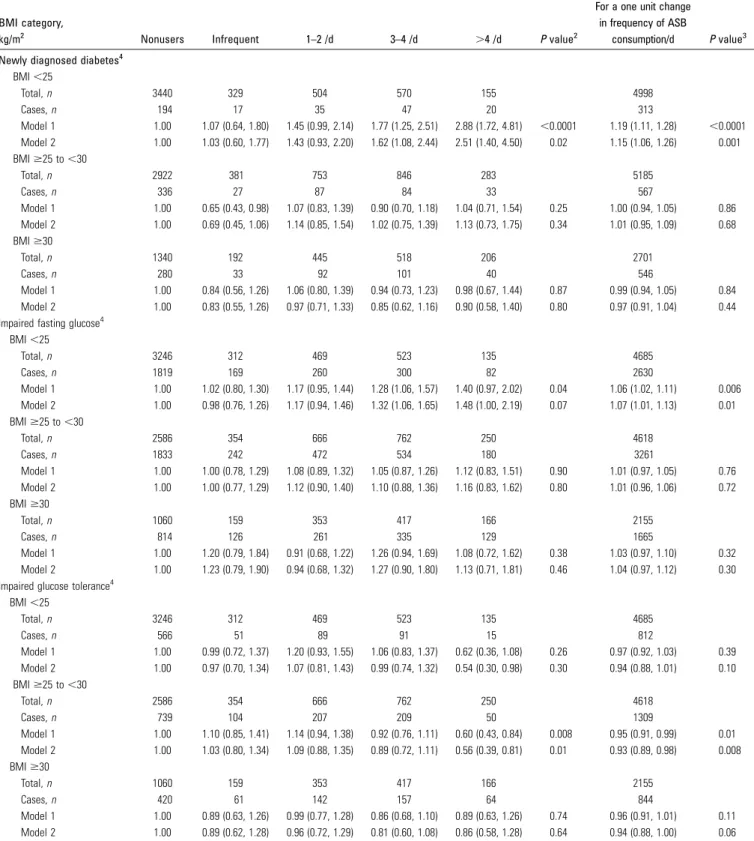
Tests for heterogeneity in the association of ASB consumption with newly diagnosed diabetes identified evidence for interaction by BMI strata (P-interaction = 0.04). In fully adjusted analyses stratified by BMI (<25,$25 to <30,$30), we found a graded positive risk relation between ASB consumption and type 2 diabetes in normal-weight participants among those consuming ASBs infrequently (OR: 1.03; 95% CI: 0.60, 1.77), 1–2 times/d (OR: 1.43; 95% CI: 0.93, 2.20), 3–4 times/d (OR: 1.62; 95% CI: 1.08, 2.44), and >4 times/d (OR: 2.51; 95% CI: 1.40, 4.50) compared with nonusers but no association in either overweight or obese participants (Table 3andSupplemental Table 1). Likewise, ASB consumption was associated with a borderline significantly increased risk of IFG in normal-weight individuals (P = 0.07), whereas no association was found in overweight and obese strata in either minimal or fully adjusted models. In contrast, in fully adjusted analyses, increased consumption was inversely associated with the adjusted odds of IGT among those in the overweight BMI stratum among those consuming ASBs infrequently (OR: 1.03; 95% CI: 0.80, 1.34), 1–2 times/d (OR: 1.09; 95% CI: 0.88, 1.35), 3–4 times/d (OR: 0.89; 95% CI: 0.72, 1.11), and >4 times/d
(OR: 0.56; 95% CI: 0.39, 0.81) compared with nonusers, whereas no association was found for those in either normal-weight or obese strata.
When we analyzed associations of ASB consumption with these outcomes in a continuous fashion, which depicts the association as a linear trend, similar associations were observed. Among normal-weight individuals, in a fully adjusted model, we found a 15% (OR: 1.15; 95% CI: 1.06, 1.26; P = 0.001) increased odds of type 2 diabetes and a 7% (OR: 1.07; 95% CI: 1.01, 1.13;P= 0.01) increased odds of IFG with each additional ASB consumed daily (Table 3). Likewise, we found a 0.43 mg/dL increase in fasting glucose concentrations (P = 0.01) and a 0.77% decrease in HOMA-b(P= 0.009), a measure ofb-cell function, for each additional frequency of daily ASB consump-tion (Table 4). Within the overweight stratum, each increase in daily ASB consumption was associated with a 7% (OR: 0.93, 95% CI: 0.89, 0.98;P= 0.008) decrease in the adjusted odds of IGT. Each additional ASB consumption for individuals in the overweight stratum was also associated with a 0.14 increase in ISI-composite score in adjusted analyses (P= 0.02), indicative of enhanced insulin sensitivity. For individuals in the obese stratum, each increase in daily ASB consumption was associated with a 0.19 change in ISI-composite score (P= 0.0002); however, no associations with any measures of blood glucose concentra-tion were seen. Small, positive associaconcentra-tions were noted between ASB consumption and glycated hemoglobin concentrations among both normweight and overweight participants, al-though these changes did not appear to be clinically significant. There was no evidence for interaction in the ASB association with newly diagnosed diabetes by age or sex. In analyses stratified by type of beverage, a greater prevalence of newly diagnosed diabetes in normal-weight individuals was seen both when the ASB was mostly coffee (defined as individuals who reported greater total consumption of artificially sweetened coffee than all other ASBs; OR: 1.14; 95% CI: 1.03, 1.27) and TABLE 2 Adjusted ORs (95% CIs) for the association of ASB consumption with newly diagnosed diabetes and measures of intermediate hyperglycemia: ELSA-Brasil (2008–2010),n= 12,8841
Nonusers Infrequent 1–2 times/d 3–4 times/d .4 times/d Pvalue2
For a one unit change in frequency of ASB
consumption/d Pvalue3
Newly diagnosed diabetes
Total,n 7702 902 1702 1934 644 12,884
Cases,n 810 77 214 232 93 1426
Model 1 1.00 0.88 (0.69, 1.14) 1.35 (1.14, 1.59) 1.27 (1.08, 1.49) 1.54 (1.21, 1.95) ,0.0001 1.08 (1.04, 1.11) ,0.0001
Model 2 1.00 0.82 (0.63, 1.07) 1.16 (0.96, 1.41) 1.07 (0.88, 1.30) 1.23 (0.94, 1.62) 0.14 1.03 (0.98, 1.07) 0.21
Impaired fasting glucose
Total,n 6892 825 1488 1702 551 11,458
Cases,n 4466 537 993 1169 391 7556
Model 1 1.00 1.13 (0.96, 1.32) 1.24 (1.09, 1.40) 1.35 (1.20, 1.52) 1.46 (1.20, 1.78) ,0.0001 1.07 (1.04, 1.10) ,0.0001
Model 2 1.00 1.04 (0.88, 1.23) 1.12 (0.97, 1.29) 1.23 (1.07, 1.42) 1.27 (1.02, 1.59) 0.03 1.04 (1.01, 1.07) 0.02
Impaired glucose tolerance
Total,n 6892 825 1488 1702 551 11,458
Cases,n 1725 216 438 457 129 2965
Model 1 1.00 1.10 (0.93, 1.31) 1.30 (1.14, 1.48) 1.11 (0.98, 1.26) 0.92 (0.75, 1.14) 0.001 1.00 (0.98, 1.03) 0.75
Model 2 1.00 0.98 (0.82, 1.16) 1.07 (0.93, 1.24) 0.90 (0.78, 1.04) 0.68 (0.54, 0.87) 0.005 0.94 (0.91, 0.97) 0.001
1Values are ORs (95% CIs) unless otherwise indicated. Adjusted through logistic regression for the following covariates—model 1: adjusted for sex, age (y), race/skin color, and
study center. Model 2: model 1 plus educational attainment, current smoking status, leisure time physical activity, hypertension, family history of diabetes, dietary changes in previous 6 mo, alcohol consumption, sugar-sweetened beverage consumption, unsweetened beverage consumption, diet/light food consumption, total energy intake, BMI, and waist-to-hip ratio. For impaired fasting glucose and impaired glucose tolerance analyses,n= 11,458 after exclusion of participants with newly diagnosed diabetes. ASB, artificially sweetened beverage; ELSA-Brasil, Estudo Longitudinal de Sa ´ude do Adulto–Brasil.
2Pvalue represents the test for an overall association of frequency of ASB consumption per day with each respective outcome of interest.
3Pvalue represents the test for the association of an increase in frequency of one additional moment of ASB consumption per day with each respective outcome of interest.
TABLE 3 Adjusted ORs (95% CIs) for the association of ASB consumption with newly diagnosed diabetes and measures of intermediate hyperglycemia, stratified by BMI category: ELSA-Brasil (2008–2010),n= 12,8841
BMI category,
kg/m2 Nonusers Infrequent 1–2 /d 3–4 /d .4 /d Pvalue2
For a one unit change in frequency of ASB
consumption/d Pvalue3
Newly diagnosed diabetes4
BMI,25
Total,n 3440 329 504 570 155 4998
Cases,n 194 17 35 47 20 313
Model 1 1.00 1.07 (0.64, 1.80) 1.45 (0.99, 2.14) 1.77 (1.25, 2.51) 2.88 (1.72, 4.81) ,0.0001 1.19 (1.11, 1.28) ,0.0001
Model 2 1.00 1.03 (0.60, 1.77) 1.43 (0.93, 2.20) 1.62 (1.08, 2.44) 2.51 (1.40, 4.50) 0.02 1.15 (1.06, 1.26) 0.001
BMI$25 to,30
Total,n 2922 381 753 846 283 5185
Cases,n 336 27 87 84 33 567
Model 1 1.00 0.65 (0.43, 0.98) 1.07 (0.83, 1.39) 0.90 (0.70, 1.18) 1.04 (0.71, 1.54) 0.25 1.00 (0.94, 1.05) 0.86
Model 2 1.00 0.69 (0.45, 1.06) 1.14 (0.85, 1.54) 1.02 (0.75, 1.39) 1.13 (0.73, 1.75) 0.34 1.01 (0.95, 1.09) 0.68
BMI$30
Total,n 1340 192 445 518 206 2701
Cases,n 280 33 92 101 40 546
Model 1 1.00 0.84 (0.56, 1.26) 1.06 (0.80, 1.39) 0.94 (0.73, 1.23) 0.98 (0.67, 1.44) 0.87 0.99 (0.94, 1.05) 0.84
Model 2 1.00 0.83 (0.55, 1.26) 0.97 (0.71, 1.33) 0.85 (0.62, 1.16) 0.90 (0.58, 1.40) 0.80 0.97 (0.91, 1.04) 0.44
Impaired fasting glucose4 BMI,25
Total,n 3246 312 469 523 135 4685
Cases,n 1819 169 260 300 82 2630
Model 1 1.00 1.02 (0.80, 1.30) 1.17 (0.95, 1.44) 1.28 (1.06, 1.57) 1.40 (0.97, 2.02) 0.04 1.06 (1.02, 1.11) 0.006
Model 2 1.00 0.98 (0.76, 1.26) 1.17 (0.94, 1.46) 1.32 (1.06, 1.65) 1.48 (1.00, 2.19) 0.07 1.07 (1.01, 1.13) 0.01
BMI$25 to,30
Total,n 2586 354 666 762 250 4618
Cases,n 1833 242 472 534 180 3261
Model 1 1.00 1.00 (0.78, 1.29) 1.08 (0.89, 1.32) 1.05 (0.87, 1.26) 1.12 (0.83, 1.51) 0.90 1.01 (0.97, 1.05) 0.76
Model 2 1.00 1.00 (0.77, 1.29) 1.12 (0.90, 1.40) 1.10 (0.88, 1.36) 1.16 (0.83, 1.62) 0.80 1.01 (0.96, 1.06) 0.72
BMI$30
Total,n 1060 159 353 417 166 2155
Cases,n 814 126 261 335 129 1665
Model 1 1.00 1.20 (0.79, 1.84) 0.91 (0.68, 1.22) 1.26 (0.94, 1.69) 1.08 (0.72, 1.62) 0.38 1.03 (0.97, 1.10) 0.32
Model 2 1.00 1.23 (0.79, 1.90) 0.94 (0.68, 1.32) 1.27 (0.90, 1.80) 1.13 (0.71, 1.81) 0.46 1.04 (0.97, 1.12) 0.30
Impaired glucose tolerance4 BMI,25
Total,n 3246 312 469 523 135 4685
Cases,n 566 51 89 91 15 812
Model 1 1.00 0.99 (0.72, 1.37) 1.20 (0.93, 1.55) 1.06 (0.83, 1.37) 0.62 (0.36, 1.08) 0.26 0.97 (0.92, 1.03) 0.39
Model 2 1.00 0.97 (0.70, 1.34) 1.07 (0.81, 1.43) 0.99 (0.74, 1.32) 0.54 (0.30, 0.98) 0.30 0.94 (0.88, 1.01) 0.10
BMI$25 to,30
Total,n 2586 354 666 762 250 4618
Cases,n 739 104 207 209 50 1309
Model 1 1.00 1.10 (0.85, 1.41) 1.14 (0.94, 1.38) 0.92 (0.76, 1.11) 0.60 (0.43, 0.84) 0.008 0.95 (0.91, 0.99) 0.01
Model 2 1.00 1.03 (0.80, 1.34) 1.09 (0.88, 1.35) 0.89 (0.72, 1.11) 0.56 (0.39, 0.81) 0.01 0.93 (0.89, 0.98) 0.008
BMI$30
Total,n 1060 159 353 417 166 2155
Cases,n 420 61 142 157 64 844
Model 1 1.00 0.89 (0.63, 1.26) 0.99 (0.77, 1.28) 0.86 (0.68, 1.10) 0.89 (0.63, 1.26) 0.74 0.96 (0.91, 1.01) 0.11
Model 2 1.00 0.89 (0.62, 1.28) 0.96 (0.72, 1.29) 0.81 (0.60, 1.08) 0.86 (0.58, 1.28) 0.64 0.94 (0.88, 1.00) 0.06
1Values are ORs (95% CIs) unless otherwise indicated. Adjusted through logistic regression for the following covariates—model 1: adjusted for sex, age (y), race/skin color, and study center. Model 2: model 1 plus educational attainment, current smoking status, leisure time physical activity, hypertension, family history of diabetes, dietary changes in previous 6 mo, alcohol consumption, sugar-sweetened beverage consumption, unsweetened beverage consumption, diet/light food consumption, total energy intake, BMI, and waist-to-hip ratio. For impaired fasting glucose and impaired glucose tolerance analyses,n= 11,458 after exclusion of participants with newly diagnosed diabetes. ASB, artificially sweetened beverage; ELSA-Brasil, Estudo Longitudinal de Sa ´ude do Adulto–Brasil.
2Pvalue represents the test for an overall association of frequency of ASB consumption per day with each respective outcome of interest.
3Pvalue represents the test for an association of an increase in frequency of one additional moment of ASB consumption per day with each respective outcome of interest. 4Tests for interaction by BMI category, model 2: newly diagnosed diabetes,P-interaction = 0.04; impaired fasting glucose,P-interaction = 0.83; impaired glucose tolerance, P-interaction = 0.51.
when it was mostly beverages other than coffee (OR: 1.21; 95% CI: 1.08, 1.35) for each increase in ASB consumption per day (Supplemental Tables 2–5). Last, in secondary analyses (data not shown), no association of ‘‘low-calorie’’ and ‘‘diet’’ foods with diabetes, IFG, or IGT was found in minimally and fully adjusted overall analyses (P $ 0.15 for all outcomes) or in analyses stratified by BMI (P$0.13 for all outcomes).
Discussion
Our finding of an overall null association of ASB consumption with newly diagnosed diabetes when adjusting for baseline adiposity is consistent with the results from 3 previous cohort analyses (12–14).Two previous prospective studies, the Multi-Ethnic Study of Atherosclerosis and French Prospective Etude Epid´emiologique aupre`s des femmes de la Mutuelle G´en´erale de l’Education Nationale, the latter with 14 y of follow-up, did find that daily users of diet soda and ASBs, respectively, had an increased risk of type 2 diabetes, even after adjusting for baseline adiposity (9, 10).
One might suspect that our discordant findings of greater odds of newly diagnosed diabetes, IFG, and poorer b-cell function in normal-weight individuals but not in those with excess weight result from chance. However, results of the 3 previous studies that presented analyses stratified by baseline BMI category, all with incident outcomes, when taken together show greater risk in normal-weight individuals. In the Multi-Ethnic Study of Atherosclerosis, with a smaller number of cases, a somewhat higher but nonsignificant risk was found for normal-weight participants (HR: 1.94; 95% CI: 0.87, 4.35)
than in those with excess weight (HR: 1.54; 95% CI: 1.15, 2.07). In the European Prospective Investigation into Cancer and Nutrition–InterAct study, a decreasing gradient of risk existed across BMI categories (normal weight HR: 1.43; 95% CI: 1.14, 1.80; overweight HR: 1.23; 95% CI: 0.99, 1.52; obese HR: 1.11; 95% CI: 0.74, 1.65; P-interaction = 0.026). Further-more, in the French Prospective Etude Epid´emiologique aupre`s des femmes de la Mutuelle G´en´erale de l’Education Nationale study, some of whose participants overlapped with those of the above-mentioned InterAct study, an inverse gradient of risk also existed across BMI strata (normal weight HR: 2.23; 95% CI: 1.14, 4.36; overweight HR: 2.17; 95% CI: 1.27, 3.68; obese HR: 1.00; 95% CI: 0.52, 1.92).
The presence of this apparent heterogeneity could be explained through one or more mechanisms. Our findings do not support the contention that greater ASB consumption may contribute to higher overall caloric intake due to overcompen-sating the perceived ‘‘calories averted’’ by substituting ASBs for sugar-sweetened beverages with other foods, as our associations in the normal-weight stratum did not change substantially after adjustment for total energy intake (26). Nor do they support the suggestion that ASBs may increase desire to consume sweetened or energy-dense foods (27, 28), as adjusting our models for consumption of energy-dense food items (e.g., fat intake) did not alter our associations (data not shown).
Recently, appreciation has increased of a potential role of alterations of the gut microbiome in mediating the risk of various conditions, including metabolic dysfunction, obesity, and glucose intolerance (29–31). Suez et al. (3) reported that consumption of noncaloric artificial sweeteners (saccharin, sucralose, aspartame) in mice induces glucose intolerance TABLE 4 Adjusted mean changes in measures of glucose homeostasis associated with a 1-unit increase in daily ASB consumption, stratified by BMI: ELSA-Brasil (2008–2010),n= 12,8841
BMI,25 kg/m2(n= 4998) BMI$25 to,30 kg/m2(n= 5185) BMI$30 kg/m2(n= 2701)
For a one unit change in frequency of ASB
consumption/d Pvalue
For a one unit change in frequency of ASB
consumption/d Pvalue
For a one unit change in frequency of ASB
consumption/d Pvalue
Fasting glucose, mg/dL
Model 1 0.4860.14 0.001 0.1060.14 0.46 20.0660.22 0.80
Model 2 0.4360.17 0.01 0.1760.17 0.30 0.2560.26 0.32
2-h postload glucose, mg/dL
Model 1 0.4860.38 0.22 20.4760.37 0.21 20.6160.55 0.27
Model 2 20.1160.43 0.80 20.6460.43 0.14 20.7060.66 0.28
HbA1c, %
Model 1 0.02060.006 0.001 0.00460.006 0.51 0.00660.008 0.48
Model 2 0.02160.007 0.004 0.01560.007 0.03 20.00260.010 0.82
HOMA-IR
Model 1 0.0460.01 0.002 20.0260.02 0.28 20.0960.03 0.002
Model 2 0.0360.01 0.01 20.0360.02 0.19 20.0760.03 0.03
HOMA-b, %
Model 1 20.6860.25 0.007 20.1060.30 0.74 20.5460.51 0.29
Model 2 20.7760.29 0.009 20.0660.35 0.86 21.1060.62 0.08
ISI-composite
Model 1 20.1760.09 0.07 0.1160.06 0.05 0.2060.04 ,0.0001
Model 2 20.0360.10 0.74 0.1460.06 0.02 0.1960.05 0.0002
1Values are mean changes6SEs. Adjusted through multiple linear regression with the following covariates—model 1: adjusted for sex, age (y), race/skin color, and study center. Model 2: model 1 plus educational attainment, current smoking status, leisure time physical activity, hypertension, family history of diabetes, dietary changes in previous 6 mo, alcohol consumption, sugar-sweetened beverage consumption, unsweetened beverage consumption, diet/light food consumption, total energy intake (kcal/d), BMI, and waist-to-hip ratio.Pvalue represents the test for an association of an increase of one moment of ASB consumption per day with each respective outcome of interest. ASB, artificially sweetened beverage; ELSA-Brasil, Estudo Longitudinal de Sa ´ude do Adulto–Brasil; HbA1c, glycated hemoglobin; HOMA-b, homeostasis model assessment ofb-cell function; IFG, impaired fasting glucose; IGT, impaired glucose tolerance; ISI-composite, composite insulin sensitivity index.
through mechanisms involving alterations of the composition and function of intestinal microbiota. In lean mice, these changes in microbiota were linked to major increases in glycan degradation pathways, resulting in the synthesis of various compounds, including SCFAs. Specifically, the investigators report elevated concentrations of propionate and acetate in saccharin-consuming mice, which can act as substrates for gluconeogenesis in the liver (32). Consequently, our findings of a greater association for fasting than for 2-h blood glucose are consistent with these findings in rodents that ASB-mediated effects may be driven by mechanisms operating mostly in the fasting state. Gut-derived metabolites have also been suggested to alter b-cell function (33), which could possibly mediate the decrease in HOMA-b that we found in normal-weight individuals.
The absence of an association of ASBs with diabetes among overweight and obese participants is consistent with an inter-pretation that whatever diabetogenic effect ASBs have is attenuated among those already within higher BMI ranges. In addition, the apparent protective effect of ASBs on postprandial glucose concentrations among the overweight and, to a lesser extent, the obese could be due to confounding—the reflection of an increased usage of ASBs in those who are making a successful effort to reduce caloric intake along with other positive changes in lifestyle and diet.
The strengths of our study include the use of a standard 75-g oral-glucose-tolerance test, measurement of glycated hemoglo-bin, and the assessment of various indicators of insulin resistance andb-cell function. Around one-fourth of our sample reported regularly consuming ASBs at least 3 times/d, allowing us to explore the association of higher ASB consumption amounts with the prevalence of newly diagnosed diabetes, compared to previous studies. Furthermore, the large numbers of newly diagnosed diabetes cases in each of our BMI strata have provided us with greater statistical power to detect the reported differential associations across these strata. Last, by collecting data on the addition of artificial sweetener to several beverages, we were able to provide a more comprehensive analysis of the influence of ASB consumption on diabetes risk than previous studies, which have mainly been limited to artificially sweetened soda consumption or coffee. In this regard, our finding that an ASB-diabetes association in normal-weight individuals was present when coffee was the main ASB was possible given the widespread consumption of sweetened coffee in Brazil.
Some limitations of this study deserve mention. The study was cross-sectional, limiting interpretation with regard to causal direction of associations. However, it is less likely that individ-uals, such as our cases, without knowledge of their diabetes status, would alter their ASB consumption on the basis of symptoms or disease. The food-frequency questionnaire has a large measurement error; however, this would most likely lead to an underestimate of the increased odds we found. ELSA-Brasil did not ascertain the type of artificial sweetener used. But in this regard, sweeteners most commonly used internationally, including saccharin, sucralose, and aspartame, are all marketed in Brazil. That no association in normal-weight individuals was found between newly diagnosed diabetes and greater consumption of ‘‘diet’’ or ‘‘low-calorie’’ foods might be considered an inconsistency. However, although these foods frequently contain artificial sweeteners, they also frequently do not (e.g., ‘‘low-fat’’ or ‘‘low-sodium’’ foods) and were not ascertained in ELSA in a manner permitting distinction in this regard. Last, although attempts were made to statistically adjust for possible confounding variables in our data set, we cannot
rule out the possibility of residual or unknown confounding in our analyses.
In summary, although no overall association between ASB consumption and newly diagnosed diabetes was present, greater consumption of ASBs was associated with a greater prevalence of newly diagnosed diabetes in normal-weight individuals. This association does not place into question the use of ASBs in the overweight or obese, in whom we found, in fact, some improve-ment in postload blood glucose concentrations and measures of insulin resistance, or in those with previously diagnosed diabe-tes, since they were excluded from the analyses. However, our findings do raise the question of ASB use in a large fraction of the population. In light of these findings, further prospective investigation of ASB use in normal-weight individuals is necessary to document their safety.
Acknowledgments
JY, BBD, and MIS conceived or designed the study; JY, BBD, LEC, IMB, SMB, ACG, ISS, and MdFSD analyzed and/or interpreted the data; JY, BBD, LEC, and MIS wrote or assisted in drafting the manuscript; LEC provided guidance on statis-tical analyses; and LEC, IMB, SMB, ACG, ISS, and MdFSD revised the final manuscript. All authors read and approved the final manuscript.
References
1. Mattes RD, Popkin BM. Nonnutritive sweetener consumption in humans: effects on appetite and food intake and their putative mechanisms. Am J Clin Nutr 2009;89:1–14.
2. Sylvetsky AC, Welsh JA, Brown RJ, Vos MB. Low-calorie sweetener consumption is increasing in the United States. Am J Clin Nutr 2012;96:640–6.
3. Suez J, Korem T, Zeevi D, Zilberman-Schapira G, Thaiss CA, Maza O, Israeli D, Zmora N, Gilad S, Weinberger A, et al. Artificial sweeteners induce glucose intolerance by altering the gut microbiota. Nature 2014;514:181–6.
4. Pereira MA. Diet beverages and the risk of obesity, diabetes, and cardiovascular disease: a review of the evidence. Nutr Rev 2013;71:433–40. 5. Greenwood DC, Threapleton DE, Evans CE, Cleghorn CL, Nykjaer C, Woodhead C, Burley VJ. Association between sugar-sweetened and artificially sweetened soft drinks and type 2 diabetes: systematic review and dose-response meta-analysis of prospective studies. Br J Nutr 2014;112:725–34.
6. Fowler SP, Williams K, Resendez RG, Hunt KJ, Hazuda HP, Stern MP. Fueling the obesity epidemic? Artificially sweetened beverage use and long-term weight gain. Obesity (Silver Spring) 2008;16:1894–900. 7. Lutsey PL, Steffen LM, Stevens J. Dietary intake and the development of
the metabolic syndrome: the Atherosclerosis Risk in Communities study. Circulation 2008;117:754–61.
8. Dhingra R, Sullivan L, Jacques PF, Wang TJ, Fox CS, Meigs JB, DÕAgostino RB, Gaziano JM, Vasan RS. Soft drink consumption and risk of developing cardiometabolic risk factors and the metabolic syndrome in middle-aged adults in the community. Circulation 2007;116:480–8.
9. Nettleton JA, Lutsey PL, Wang Y, Lima JA, Michos ED, Jacobs DR. Diet soda intake and risk of incident metabolic syndrome and type 2 diabetes in the Multi-Ethnic Study of Atherosclerosis (MESA). Diabetes Care 2009;32:688–94.
10. Fagherazzi G, Vilier A, Saes Sartorelli D, Lajous M, Balkau B, Clavel-Chapelon F. Consumption of artificially and sugar-sweetened beverages and incident type 2 diabetes in the Etude Epidemiologique aupres des femmes de la Mutelle Generale de lÕEducation Nationale-European Prospective Investigation into Cancer and Nutrition cohort. Am J Clin Nutr 2013;97:517–23.
11. Sakurai M, Nakamura K, Miura K, Takamura T, Yoshita K, Nagasawa SY, Morikawa Y, Ishizaki M, Kido T, Naruse Y, et al. Sugar-sweetened beverage and diet soda consumption and the 7-year risk for type 2 diabetes mellitus in middle-aged Japanese men. Eur J Nutr 2014;53:251–8.
12. Schulze MB, Manson JE, Ludwig DS, Colditz GA, Stampfer MJ, Willett WC, Hu FB. Sugar-sweetened beverages, weight gain, and incidence of type 2 diabetes in young and middle-aged women. JAMA 2004;292:927–34.
13. de Koning L, Malik VS, Rimm EB, Willett WC, Hu FB. Sugar-sweetened and artificially sweetened beverage consumption and risk of type 2 diabetes in men. Am J Clin Nutr 2011;93:1321–7.
14. InterAct Consortium, Romaquera D, Norat T, Wark PA, Vergnaud AC, Schulze MB, van Woudenbergh GJ, Drogan D, Amiano P, Molina-Montes E, et al. Consumption of sweet beverages and type 2 diabetes incidence in European adults: results from EPIC-InterAct. Diabetologia 2013;56:1520–30.
15. Bhupathiraju SN, Pan A, Malik VS, Manson JE, Willett WC, van Dam RM, Hu FB. Caffeinated and caffeine-free beverages and risk of type 2 diabetes. Am J Clin Nutr 2013;97:155–66.
16. OÕConnor L, Imamura F, Lentjes MA, Khaw KT, Wareham NJ, Forouhi NG. Prospective associations and population impact of sweet beverage intake and type 2 diabetes, and effects of substitutions with alternative beverages. Diabetologia 2015;58:1474–83.
17. Duffey KJ, Steffen LM, Van Horn L, Jacobs DR, Jr., Popkin BM. Dietary patterns matter: diet beverages and cardiometabolic risks in the longitudinal Coronary Artery Risk Development in Young Adults (CARDIA) Study. Am J Clin Nutr 2012;95:909–15.
18. Schmidt MI, Duncan BB, Mill JG, Lotufo PA, Chor D, Barreto SM, Aquino EM, Passos VM, Matos SM, Molina MCB, et al. Cohort profile: Longitudinal Study of Adult Health (ELSA-Brasil). Int J Epidemiol 2014 Feb 27 (Epub ahead of print; DOI:10.1093/ije/dyu027).
19. Molina M del CB, Bensenor IM, Cardoso L de O, Velasquez-Melendez G, Drehmer M, Pereira TS, Faria CP, Melere C, Manato L, Gomes AL, et al. Reproducibility and relative validity of the food frequency questionnaire used in the ELSA-Brasil. Cad Saude Publica 2013;29:379–89.
20. WHO. Definition and diagnosis of diabetes mellitus and intermediate hyperglycaemia. Geneva (Switzerland): WHO; 2006.
21. WHO. Use of glycated haemoglobin (HbA1c) in the diagnosis of diabetes mellitus. Geneva (Switzerland): WHO; 2011.
22. American Diabetes Association. Diagnosis and classification of diabetes mellitus. Diabetes Care 2010;33:S62–9.
23. Matthews DR, Hosker JP, Rudenski AS, Naylor BA, Treacher DF, Turner RC. Homeostasis model assessment: insulin resistance and beta-cell function from fasting plasma glucose and insulin concentrations in man. Diabetologia 1985;28:412–9.
24. DeFronzo RA, Matsuda M. Reduced time points to calculate the composite index. Diabetes Care 2010;33:e93.
25. Bensenor IM, Griep RH, Pinto KA, Faria CP, Felisbino-Mendes M, Caetano EI, Albuquerque Lda S, Schmidt MI. Routines of organization of clinical tests and interviews in the ELSA-Brasil investigation center. Rev Saude Publica 2013;47:37–47.
26. Bleich SN, Wolfson JA, Vine S, Wang YC. Diet-beverage consumption and caloric intake among US adults, overall and by body weight. Am J Public Health 2014;104:e72–8.
27. Blundell JE, Hill AJ. Paradoxical effects of an intense sweetener (aspartame) on appetite. Lancet 1986;1:1092–3.
28. Swithers SE, Davidson TL. A role for sweet taste: calorie predictive relations in energy regulation by rats. Behav Neurosci 2008;122:161–73. 29. Holmes E, Li JV, Marchesi JR, Nicholson JK. Gut microbiota
compo-sition and activity in relation to host metabolic phenotype and disease risk. Cell Metab 2012;16:559–64.
30. Larsen N, Vogensen FK, van den Berg FW, Nielsen DS, Andreasen AS, Pedersen BK, Al-Soud WA, Sørensen SJ, Hansen LH, Jakobsen M. Gut microbiota in human adults with type 2 diabetes differs from non-diabetic adults. PLoS One 2010;5:e9085.
31. Sato J, Kanazawa A, Ikeda F, Yoshihara T, Goto H, Abe H, Komiya K, Kawaguchi M, Shimizu T, Ogihara T, et al. Gut dysbiosis and detection of ‘‘live gut bacteria’’ in blood of Japanese patients with type 2 diabetes. Diabetes Care 2014;37:2343–50.
32. Roy CC, Kien CL, Bouthillier L, Levy E. Short-chain fatty acids: ready for prime time? Nutr Clin Pract 2006;21:351–66.
33. Puddu A, Sanguineti R, Montecucco F, Viviani GL. Evidence for the gut microbiota short-chain fatty acids as key pathophysiological molecules improving diabetes. Mediators Inflamm. 2014;2014:162021.