Uncovering Molecular Relaxation Processes with Nonlinear Spectroscopies in the Deep UV
Brantley Andrew West
A dissertation submitted to the faculty of the University of North Carolina at Chapel Hill in partial fulfillment of the requirements for the degree of Doctor of Philosophy in the Department of Physics.
Chapel Hill 2013
ii ©2013
iii Abstract
BRANTLEY ANDREW WEST: Uncovering Molecular Relaxation Processes with Nonlinear Spectroscopies in the Deep UV
(Under the direction of Andrew Moran and Laurie McNeil)
Conical intersections mediate internal conversion dynamics that compete with even the fastest nuclear motions in molecular systems. Traditional kinetic models do not apply in this regime of commensurate electronic and nuclear motion because the surroundings do not maintain equilibrium throughout the relaxation process. This dissertation focuses on uncovering the physics associated with vibronic interactions at conical intersections. Of particular interest are coherent nuclear motions driven by steep excited state potential energy gradients. Technical advances have only recently made these dynamics accessible in many systems including DNA nucleobases and cyclic polyene molecules.
iv
implement two-dimensional ultraviolet spectroscopy (2DUV). This technique is applied at the shortest wavelengths and with the best signal-to-noise ratios reported to date.
Sub-picosecond excited state deactivation processes provide photo stability to the DNA double helix. Vibrational energy transfer from the solute to surrounding solvent enables relaxation of the highly non-equilibrium ground state produced by fast internal conversion. In this dissertation, nonlinear spectroscopies carried out at cryogenic temperatures are used to uncover the particular nuclear modes in the solvent that primarily accept vibrational energy from the solute. These measurements additionally expose a competition between internal conversion and vibrational energy transfer onto the DNA backbone.
v
vi
Acknowledgements
I would like to thank Dr. Andrew Moran for his advice and support over the last four years during the completion of my doctoral research. Never would I have been able to accomplish what has been done without his guidance. I would also like to express my gratitude to Dr. Laurie McNeil, her countless hours during my first year helping me revise and revise again my application for a National Science Foundation East Asia and Pacific Summer Institute fellowship allowed me to travel out of the country for the first time and spend the Summer of 2009 at Nanyang Technological University studying crystal growth techniques. This experience allowed me to take great leaps in my personal and professional life. Dr. Christian Kloc and Tan Ke Jie donated much time, energy, and effort to make this an enjoyable experience for me.
I would also like to thank the graduate students of the Moran Group; most importantly, Dr. Stephen Miller and Dr. Jordan Womick. Their guidance when I first joined the research group was priceless. I would also like to thank graduate students Paul Giokas and Brian Molesky for their help carrying out experimental investigations and providing insightful discussion. Anna Curtis, Nickolaus Montoni, and Andrew Ross also contributed to the investigations presented in this dissertation.
vii
viii Table of Contents
Chapter 1 . Introduction ... 1
1.1. Science at the Interface between Optical and Chemical Physics ...1
1.2. Uncovering Ultrafast Molecular Relaxation Processes in Condensed Phases ...4
1.3. Ultrafast Optical Spectroscopies: Past, Present, and Future ...7
1.4. Excited State Deactivation in DNA Components ...15
1.5. Photoinduced Ring-Opening in Cycloalkenes ...19
1.6. Structure of Dissertation ...25
1.7. References ...27
Chapter 2 . Merging Condensed Phase Dynamics and Nonlinear Optical Spectroscopy ... 34
2.1. From Fermi’s Golden Rule to Quantum Time Correlation Functions ...34
2.2. Properties of Correlation Functions ...41
2.3. Cumulant Expansions in Spectroscopy and Dynamics ...45
2.4. Application of Time Correlation Function to Calculate System Dynamics: Vibrational Cooling and Internal Conversion Rates ...57
2.5. Connecting Time Correlation Functions and Nonlinear Spectroscopic Techniques ...67
ix
2.7. References ...83
Chapter 3 . Femtosecond Laser Pulse Generation, Characterization, and Experimentation in the Ultraviolet... 84
3.1. Chirped Pulse Amplification with Titanium Sapphire Gain Media ...85
3.2. Femtosecond Pulse Generation in the Ultraviolet: Fiber Capillaries and Filamentation ...88
3.3. Dispersion Management in the Ultraviolet ...100
3.4. Four Wave Mixing Interferometry: Transient Grating and Two Dimensional Spectroscopy ...109
3.5. Ongoing Technical Developments ...115
3.6. References ...120
Chapter 4 . Probing Ultrafast Dynamics in Adenine With Mid-UV Four-Wave Mixing Spectroscopies ... 125
4.1. Introduction ...125
4.2. Experimental Methods ...128
4.3. Results and Discussion ...132
4.3. A. Probing Relaxation Processes with Transient Grating Spectroscopy ... 132
4.3. B. Photon Echo Signatures of Tautomerism ... 136
4.4. Conclusion ...142
4.5. References ...144
Chapter 5 . Influence of Temperature on Thymine-to-Solvent Vibrational Energy Transfer ... 148
5.1. Introduction ...148
x
5.3. Results ...153
5.3. A. Effect of Temperature on Relaxation Kinetics ... 153
5.3. B. Photon Echo Signatures of Environmental Motion ... 156
5.4. Phenomenological Model for Vibrational Cooling ...157
5.4. A. Vibrational Cooling Rate ... 158
5.4. B. Coupling of the System to Multiple Brownian Oscillator Coordinates ... 161
5.4. C. Numerical Results ... 163
5.5. Conclusion ...169
5.6. References ...171
Chapter 6 . Interplay Between Vibrational Energy Transfer and Excited State Deactivation in DNA Components ... 176
6.1. Introduction ...176
6.2. Basic Physics of Intramolecular Vibrational Energy Transfer ...180
6.3. Experimental Methods ...186
6.4. Results and Discussion ...188
6.4. A. Probing Ground State Vibrational Cooling Dynamics ... 189
6.4. B. Coupling Between Internal Conversion and Vibrational Energy Flow ... 193
6.4. C. Effect of Solvent Viscosity on Kinetics ... 200
6.5. Concluding Remarks ...202
6.6. References ...205
Chapter 7 . Nonlinear Optical Signatures of Ultraviolet Light-Induced Ring Opening in α-Terpinene ... 210
xi
7.2. Experimental Methods ...214
7.2. A. Generation of 20fs laser pulses with cross-modal phase matching in a hollow-core waveguide ... 214
7.2. B. Transient grating and photon echo spectroscopies ... 219
7.3. Results and Discussion ...221
7.3. A. Analysis of Linear Absorption Line Shapes ... 221
7.3. B. Probing Internal Conversion Dynamics With Transient Absorption Anisotropies ... 225
7.3. C. Signature of Solvation Dynamics in Photon Echo Line Shapes ... 229
7.4. Concluding Remarks ...232
7.5. References ...236
Chapter 8 . Toward Two-Dimensional Photon Echo Spectroscopy with 200nm Laser Pulses ... 241
8.1. Introduction ...241
8.2. Generation and compression of 200 nm laser pulses ...242
8.3. Transient grating and photon echo spectroscopies ...247
8.4. Conclusions ...251
8.5. References ...252
Chapter 9 . Concluding Remarks ... 254
9.1 References ...260
Appendix 1 . Supporting Information for Chapter 4: “Probing Ultrafast Dynamics in Adenine With Mid-UV Four-Wave Mixing Spectroscopies” ... 261
xii
A1.2. Optical Densities and the Correction of Propagation Effects ...261
A1.3. References ...264
Appendix 2 . Supplemental Information for Chapter 4: “Influence of Temperature on Thymine-to-Solvent Vibrational Energy Transfer” ... 265
A2.1. Photon Echo Spectra ...265
A2.2. Relaxation Kinetics in Adenine ...266
A2.3. Model Calculations ...266
A2.4. Estimating the Physically Reasonable Range of TVET ...267
A2.5. Coordinate Dependence of the Solute-Solvent Interaction Operator ...268
A2.6. References ...269
Appendix 3 . Supporting Information for Chapter 6: “Interplay Between Vibrational Energy Transfer and Excited State Deactivation in DNA Components”... 271
A3.1. Fitting Parameters for Transient Grating and Fluorescence-Downconversion Signals in the Thymine Family of Systems ...271
A3.2. Ruling Out Contributions from Delocalized Electronic Excitations in the Thymine Dinucleotide ...273
A3.3. Examination of 9-methyladenine and adenosine ...276
A3.4. Phasing of Transient Grating Signals With Dispersive Thermal Grating ...281
A3.5. References ...283
Appendix 4 . Supporting Information for Chapter 7: “Nonlinear Optical Signal of Ultraviolet Light Induced Ring Opening in α –Terpinine ... 284
A4.1 Model for the Transient Absorption Anisotropy ...284
A4.2. Evaluation of Constraints in Model Calculations ...287
xiii List of Tables
Table 4.1. Fitting parameters for transient grating signals shown in Figure 4.3 ... 135
Table 5.1. Fitting parameters for transient grating signals shown in Figure 5.2 ... 155
Table 5.2. Parameters used in rate calculations ... 165
Table 6.1. Arrhenius Fitting Parameters for Figure 6.7 ... 197
Table 7.1. Summary of phase matching conditions for argon-filled hollow-core fiber . 217 Table 7.2. Fitting Parameters for Linear Absorbance Line Shape ... 223
Table 7.3. Fitting Parameters for Transient Absorption Anisotropies ... 228
Table 7.4. Model Parameters for Transient Absorption Anisotropies ... 235
Table A3.1. TG Fitting Parameters at 100K ... 271
Table A3.2. TG Fitting Parameters at 166K ... 272
Table A3.3. TG Fitting Parameters at 233K ... 272
Table A3.4. TG Fitting Parameters at 300K ... 273
Table A3.5. TRF Fitting Parameters at 300K ... 273
Table A3.6. TG Fitting Parameters for Adenine Systems at 100K ... 279
Table A3.7. TG Fitting Parameters for Adenine Systems at 167K ... 279
Table A3.8. TG Fitting Parameters for Adenine Systems at 233K ... 280
Table A3.9. TG Fitting Parameters for Adenine Systems at 300K ... 280
xiv List of Figures
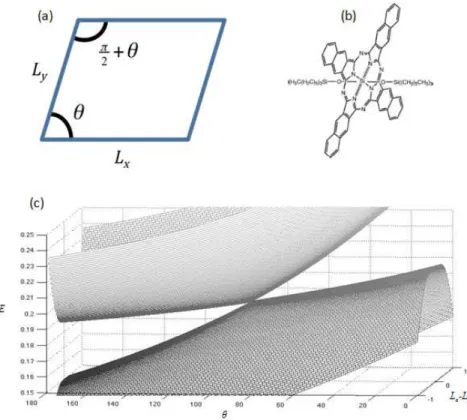
Figure 1.1. (a) Simple diagrammatic representation of the model system, a 2D potential well. Lx and Ly are the lengths of the box in the x-dimension and
y-dimension respectively. θ is one angle between Lx and Ly. (b) Example of molecule
where 2D particle in a box model applies from Ref. 32. (c) A plot of the model system’s potential energy surfaces. The two surfaces form a conical intersection
when Lx Ly 0 and θ 90°. ... 6 Figure 1.2. Transient grating and transient absorption spectroscopies can be
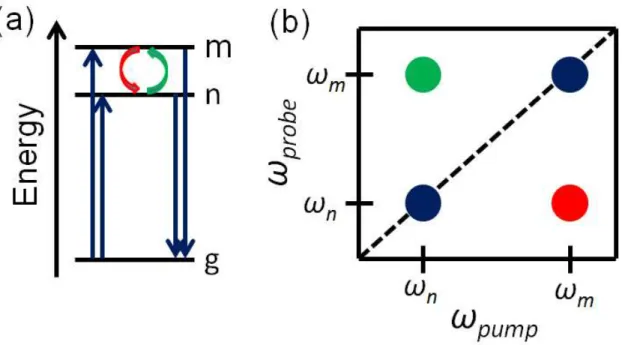
wavelength resolved in the probe dimension (i.e. insensitive to pump wavelength). However, 2D spectroscopy is able to produce spectra which are resolved in both the pump and probe dimensions. This is the origin of the two dimensional nature of the technique. ... 10 Figure 1.3. 2D spectroscopy is able to follow dynamics which involve molecular
absorption at ωm(ωn), followed by probe pulse interaction at ωn(ωm). States m and n
can represent anything from vibrational resonances for different isomers of a
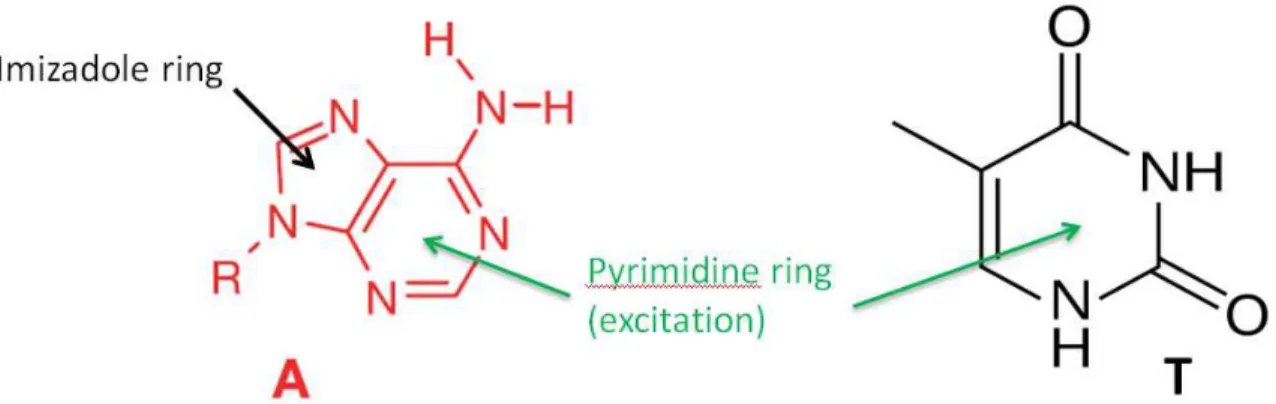
particular molecule to pigment excitations in a photosynthetic complex (i.e. Frenkel exciton states). (a) Transitions (red and green arrows) such as energy transfer, isomerization, or protein folding that happens in the pump-probe delay will show up as cross peaks in (b) the 2D spectrum (red and green crosspeaks). ... 11 Figure 1.4. Shown is the structure of purine molecules and pyrimidine molecules
represented by Adenine (A) and Thymine (T), respectively. The purine molecules
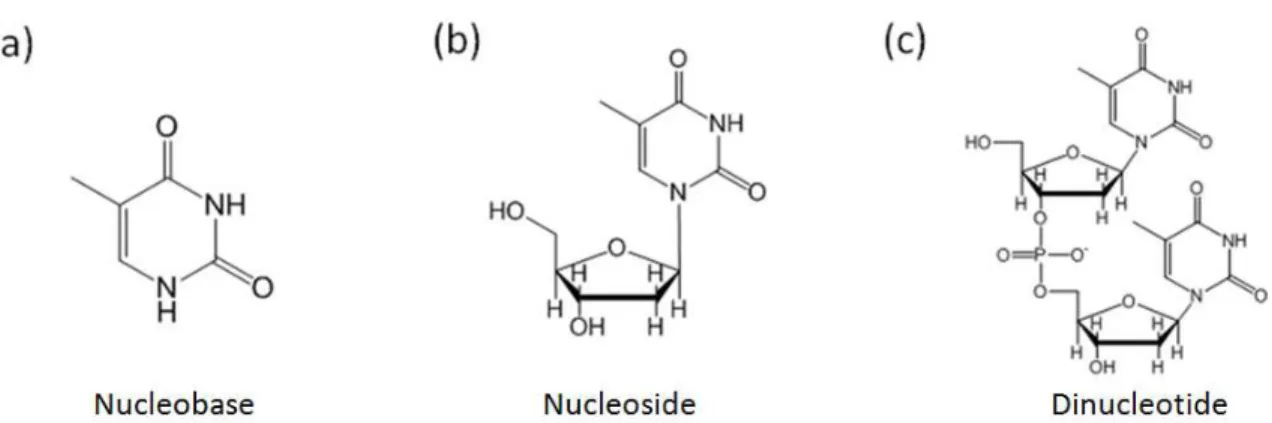
have an imizadole ring in addition to the pyrimidine ring. ... 16 Figure 1.5. Shown are the Thymine nucleobase, nucleoside, and dinucleotide.
Progression from left to right shows increasing molecular size and therefore
increasing vibrational degrees of freedom. The impact on vibrational energy transfer (i.e. heat flow) due to these additional degrees of freedom will be examined. ... 19 Figure 1.6. Photoinduced ring opening reaction of CHD and α-TP. These reaction schemes show only one of the possible isomers generated through ring opening. UV photon absorption by CHD (a) or α-TP (b) induces a chemical reaction which
transforms the cycloalkene into a polyene photoproduct. ... 20 Figure 1.7. The relaxation scheme for cyclohexadiene (CHD) is shown.
Photoexcitation into the 1B state initiates wavepacket motion towards a conical intersection with state 2A. State 2A then transfers population to the ground state, usually denoted 1A, within 80fs. Approximately 40% of the photoexcitations produce hexatriene (HT) in solution, whereas the yield is near 100% in the gas phase. Dynamics in α-TP are thought to follow a similar energetic scheme.
xv
Figure 2.1. The probability of finding the system in state n at time “t” if initially residing in state m at t=0 as calculated by Equation 2.4. As “t” increases, the probability of being found in state n increases as long as the perturbative radiation is near resonance with
ω
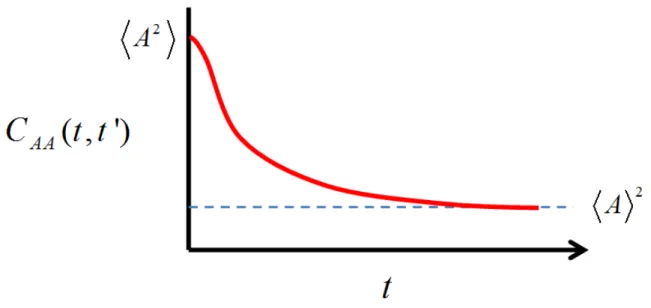
nm. ... 37 Figure 2.2. The correlation function CAA( , ')t t is initially equal to the mean squarevalue of the observable 2
A . However, after sufficient time has allowed stochastic motions to dephase the correlation between the different time values, the correlation function decays to the square of the mean value of A. Spectroscopic line shapes and transition rates originate in the time scale and functional form of this decay. This plot is intentionally drawn to exhibit non-exponential behavior to underscore the
point that the decays may assume a fairly complex functional form. ... 44 Figure 2.3. Fluctuations in a molecular energy gap are caused by random thermal motions of the surrounding environment. Two parameters, ∆ and Λ−1, are used to describe the fluctuation amplitude and the timescale of fluctuation relaxation,
respectively. ... 47 Figure 2.4. The g t
( )
function damps oscillations in the correlation function. g t( )
represents dephasing due to random perturbation from the environment andeventually leads to motion that is uncorrelated with the initial conditions after a
certain amount of time has passed. ... 51 Figure 2.5. Correlation functions are shown for the two limits of line broadening in panel (b). Using Equation 2.52, the absorbance lineshapes are calculated in the strong and weak coupling regime in panel (a). The bath time scale is 100fs for this calculation. For strong:weak coupling Λ ∆/ is equal to 0.1:1 respectively.
Transition bandwidth and detuning from the transition frequency increases as
system-bath coupling increases. ... 55 Figure 2.6. (a) Displacement of ground and excited potential energy surfaces with
respect to the nuclear coordinate initiates photon absorption into a vibrational manifold in the excited state. (b) Absorption into this manifold peaks at a particular quanta in the excited state and is captured by a nonzero gUD
( )
t . The bath time scale is 100fs for this calculation. For strong/weak coupling Λ ∆/ is equal to 0.1/1respectively. ... 56 Figure 2.7. (a) Schematic of model vibrational cooling mechanism for an excited
harmonic oscillator in the presence of a heat bath possessing two mechanisms of relaxation. CL and CH are respectively the low and high frequency components of the
spectral density. CL represents thermally populated stochastic motions of the heat
xvi
part of heat bath. (b) A plot of the spectral densities obtained with the parameters utilized in Ch. 5. (c) The low frequency part of the spectral density as a function of the bath time scale, a ‘fast’ bath (0.1ps bath time scale) has a spectral density that peaks near 10 cm-1 whereas the slow bath (>1ps bath time scale) maximizes at much lower frequency. ... 61 Figure 2.8. (a) Internal conversion sends electronic population from state a to state
b . In this model it is assumed that the population starts in the lowest energy
vibrational state in a and then makes a transition to any possible vibrational level in state b . (b) The bandwidths associated with each relaxation channel are directly related to the lineshapes of the potential energy surfaces. These are determined by the strength of the system bath coupling. System bath coupling varies the bandwidth and center transition frequency of the transitions just like shown in Figure 2.5. ... 62 Figure 2.9. Blue text indicates the donating and accepting energy states respectively (donor, acceptor). (a) Internal conversion from state a to b with zero displacement along the nuclear coordinate is dominated by the transition to the singly excited vibrational quanta state of electronic state b . The transition bandwidth is much broader in the strong coupling limit. (b) In the case of non-zero displacement the transition can convert to any of the vibrational states in electronic state b resulting in multiple relaxation pathways. Note there are two local maxima; this is not the case
for the vibrational progression in the absorption spectrum. ... 67 Figure 2.10. Feynman diagrams for a three level system where. Ea <Eb <Ec Time intervals
t
1,t
2, andt
3 represent the time between interactions with the electricfields. The response function can be generated from each diagram and these can be summed and used to compute the polarization in the sample. Ground state bleach (GSB) and excited state emission (ESE) terms correspond to a decrease in absorption while excited state absorption terms show an increase in absorption (positive sign). ... 76 Figure 2.11. Timing scheme of laser pulses in the four wave mixing experiments
implemented in this dissertation. For transient grating experiments, τ =0 and the time delay T is scanned until signal has fully decayed. In 2D experiments, T is held fixed and τ is scanned over a full range of positive and negative values to characterize the signal decay. The time delay
t
is a property of the solute and not experimentally controlled. LO is the local oscillator pulse used as the reference field for interferometric detection, this will be discussed further in Chapter 3, Section 4. ... 78 Figure 2.12. Cartoons representing the physics behind two dimensional spectra. (a) For times short compared to the relaxation timescale of the surroundings (decay time of correlation functions), Λ−1, the pumped and probed dimensions are highly correlated and the ratio of antidiagonal to diagonal linewidth is very small (
/ 1
ad d
xvii
Figure 3.1. Second order parametric interactions can occur in a polarizable medium with a non-zero second order susceptibility,
χ ω
2( ). This interaction occurs with high photon density typically accessible only by pulsed lasers. P( )2 =χ( )2 E2describes the characteristics of this interaction, photons with the sum frequency and difference frequency are created. The photonsω1 andω2can come from the same or different laser pulses. In the special case when
ω ω
1= 2, the sum frequencygeneration process is known as second harmonic generation (SHG). ... 85 Figure 3.2. The process of generating an amplified, compressed, multi-joule laser
pulse starts with the generation a ‘seed’ pulse in a Ti:Sapphire oscillator. This pulse then goes through the stretcher, lengthening the pulse in time by a factor of 1,000. The pulse is then amplified in the regenerative amplifier and the multipass amplifier. After passing through the compressor, the laser pulse is ‘short’ and ready for use in experimentation. The values shown are from our lab but are representative of typical amplifier values.3 ... 88 Figure 3.3. (a) In a collinear OPA the group velocity mismatch of the signal and
idler pulse limit the bandwidth and pulse energy that can be obtained in the
amplification process. (b) In a NOPA, a slight angleβ is geometrically introduced between the pump and seed pulse which allows the signal and idler pulses to remain overlapped for a longer distance in the crystal and broader bandwidths to be
obtained.(c) NOPA in operation on optical table in the Moran laboratory. ... 91 Figure 3.4. Four Wave Mixing (FWM) in isotropic media such as noble gases allows for third order interactions to occur. (a) The energy level scheme for the FWM interaction that can be utilized to produce UV laser pulses with broad bandwidth and high energy. (b) The output wavelength for a FWM process with a variable
wavelength idler pulse according to the interaction given by Equation 3.5 is plotted. This plot shows how broad tunability can be introduced with the use of a NOPA pulse as the idler. In this research, the idler wavelength is 800 nm and the third
harmonic of Ti:Sapphire (267nm) output is the generated laser pulse. ... 94 Figure 3.5. Schematic of third harmonic generation setup in the Moran laboratory. BBO is a beta-barium borate crystal used to generate 400nm from the 800nm fundamental pulse. ND is neutral density (wavelength independent) attenuators to control the energy of laser pulses entering the fiber. λ/ 2 is a waveplate used to control the polarization of the fundamental beam before entering the fiber. PM is a parabolic mirror for collimating. Dispersion compensating mirrors (DCMs) and
fused silica (FS) prisms are used to control the dispersion of the laser pulse. ... 95 Figure 3.6. (a) Comparison of third harmonic laser pulses generated in 850Torr
xviii
Figure 3.7. Fourth harmonic (200nm) pulses created via cascaded FWM processes in the hollow core fiber setup possessed desirable bandwidths but not enough pulse
energy for experimentation. ... 99 Figure 3.8. Results from filamentation setup for generating fourth harmonic pumped by the 800nm fundamental. (a) Setup for generation of 200nm pulse. 800nm and 400nm pulses are focused in air /argon to create filamentation and produce fourth harmonic. (b)The combined filament is twice as long as that for each individual
beam. (c) The output spectrum for 200nm pulse. ... 100 Figure 3.9. The effect of GDD is shown in panel (a). 1000fs2 of dispersion has a
significant impact on the pulse duration of pulses less than 40fs. A 20fs pulse is stretched by a factor of 2 due to this amount of dispersion, a 60fs pulse is barely affected. Panel (b) shows how pulses with shorter wavelengths are much more
sensitive to a dispersive medium. ... 104 Figure 3.10. Prism compressor setup utilized in lab to impart negative GDD on
femtosecond laser pulses. The input pulse is positively chirped and hits the first prism which refracts and causes the beam to diverge. Red wavelengths pass through more glass than blue wavelengths in the second prism. M1 reflects the dispersed
pulse back through the prism and M2 reflects it on towards the experiment. ... 108 Figure 3.11. The view of the nonlinear experiments employed in lab to highlight the differences with traditional pump probe spectroscopy. In pump probe spectroscopy, only two beams are utilized, a pump pulse and a probe pulse. Keys of this setup are background free and interferometric signal detection. Three laser pulses (2 pump, 1 probe) induce signal emission. ... 110 Figure 3.12. Basic schematic of our four wave mixing interferometer. Two pulses are sent into the setup with a mechanically controlled delay between them. The pulses are focused onto a diffractive optic and a mask is used to create the beam pattern shown on the mirror. The four beams are then sent to the sample (see Figure 3.11). Prism wedges are inserted into the paths of pulses 1 and 2 to control their relative delay. This delay is scanned in 2DUV experiments. All four beams are incident at the sample, pulses 1, 2, and 3 induce signal emission and pulse 4 is used as a reference field for interferometric detection of the signal. A typical
interferogram is shown. ... 111 Figure 3.13. Measured transient grating signal profiles as a function of pump probe delay. The left figure is taken with interferometric detection and the right with homodyne detection (i.e. collected without the local oscillator). The amplification of the signal with heterodyne detection is obvious. The observed modulation in the signal is due to coherent oscillation of the 800 cm-1 Raman active mode in
xix
Figure 3.14. (a) Compressed third harmonic FROG spectrogram measured in the experimental setup with homodyne detection. All wavelengths arriving
simultaneously (vertically aligned spectrogram) indicates proper pulse compression. (b) View of vibrational coherence of cyclohexane over a larger delay range than in
Figure 3.13. ... 115 Figure 3.15. Comparison of original Q-light fiber oscillator spectrum with the
Ti:Sapphire oscillator spectrum installed in the spring of 2012. The bandwidth of the Ti:Sapphire oscillator is more than four times that of the fiber oscillator (and this is a conservative spectrum for the new oscillator). ... 116 Figure 3.16. Spectra taken inside the Quantronix laser amplifier. The oscillator
spectrum shows the Ti:Saphhire seed pulse that was installed in lab Spring 2012. The ‘stretcher’ pulse shows clipping on the red side of the spectrum. The ‘amplifier’ demonstrates the typical red shift observed between the amplified laser pulse and the seed pulse. This is due to the chirped pulse amplification technique. Red
wavelengths precede blue wavelengths in the amplifer and are more strongly amplified. Comparing the ‘compressor’ pulse to the ‘amplifier’ pulse shows how bandwidth is further cutoff by the optics in the compressor. After moving the
stretcher and compressor outside the amplifier, this clipping no longer occurred. ... 117 Figure 3.17. Shown are fourth harmonic spectra taken before and after the upgrade to the laser amplification system in Spring 2013. Recent measurements have indicated that 200nm pulses possess a time duration of 30fs. Further work is being undertaken to push this lower and utilize these pulses for experimentation. ... 119 Figure 4.1. (a) Structures of the 7HA and 9HA tautomers of adenine. (b) Laser
spectrum (black) overlaid on the linear absorbance spectra of adenine (blue),
9-methyladenine (green), and 7-9-methyladenine (red). ... 127 Figure 4.2. Absolute value of TG signal measured for a solution of adenine with an optical density of 0.75 in a 0.5mm path length. The spike at T=0, which is primarily caused by the electronic polarizability of the solvent, is 10 times larger than the
signal radiated by adenine at T=1ps. ... 132 Figure 4.3. (a) Absolute value of TG signals obtained at T=0.5ps (black) and T
=100ps (red). Ppeak is the peak power associated with each of the three incoming laser pulses. The desired third-order signal varies linearly with respect to 3/ 2
peak
P . (b) Fits of the absorptive components of TG signals acquired at various peak powers. The measured signals and fits are overlaid in the Supporting Information. (c) Absolute value of TG signal obtained for the pure buffer at a peak power of
1.4GW/cm2... 134 Figure 4.4. (a) Absorptive components of TG signals acquired under the SZZZZ
( )
Txx
“bleach”. (b) Transient absorption anisotropy generated using the tensor elements shown in panel (a). The anisotropy is fit using,
( )
2(
)
1 iexp / i i
S T =
∑
= A −T τ where 1A =0.12, τ1=1.13ps, A2 =0.28, and τ2=18.5ps. ... 137 Figure 4.5. Absorptive part of 2DPE spectra acquired for aqueous solutions of
(a)-(d) adenine; (e)-(h) 9-methyladenine; (i)-(l) 7-methyladenine. The delay times are organized as follows: T=0.15ps (first column); T=0.20ps (second column); T
=0.60ps (third column); T=3.00ps (fourth column). The amplitude of each spectrum is normalized to 1. The quasi-instantaneous response of the solvent prevents the
measurement of spectra at T<0.15ps. ... 138 Figure 4.6. Ratio in the anti-diagonal, Γad, and diagonal, Γd , 2DPE line widths
obtained for adenine (blue), 9-methyladenine (green), and 7-methyladenine (red). These data suggest that solvation of the 7HA tautomer contributes to dynamics in the 2DPE line shape of adenine at T≤0.3ps. ... 139 Figure 4.7. Schematic explaining the influence of solvation on the GSB signal
component of 7HA. Photoexcitation at energies greater than the peak of the linear absorbance spectrum produces a “hole” wavepacket in the ground electronic state. Equilibration of the wavepacket causes a red-shift in the signal emission frequency,
t
ω .66 This solvation process causes amplitude in the 2DPE spectrum to concentrate below the diagonal (ωτ =ωt) as T increases. ... 140 Figure 4.8. Summary of relaxation processes in the (a) 7HA and (b) 9HA tautomers of adenine. ESA influences the 2DPE line shapes of only 7HA at T>0.3ps because it possesses a longer ππ* excited state lifetime than 9HA. We postulate that
interference between GSB and ESA nonlinearities gives rise to the dynamics
observed in the 2DPE line shapes of adenine at T>0.3ps. ... 142 Figure 5.1. Absorbance spectra of thymine in an 85:15 mixture of methanol:water at 100K (black) and 300K (red). Also shown is the spectrum of the laser (blue) used in TG and 2DPE measurements. The structure of thymine is displayed in the inset. ... 150 Figure 5.2. Absorptive part of TG signal field measured for thymine at (a) 100K and (b) 300K. The experiments are conducted with 25fs, 38000cm-1 laser pulses under
the magic angle polarization condition. Fitting parameters are given in Table 5.1. ... 154 Figure 5.3. Absorptive 2DPE spectra measured at (a) 100K and (b) 300K with T
=0.6ps. The electronic polarizability of the solvent prevents the acquisition of signals at T<0.1ps.46,67 The spectra are plotted on a linear scale with 13 equally spaced contour lines. (c) The ratio in the anti-diagonal and diagonal line width, Γad/Γd, is plotted with respect to the (logarithmic) pulse delay at 100K (blue) and 300K
xxi
Figure 5.4. (a) Vibrational cooling occurs by way of two relaxation channels associated with the spectral densities, CL
( )
ω and CH( )
ω . (b) The transfer of vibrational energy corresponding to CL( )
ω is governed by two parameters, λ andΛ. λ is the coupling strength between the solute and the primary solvent shell (i.e., primary Brownian oscillator). Λ is the rate at which fluctuations in the primary solvent shell, and in turn the solute, relax through energy exchange with the secondary solvent shell (i.e., secondary Brownian oscillators). Section 2.2 further
discusses the spectral density ... 163 Figure 5.5. (a) Φ
(
ωmn;TBath)
is computed at (a) TBath=100K and (b) TBath=300K with the parameters given in Table 5.2. The time scales of the bath, Λ−1, are specified in the Figure legend. (c) Ratio in Φ
(
ωmn;TBath)
calculated at 300K and 100K for the equilibrium system (i.e., TVET=0 in Equation (5.14)). A rate enhancement is predicted only when Λ−1exceeds 0.1ps. Φ
(
ωmn;TBath)
is calculated at highertemperatures of the bath, TBath , in Appendix 2.67 ... 167 Figure 5.6. η ω
(
mn;TVET)
is computed at (a)1 −
Λ =0.1ps, (b) Λ−1
=1.0ps, (c) Λ−1 =10ps with the parameters given in Table 5.2. These calculations predict that the TG experiments should find a significant enhancement in the rate of vibrational cooling (at 300K versus 100K) provided that: (i) the time scale of the solvent, Λ−1
, is much greater 0.1ps; (ii) the VC induced increase in the temperature of the bath, TVET , is
less than 300K. ... 167 Figure 6.1. Photoinduced relaxation is investigated in the thymine family of systems in the top row: (a) thymine; (b) thymidine; (c) thymine dinucleotide. These
molecules are chosen to expose the interplay between internal conversion and vibrational energy transfer between the base and components of the DNA backbone (e.g., deoxyribose ring, neighboring unit). Signal interpretation is aided by
comparisons to (d) 9-methyladenine and (e) adenosine. ... 177 Figure 6.2. Section II presents a phenomenological model for VET. Shown here are free energy surfaces associated with the initial m and final states, m and n , in Equation (7). The total VET rate is given by the sum over all relaxation channels, which each possess independent bath coordinates whose displacements and
xxii
Figure 6.4. TG and TRF measurements conducted at 300K provide time constants associated with equilibrium recovery (red) and the ππ* lifetimes (blue), respectively. The inverse of the vibrational cooling rate in the ground state, kVC−1 (black), is
estimated using the two-step kinetic scheme defined in Equation (6.16). The error
bars correspond to twice the standard errors of the fits. ... 191 Figure 6.5. The time scale of equilibrium recovery is probed using TG spectroscopy at 100K (left), 166K (middle), and 233K (right). Absorptive parts of the TG signals are displayed for thymine (top), thymidine (middle), and the thymine dinucleotide (bottom). Each transient is fit to a sum of two exponentials (i.e., one rising and one decaying component). Fitting parameters are tabulated in Appendix 3. ... 194 Figure 6.6. Summary of transient grating time constants obtained for all thymine
systems at all temperatures. The error bars correspond to twice the standard errors in the fits... 195 Figure 6.7. (a) ππ* lifetimes obtained for the thymine family of systems at
temperatures ranging from 100K to 300K. The lifetimes increase with the size of the substituent at all temperatures. (b) Arrhenius plots for internal conversion rates, k . IC Fitting parameters are given in Table 6.1. ... 196 Figure 6.8. (a) Photoexcitation produces a vibrationally “hot” wavepacket which
then relaxes through VET onto the substituent. This loss of heat causes the wavepacket to narrow and sink deeper into the potential energy well, thereby suppressing internal conversion. (b) The two VET channels indicated in panel (a) are drawn on the molecular structure of the thymine dinucletide. Vibrational energy first flows onto the deoxyribose ring then onto the adjacent unit. ... 199 Figure 6.9. Excited state lifetimes of 9-methyladenine (black) and adenosine (red)
obtained using a procedure analogous to that applied to the thymine family of systems (cf., Equation (16)). The data show that the lifetime of 9-methyladenine is temperature-independent, whereas that in adenosine increases by a factor of 2.5 in the frozen sample at 100K. This behavior is interpreted as a viscosity dependent effect. The full set of experiments used to generate these time constants is presented in the Supporting Information. ... 201 Figure 7.1. Photoinduced ring opening reaction of α-terpinene. This reaction
scheme shows only one of the possible isomers generated through ring opening... 211 Figure 7.2. Relaxation scheme for cyclohexadiene (CHD). Photoexcitation into the 1B state initiates (mostly) symmetric wavepacket motion towards a conical
intersection with state 2A. State 2A transfers population to the ground state within 80fs. Ground state recovery is accompanied by asymmetric nuclear motion.
xxiii
opening process in α–terpinene (α-TP). In this work, we refer to the electronic states of α-TP in this same notation to facilitate comparisons with CHD. This figure is
adapted from Reference 2 with permission of the American Chemical Society. ... 213 Figure 7.3. (a) Photographs of the 400nm and 800nm beams at the exit of the
hollow core fiber at 850 Torr. (b) Photographs of the 267nm laser beam at the fiber exit at four pressures where phase matching is observed. The full-width half-maximum spectral widths (c) and pulse energies (d) at 267nm are plotted with respect to the pressure in the fiber. The blue and red points respectively correspond to measurements conducted with 180fs and 90fs pulses at 800nm. ... 216 Figure 7.4. (a) Transient grating signal amplitude measured in cyclohexane with
20fs laser pulses at 267nm. (b) The dispersive part of transient grating signal field reveals oscillations with a 42fs period, which correspond to a Raman active
vibrational mode of cyclohexane 38. ... 218 Figure 7.5. Pulse sequence used in TG and 2DPE spectroscopies. Photoexcitation of the system takes place during the experimentally controlled delay, τ ; internal
conversion and ring opening dynamics occur during the population time, T ; the signal is radiated in the emission time,
t
. TG experiments scan T with τ=0, whereas 2DPE uncovers correlations in the excitation and emission frequencies, ωτ and ωt, at various T. All three pulses are centered at 37500cm-1 and have 20fs durations. This figure is adapted from Reference 29 with permission of the American Chemical Society. ... 220 Figure 7.6. Measured (black) and calculated (red) absorbance spectra for α-TP. The data are fit under the assumption of both (a) non-exponential and (b) exponential population decay. Absorbance spectra are computed using Equation (5) and the fitting parameters given in Table 7.2. These fits focus on the absorbance line shape below 38000cm-1 because of interference with a higher energy resonance. ... 224 Figure 7.7. (a) Absorptive (real) parts of TG signal fields measured for α-TP withparallel (black) and perpendicular (red) pump and probe polarizations. In this
representation, signals with positive and negative signs correspond to a photoinduced absorption and bleach, respectively. (b) The measured anisotropy is fit under the assumption of (red) exponential and (blue) non-exponential relaxation dynamics. Fitting parameters are given in Table 7.3. (c) TG signals acquired with parallel and perpendicular pump and probe polarizations are simulated using Equations (A11) and (A12) with the parameters given in Table 7.4. (d) Measured and calculated anisotropies are compared. The parameter,
η
, captures the non-exponential shape of the population decay, whereaspossesses small contributions from nuclear dynamics. These data suggest that the depopulation of state 1B follows a Gaussian-likexxiv
Figure 7.8. (a) Absorptive (real) parts of 2DPE spectra acquired for α-TP at (a) T =100fs; (b) T=125fs; (c) T=225fs; (d) T=500fs. The magic angle polarization
condition is employed. ... 230 Figure 7.9. (a) Ratio in the anti-diagonal, Γad , and diagonal, Γd , 2DPE line
widths obtained for α-TP with magic angle polarizations. The ratio is fit using
( )
2(
)
0 i 1 iexp / i
F T = A +
∑
= A −T τ , where A0=1.35, A1=-0.45, τ1=19.8fs, A2=-0.48, andτ2=36.8ps. (b) The residual corresponding to panel (a) is fit using( )
0 1exp(
/ damp)
sin 2(
c)
/F T =A +A −T τ π T −T w, where A0=-0.010, A1=0.026, C
T =36.4fs, τdamp=590 fs, and w =63.7fs. The 523cm-1 recurrence is assigned to a vibrational mode involving both C=C torsion and HOOP motion on the vinyl group. This suggests that the 523cm-1 mode possesses a large excited state potential energy gradient (on the 1B surface) at the equilibrium geometry of the molecule. ... 231 Figure 7.10. Residual sum of squares (RSS) for (a) anisotropy and TG signals
acquired with (b) parallel and (c) perpendicular pump and probe electric field polarizations. The RSS in (b) and (c) are divided by 108 (i.e., the signal levels are arbitrary). Formulas for the RSS are given in appendix B. It is concluded that the depopulation dynamics of state 1B follow a non-exponential temporal profile in
which
η
ranges from 1.7 to 3.2. ... 233 Figure 8.1. (a) Setup used for 200 nm pulse generation and compression. (b)Diffractive optic-based interferometer used for TG and 2DPE measurements. The 200 nm laser pulse probes the holographic grating induced in the sample by the pair of 20 fs, 267 nm pulses. ... 243 Figure 8.2. (a) Spectra of 200 nm light generated in air and (b) argon at the pressures indicated in the figure legends. (c) Pulse energies measured at 200 nm in air and argon. (d) Spatial profile of 200 nm laser beam derived by processing a photograph with the image utility in Matlab. (e) Photographs of filaments generated with individual 800 nm and 400 nm laser beams are shown below the filament obtained when both beams are overlapped. These filaments were produced in air at
atmospheric pressure. ... 245 Figure 8.3. (Top Row) TG spectrograms acquired with 20 fs, 267 nm gate pulses in a 250 µm thick fused silica window. Fused silica prisms are separated by (a) 10 cm and (b) 6.3 cm. (c) Calcium fluoride prisms are separated by 10 cm. These 200 nm pulses are generated in air at atmospheric pressure. (Bottom Row) TG spectrograms acquired with 20 fs, 267 nm gate pulses in a 50 µm thick BBO crystal. (d)
xxv
Figure 8.4. Experiments conducted on adenosine in aqueous solution at pH=7. (a) Spectra of laser pulses overlaid on absorbance spectrum of adenosine. (b) Real (absorptive) parts of TG signals acquired with 267 nm pump pulses and either 267 nm (red) or 200 nm (blue) probe pulses. (c) Signal detected at 200 nm plotted with respect to the coherence time, . Absolute value of rephasing 2DPE signals acquired at (d) =250 fs, (e) =500 fs, and (f) =1000 fs. ... 248 Figure 9.1. Gaussian simulation of the vibrational mode set in motion by UV
photon excitation. Shown are the two turning points of the oscillation. Note the strong displacement about twisting of the carbon double bonds comparing (a) to (b). This is the coordinate thought to be most important for passage through the conical intersection in these ring opening systems... 256 Figure 9.2. (a) Photo excitation places the wavepacket of the ring opening
molecules on excited state 1B, setting in motion twisting about carbon double bonds. (b) Transitions between energy states occur impulsively compared to period of wavepacket oscillation. (c) Once the wavepacket returns to the ground state,
coherent motion about the ring deformation/twisting motion persists. ... 257 Figure 9.3. The optical cycle as a function of the laser pulse wavelength represents the shortest pulses that can be obtained. Attosecond laser pulses could potentially be achieved in the 100-200nm range where current techniques could be used. ... 258 Figure A1.1. Real (absorptive) part of TG signals measured for adenine at the peak powers indicated in the respective panels. Fitting parameters are given in Table 1 of the main paper. The fluence is 4.65x10¹³ photons/cm2 at 1.4GW/cm2, which results in excitation of 0.4% of the molecules in the focal volume... 261 Figure A1.2. Real part of photon echo spectra measured for adenine in a 0.5mm
cuvette at T=0.5ps with optical densities (OD) of: (a)-(b) 0.5; (c)-(d) 0.75; (e)-(f) 1.0. Directly measured spectra,
(
)
0( )
2
ˆ , ; / ˆ
D t d t
S− ω ωτ T ε ω , are presented in the left column. Spectra in the right column, Sˆ2++D
(
ω ωt, τ;T)
, are corrected for propagating effects using Equation (S3). ODs >0.5 must be employed to obtain adequate signal strength. As seen in panels (e) and (f), distortions in the spectra are found at ODs near 1.0. Photon echo experiments are therefore performed with ODs<0.75. Application of Equation (S3) has little effect on the spectra because the absorption line widths are broad compared to the laser pulse width (cf., Figure 1b of mainpaper). ... 263 Figure A2.1. Absorptive parts of photon echo spectra acquired at the following
xxvi
Figure A2.2. Absorptive part of transient grating signal field measured for adenine at 100K (black) and 300K (red). The experiments are conducted with 25fs,
38000cm-1 laser pulses under the magic angle polarization condition. These data suggest that the rate of vibrational cooling may be insensitive to temperature for a
wide variety of hydrogen bonding solutes and solvents. ... 266 Figure A2.3. Φ
(
ωmn;TBath)
is computed at (a) Λ−1=0.1ps, (b) Λ−1=1.0ps, (c) Λ−1=10ps. with the parameters are given in Table 2 of the main paper. Φ
(
ωmn;TBath)
isplotted on a logarithmic scale (base 10) in all three panels. ... 266 Figure A2.4. η ω
(
mn;TVET)
is computed at (a) Λ−1=0.1ps, (b) Λ−1=1.0ps, (c) Λ−1=10ps with the parameters given in Table 2 of the main paper. These calculations predict that our TG experiments should find a significant enhancement in the rate of vibrational cooling (at 300K versus 100K) provided that: (i) the time scale of the solvent, Λ−1
, is much greater 0.1ps; (ii) the VC induced increase in the temperature of the bath, TVET, is less than 300K. These same calculations are plotted on a
common linear scale in Figure 5.7. ... 267 Figure A3.1. (a) Linear absorbance spectra of thymine (black), thymidine (red), and the thymidine dinucleotide (blue) in an 85:15 mixture of methanol:water. (b)
Transient absorption anisotropies of the three systems measured with 25fs laser pulses centered at 265nm. These measurements suggest that the ππ* excitations of the thymidine dinucleotide are localized to the individual units. ... 274 Figure A3.2. Anisotropy computed using Equations (S1)-(S3). This calculation
shows that the anisotropies shown in Figure A4.3 can be understood in terms of a simple four-level model with ground state bleach and excited state absorption nonlinearities. Exciton delocalization and energy transfer is ruled out in the dinucleotide because they would lead to additional terms in the optical response
function. ... 276 Figure A3.3. TG signals (black) and fits (red) obtained for 9-methyladenine (top
row) and adenosine (bottom row). Temperatures are shown above the respective
panels. ... 277 Figure A3.4. TRF signals obtained for (a) 9-methyladenine and (b) adenosine at
300K. ... 278 Figure A3.5. Summary of time constants obtained at 300K for 9-methyladenine and adenosine. This figure is analogous to Figure 6.4, which presents data for the
xxvii
xxviii
List of Abbreviations and Symbols a,b Electronic/Vibrational energy levels
I Intensity
Γ Linewidth L Length
θ Angle
m,n Electronic/vibrational energy levels C(t,t’) Correlation function
∆ Amplitude of fluctuation relaxation
Ʌ Rate of fluctuation relaxation
Ʌ-1 Timescale of fluctuation relxation g(t) Line broadening function
C(ω) Spectral density Ea Energy level of state a
T Pump probe delay, population time in Four Wave Mixing experiment
τ Coherence time, time delay between Pulse 1 and 2 in Four Wave Mixing t Time, time between proble pulse and signal emission in Four Wave Mixing
χ Molecular susceptibility
ω Frequency
xxix E Electric Field
S Optical response of system k Rate of physical process ps Picosecond
fs Femtosecond
cm-1 Wavenumber, a measure of frequency K Kelvin
λ Wavelength, reorganization energy nm Nanometer
µm Micrometer CaF2 Calcium fluoride
FS Fused silica TG Transient grating
TRF Time resolved flourescense 2D Two dimensional
A Adenine
T Thymine
CHD Cyclohexadiene
xxx 7HA 7-methyl adenine
9HA 9-methyl adenine UV Ultraviolet UD Underdamped OD Overdamped
GSB Ground State Bleach ESE Excited state emission ESA Excited state absorption LO Local oscillator
SHG Second harmonic generation OPA Optical parametric amplifier
NOPA Nonlinear optical parametric amplifier FWM Four wave mixing
Ti:S Titanium doped sapphire crystal
BBO Beta Barium Borate nonlinear optical crystal GDD Group Delay Dispersion
GVD Group Velocity Dispersion
Chapter 1 . Introduction
1.1. Science at the Interface between Optical and Chemical Physics
Recent decades have seen tremendous growth in interdisciplinary research. Scientists with backgrounds in physics, chemistry, mathematics, biology, computer science, and medicine have begun to collaborate with common goals and research interests. The resulting cross-pollination of ideas has paved the way for many technological advances. Technology such as magnetic resonance imaging (MRI) resulted from the efforts of physicians, mathematicians, and physicists and mapping the human genome applied traditional chemistry techniques with basic biochemistry to advance scientific understanding. The fields of biophysics, materials science, and nanotechnology are examples of emerging interdisciplinary research areas, which require expertise from more than one traditional field. In a similar spirit, this dissertation forges new connections between the disciplines of optical physics and physical chemistry. Optical techniques pioneered in the field of attosecond laser science are merged with experimental techniques largely developed by physical chemists to investigate molecular relaxation processes initiated by deep UV laser light with unprecedented time resolution.
2
dissertation were first developed as optical analogues of NMR experiments (e.g., spin echo).2-5 2D spectroscopies can be thought of as a special case of a pump-probe experiment in which the waveforms associated with light absorption and emission are both resolved. 2D spectroscopy differs from a traditional (1D) pump-probe measurement where only the emission waveform is detected. As in NMR, the 2D representation exposes correlations between excitation and detection frequencies, thereby eliminating ambiguities of traditional 1D techniques. Detailed discussions of 2D spectroscopy can be found in Section 1.3 and 2.6.
3
Concomitant to this push toward the X-ray regime is an effort to observe and understand the fastest quantum dynamics in molecular systems. The understanding of sub-picosecond molecular relaxation mechanisms has progressed hand-in-hand with the development of shorter laser pulses. Research, most published within the last year, combining ultraviolet pump pulses (400nm, 266nm, and 200nm), photo-electron detection techniques, and theoretical models is transforming understanding of sub-100fs internal conversion transitions through conical intersections in gas phase cycloalkenes (i.e., textbook reactions in organic chemistry).18-26 Similar techniques are also being used to understand ultrafast relaxation in DNA nucleobases and their derivatives.27-29
The work presented in this dissertation has extended 2D spectroscopies to the deep UV and established several new insights into sub-picosecond molecular relaxation processes in condensed phases. The research presented here has been featured as 2011 Editors Choice in the Journal of Chemical Physics and led to an invited perspective article on the present state of 2DUV spectroscopy in the Journal of Physical Chemistry Letters.30,31 A second invited review for the journal Chemical Physics is in preparation.
The key contributions are summarized as follows:
• Optical analogues of NMR spectroscopies have been conducted in the deep UV spectral range (near 270nm) with unprecedented laser bandwidth and time resolution
4
• Transitions between excited electronic states that precede ring-opening reactions in cycloalkenes were resolved for the first time in solution.
• Femtosecond laser experiments were carried out in solution with unprecedented time-resolution at 200nm (i.e., the lower wavelength limit for aqueous solutions) using laser filamentation techniques developed by the attosecond physics community.
5
molecules of biological and chemical significance32, including DNA nucleobases where conical intersections provide photoprotection to the double helix.38
The systems to be discussed in this dissertation return to their electronic ground states at or near conical intersections (CIs).30 A CI occurs when adiabatic electronic states obtained under the Born-Oppenheimer approximation become degenerate at a particular nuclear geometry. Transitions between electronic states where a wavepacket moves towards, passes though, and moves away from a conical intersection can take place on the sub-100 fs time scale. Here motion refers to changes in the nuclear coordinates of a molecule as the wavepacket moves on the excited state potential energy surfaces. The passage through the conical intersections can itself be much more rapid, calculations predict that passage through a CI can take place in as little time as several femtoseconds.39 The time scale of relaxation through a conical intersection depends on the curvatures of the potential energy surfaces, which describe the dependence of energy on the nuclear geometry, and the non-adiabatic coupling between the different states. Ultrafast relaxation through CIs is promoted by divergence in the non-adiabatic coupling near the point of degeneracy.39
6
N>2) diatomic molecules are incapable of possessing them due to an insufficient number of nuclear coordinates and symmetry restrictions. Instead diatomic molecules possess avoided crossings. Figure 1 shows a polyatomic molecule guaranteed to have a CI by its large number of nuclear coordinates and the symmetry at its equilibrium (D4h)
geometry.32
Figure 1.1. (a) Simple diagrammatic representation of the model system, a 2D potential well. Lx and Ly are the lengths of the box in the x-dimension and y-dimension
respectively. is one angle between Lx and Ly. (b) Example of molecule where 2D
particle in a box model applies from Ref. 32. (c) A plot of the model system’s potential energy surfaces. The two surfaces form a conical intersection when 0 and 90°.
7
( )
( )
12 21 2 2 2 2 2 2 4 1 8 1 4 8 x y x y h m L Lh m L L
V V H θ θ + + = (1.1) where
( )
( )
212 21
2 V θ =V θ =Vθ−π
(1.2)
Note that the coupling is a function of the angle between the x and y sides of the well as depicted in Figure 1; the angle, , is the h coordinate. The difference in the segment lengths, Lx - Ly, tunes the energy gap between the states and thus, is the g
coordinate. The remaining coordinate, Lx + Ly, is referred to as a seam. It is intuitive that
when the angle is 90° and the sides of the box are equal, the two states are degenerate;
this is the nuclear geometry of the CI. The new Hamiltonian is diagonalized and eigenenergies of the coupled x/y system are produced. The eigenenergies of this model system are plotted in Figure 1c. The conical intersection forms at Lx=Ly and 90°, as
expected. Degeneracy is lifted as the system is displaced along the g and h coordinates as shown. This model system has been introduced to aid in understanding the basic concepts of a CI. Potential energy surfaces can intersect at specific nuclear geometries and the shape of these surfaces near degeneracy points partly governs the rate of relaxation through these CIs. Such phenomena drive the ultrafast relaxation processes studied in this work for which 2D spectroscopy is ideally suited to examine.
1.3. Ultrafast Optical Spectroscopies: Past, Present, and Future
8
resolution. However, femtosecond laser pulse generation was not possible in “turnkey”, tabletop laser amplifier systems until the 1990’s when solid state Ti:sapphire-based setups became commercially available40. These instruments utilized the advent of Kerr Lens mode locking techniques (KLML) to produce broad bandwidth laser pulses41 and chirped pulse amplification (CPA) techniques to amplify these pulses to the milli-joule through multi-joule levels42. Prior to 1990, femtosecond pulses could be produced using laser dyes as a gain medium, however tunability of femtosecond pulse spectra was limited by the optical properties of the corresponding laser dyes and this tunability necessitated time-consuming optimization.43
Coincident with these advances in laser technology was the discovery of nonlinear optical crystals such as β-barium borate (BBO) which possessed large nonlinear optical coefficients, broad transparency ranges, low group velocity dispersion, and high damage thresholds.44 Utilizing the optical parametric generation technique wherein a high frequency, high intensity ‘pump’ laser pulse amplifies a lower frequency, lower intensity ‘signal’ pulse in a nonlinear crystal; the narrow tuning range of the Ti:Sapphire lasers was overcome.45 Technology had advanced where researchers were able to generate femtosecond laser pulses across the visible and infrared spectral ranges opening up a variety of molecular systems and relaxation phenomena to experimental investigation.
9
monitors the change in absorption induced by the excited molecules. By comparing pump-on and pump-off regimes one can measure the dynamic absorption spectrum of the excited state. In TG and 2D, a four-beam geometry is used for experimentation; three beams induce a nonlinear signal and the fourth beam is used as a reference field for interferometric detection. This implementation offers several key advantages. Interferometric detection and background-free signal collection allow for high signal-to-noise ratios and low fluence.46,47 The non-collinear geometry also allows for polarization control of each beam which can be used to enhance or suppress certain signal components.
10
relaxation and transitions among all states. The time resolution in 2D spectroscopy is limited only by the absorption line-widths of the system’s resonances.
Figure 1.2. Transient grating and transient absorption spectroscopies can be wavelength resolved in the probe dimension (i.e. insensitive to pump wavelength). However, 2D spectroscopy is able to produce spectra which are resolved in both the pump and probe dimensions. This is the origin of the two-dimensional nature of the technique.
The most challenging issue facing implementation of 2D spectroscopies is obtaining interferometric precision on an order that allows for experimental results to accurately portray the physics probed, the necessary precision is ~λ/100. This requires timing errors of less than 0.17fs for a 5µm laser pulse and 0.017fs for a 500nm laser pulse, as well as a stable mechanical setup because fluctuations in optical path lengths can induce changes of 0.1fs over a 20 minute period.4 Because of this challenge, 2D spectroscopy developed most rapidly in the infrared spectral range6-8. Technical advancements then allowed researchers to extend the technique to visible wavelengths.9,10 Progress towards the UV is just beginning to be made and the work in this dissertation focuses on the development and application of UV-TG and -2D spectroscopy.
11
processes can cause the population to transfer between the two states. The probe pulse interrogates the system after a certain time and records where the population is. If the probe pulse indicates that excitations are present at state m, then 2D spectroscopy is able to discern their origin, whether it is from state m itself or has transferred from state n.
Figure 1.3. 2D spectroscopy is able to follow dynamics which involve molecular absorption at ωm(ωn), followed by probe pulse interaction at ωn(ωm). States m and n can
represent anything from vibrational resonances for different isomers of a particular molecule to pigment excitations in a photosynthetic complex (i.e. Frenkel exciton states). (a) Transitions (red and green arrows) such as energy transfer, isomerization, or protein folding that happens in the pump-probe delay will show up as cross peaks in (b) the 2D spectrum (red and green cross peaks).
12
dynamics of chemical exchange equilibrium, isomerization, and protein folding.
6,7,11,14,50-52
The implementation of 2D spectroscopy at visible wavelengths (2D-VIS) required experimental apparatus utilizing diffractive optics in order to achieve the necessary phase stability for interferometric detection and data collection.9,10 This technical advancement followed shortly after the implementation of 2D-IR and allowed new physics to be explored. One of the most compelling examples of 2D-VIS is in application to studying photosynthesis. In photosynthesis, light-driven reactions convert CO2 into biomass. The
most important step in this process is the capture and funneling of light to the reaction center where it is stored as electrical charge or chemical bonds.13,16 The absorption spectra of these light-capturing complexes possess strongly overlapping resonances due to the presence of multiple pigment types. This, coupled with strong intermolecular interactions and fast relaxation processes makes these systems a prime candidate for investigation with 2D-VIS.15
13
2D-VIS to disperse absorption information in the pumped frequency has yielded transformative insights in these naturally-inspired systems and many others.
In progressing ‘from NMR to X-rays’17 the next step is implementation of these femtosecond TG and 2D techniques in the UV. In a book chapter published in 2009 Ogilvie and Kubarych stated that “Although the visible frequency regime currently represents the high-frequency limit at which 2D spectroscopy has been experimentally realized, it is unlikely to remain that way for long”. 54 Implementation at 265nm is a natural next step because pulses with ample bandwidth and energy can more readily be produced at harmonics of Ti:Sapphire output (800nm). Obtaining the necessary intensity and bandwidth was achieved with non-collinear optical parametric amplification in the infrared and visible; however, similar techniques are not as effective in the UV due to properties of the non-linear medium used to generate the pulses. Alternative methods are necessary to produce UV laser pulses suitable for experimentation.
14
and IR, 2D-UV provides a sensitive measure of structure due to interactions of the UV-resonant, highly-localized, carbonyl transitions.
To date, only a small amount of 2D-UV work has been published57-61, however recent advances in optical physics that allow for generation of broad-band, high-intensity laser pulses tunable across the UV spectrum62 bode well for numerous future studies to be undertaken. Preliminary research focused on technical challenges such as interferometric phase stability, characterization of undesired nonlinearities which contribute to measured signals, and ensuring that broad bandwidth pulses at 265nm are suitable for experimental use.55 While these spectroscopies are reaching maturity in the UV researchers are also keeping an eye to future advancement.
fourth-15
generation synchrotron sources. Future work will combine the two methods to realize the full potential of attosecond X-ray science.17
Theoretical work has indicated that X-ray spectroscopies can be tuned to excite and probe specific atoms in molecules; this is due to the spread of binding energies (60-150eV) of 1s electrons in the atoms in the first row of the periodic table. Two-dimensional X-ray absorption spectroscopy (2D-XAS) can differentiate molecular species much like 2D measurements at longer wavelengths,67 as well as provide information on interatomic couplings complementary to X-ray absorption spectroscopy.17 Much like previous work, extending 2D spectroscopies into the UV and beyond to the X-ray regime will undoubtedly push technological limits, provide fundamental understanding of convoluted processes in molecular and atomic dynamics, and introduce new fundamental questions to be addressed by future research.
1.4. Excited State Deactivation in DNA Components
16
relaxation mechanisms which provide DNA is superior photostability. The lifetimes are so short that early literature even deemed the molecules as non-fluorescent.70 Studies of isolated bases are interesting; however, investigating how dynamics change as molecules are bonded to replicate the double helix provides further fundamental insight into DNA photoprotection.
Figure 1.4. Shown is the structure of purine molecules and pyrimidine molecules represented by Adenine (A) and Thymine (T), respectively. The purine molecules have an imizadole ring in addition to the pyrimidine ring.
17
half that observed for the isolated guanine and cytosine nucleobases (i.e. without Watson-Crick base pairing).71 This relaxation mechanism is proposed to be caused by a charge transfer state forming along the base pair which leads to a conical intersection back to the ground state.72
The other trait of the double helix is the stacking of nucleobases to form base strands. Two of these strands which are simultaneously base paired wrap around one another to form the double helix. The sequence of bases in the DNA strands is what encodes the genetic information that produces inter- and intra-special variation. This stacking however is also where photo damage can occur. The most common damage to DNA is the photo-induced reactions leading to a thymine-thymine (cyclobutane) dimer. This process can occur when thymine nucleobases are stacked adjacently along the strand. When a UV photon is absorbed by one of the adjacent thymine molecules photochemical reactions take place forming lesions within 1ps after absorption. However, it is agreed upon that the fast reaction rate and low quantum yield of this process indicate that there is a strong link between conformation prior to absorption and photodamage; only a small subset of possible conformations tends to lead to cyclobutane dimers. 73 Kohler et al. identified two major parameters that produce conformations leading to photodamage: the intermolecular distance and the torsion angle between adjacent thymine nucleobases. Certain configurations of these parameters lead to a dimerizable conformation where the lesion-forming photoreaction is likely to occur.74
18
molecules in the strand and suppress the ultrafast internal conversion process pivotal to DNA photoprotection. Base stacking rather than base pairing dominates the relaxation mechanisms in the double helix and produces long-lived states making DNA susceptible to photodamage.74 Most of the previous discussion has centered on nucleobases and monomolecular strands of base-stacked molecules. However; this homogenous case, while a good starting point for understanding dynamics, is never replicated in natural DNA systems. In light of this, researchers have also studied heteromolecular strands which contain realistic base stacking patterns and have found that a significant fraction of excitations undergo ultrafast IC dynamics that are virtually indistinguishable to the isolated nucleobase.75