Behavioral/Cognitive
The Segregation and Integration of Distinct Brain Networks
and Their Relationship to Cognition
Jessica R. Cohen
1and Mark D’Esposito
1,21Helen Wills Neuroscience Institute and2Department of Psychology, University of California, Berkeley, Berkeley, California 94720
A critical feature of the human brain that gives rise to complex cognition is its ability to reconfigure its network structure dynamically and
adaptively in response to the environment. Existing research probing task-related reconfiguration of brain network structure has
con-cluded that, although there are many similarities in network structure during an intrinsic, resting state and during the performance of a
variety of cognitive tasks, there are meaningful differences as well. In this study, we related intrinsic, resting state network organization
to reconfigured network organization during the performance of two tasks: a sequence tapping task, which is thought to probe motor
execution and likely engages a single brain network, and an n-back task, which is thought to probe working memory and likely requires
coordination across multiple networks. We implemented graph theoretical analyses using functional connectivity data from fMRI scans
to calculate whole-brain measures of network organization in healthy young adults. We focused on quantifying measures of network
segregation (modularity, system segregation, local efficiency, number of provincial hub nodes) and measures of network integration
(global efficiency, number of connector hub nodes). Using these measures, we found converging evidence that local, within-network
communication is critical for motor execution, whereas integrative, between-network communication is critical for working memory.
These results confirm that the human brain has the remarkable ability to reconfigure its large-scale organization dynamically in response
to current cognitive demands and that interpreting reconfiguration in terms of network segregation and integration may shed light on the
optimal network structures underlying successful cognition.
Key words:
functional connectivity; graph theory; individual differences; motor execution; resting state; working memory
Introduction
It is proposed that a dynamic, adaptable brain network
configu-ration in response to one’s environment underlies successful
cog-nition (
Dehaene et al., 1998
;
McIntosh, 1999
;
Bressler and Kelso,
2001
;
Fries, 2005
). Whole-brain intrinsic functional connectivity
patterns as measured during a resting state have been associated
with general intelligence (
van den Heuvel et al., 2009
;
Santarnec-chi et al., 2014
), working memory capacity (
Stevens et al., 2012
;
Alavash et al., 2015
), and other cognitive abilities (for a review,
see
Vaidya and Gordon, 2013
). However, to understand fully the
relationship between brain networks and cognition, it is
impor-tant to also investigate the patterns of functional connections
when individuals are confronted with a variety of cognitive
de-Received Aug. 5, 2015; revised Sept. 25, 2016; accepted Sept. 29, 2016.Author contributions: J.R.C. and M.D. designed research; J.R.C. performed research; J.R.C. analyzed data; J.R.C. and M.D. wrote the paper.
This work was supported by the National Institutes of Health (Grants F32NS079176 to J.R.C. and Grants NS79698 and NS40813 to M.D.).
The authors declare no competing financial interests.
J.R. Cohen’s present address: Department of Psychology and Neuroscience, University of North Carolina, Chapel Hill, NC 27599.
Correspondence should be addressed to Jessica R. Cohen, Department of Psychology and Neuroscience, Univer-sity of North Carolina, 335A Davie Hall, CB#3270, Chapel Hill, NC 27599. E-mail:[email protected].
DOI:10.1523/JNEUROSCI.2965-15.2016
Copyright © 2016 the authors 0270-6474/16/3612083-12$15.00/0
Significance Statement
mands (
Smith, 2012
;
Buckner et al., 2013
). One promising
ap-proach is to measure whole-brain functional connectivity in an
individual during the engagement of multiple cognitive tasks,
allowing for the quantification of changes in network structure
due to changing cognitive demands.
Several studies using this approach have found that while
there are many similarities in network structure during rest and
during the performance of different cognitive tasks (
Cole et al.,
2014
;
Krienen et al., 2014
), there are also meaningful task-specific
differences (
Cole et al., 2013
;
Krienen et al., 2014
;
Davison et al.,
2015
). The current study aimed to expand this work by relating
intrinsic network organization (as assessed during rest) to
recon-figured network organization during two tasks assumed to tap
different (and dissociable) brain modules or networks (
Dehaene
et al., 1998
;
Mesulam, 1998
): a sequence tapping task purported
to require motor execution and an n-back task purported to
re-quire working memory. While motor execution is a cognitive
function thought to be subserved by a single brain network,
working memory likely requires coordination across multiple
brain networks supporting many cognitive processes, such as
sus-tained attention and inhibition.
With the relatively recent application of network analysis tools
to functional brain imaging data, there is an emerging interest in
understanding how both the segregation and the integration of
brain networks underlie successful cognition (
Friston, 2009
;
Sporns, 2013
;
Deco et al., 2015
). For example, research probing
coactivation of regions across the entire brain during a variety of
cognitive tasks points to segregated networks that are
function-ally specialized (
Crossley et al., 2013
;
Bertolero et al., 2015
;
Yeo et
al., 2015
). It is additionally theorized that a highly interconnected
group of regions, the “rich club,” is critical for integration across
distinct networks (
van den Heuvel et al., 2012
). Further, patterns
of integration alter based on current cognitive demands, with
distinct profiles of cooperative and competitive connections
un-derlying different aspects of cognition (
Cocchi et al., 2013
).
Ex-tant literature makes it clear that it is critical to understand both
network segregation and network integration and how they relate
to different aspects of cognition. In this study, we probed network
reconfiguration when performing cognitive tasks that engage
either a single specialized brain network or the coordination of
multiple specialized networks. Our goal was to determine
whether interpreting network structure in terms of segregation
and integration could explain observed patterns of
reconfigura-tion. By applying whole-brain graph theoretical methods to
func-tional connectivity data acquired using fMRI, we tested the
hypothesis that motor execution would be associated with an
increase in local, within-network connectivity and a decrease in
global integration, whereas working memory would be associated
with a decrease in local, withnetwork connectivity and an
in-crease in global integration. Further, we hypothesized that
suc-cessful task-specific reconfiguration would be associated with
better task performance.
Materials and Methods
Participants
Thirty-five healthy young adult participants were recruited for this study (mean age⫽21.74 years, SD⫽2.73, 17 females). All participants were native English speakers, had normal or corrected-to-normal vision, and normal hearing. Participants were excluded for any history of neurolog-ical or psychiatric disorders, use of psychotropic drugs, a history of sub-stance abuse, or MRI contraindications. All participants provided written informed consent according to the procedures of the University of California, Berkeley (UC Berkeley) Committee for the Protection of Human Subjects.
Five participants were excluded for falling asleep during a resting scan as assessed by a camera focused on each participant’s right or left eye and by observing extended eye closures despite task instructions to maintain fixation with eyes open. Therefore, 30 participants were included in the analyses (mean age⫽22.07 years, SD⫽2.73, 13 females). In analyses involving the sequence tapping task (see below for task description), one additional participant was excluded (age⫽23 years, male) due to a computer malfunction that caused the task to terminate early.
Experimental design and procedure
Participants underwent 2 testing sessions⬃1 week apart (average dura-tion⫽7.47 d, SD⫽2.47, range⫽2–16). During each session, partici-pants received relevant training and were then administered a task flanked by two resting scans in the MRI scanner. The order of sessions was counterbalanced.
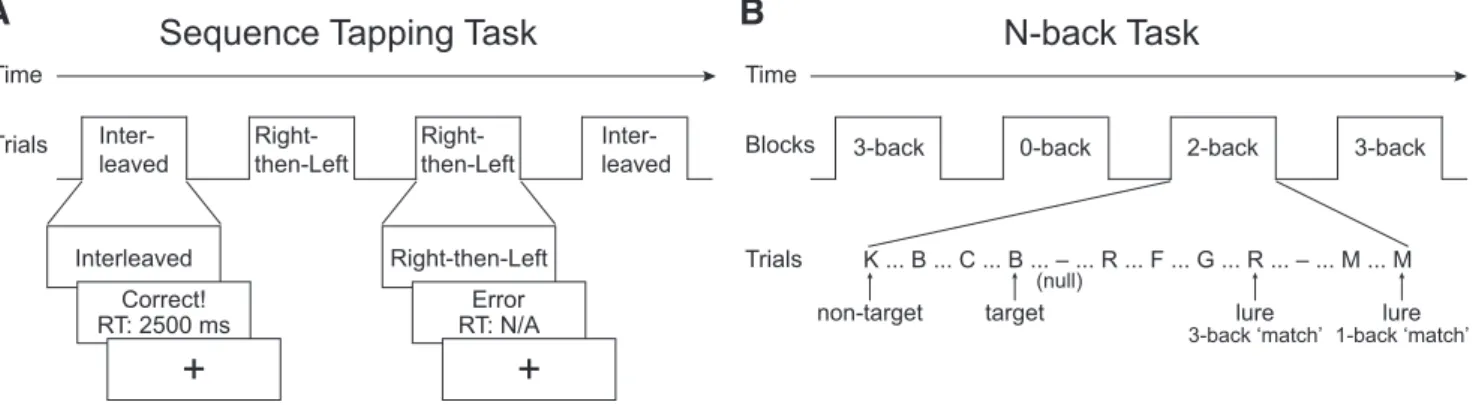
Sequence tapping task.During one of the testing sessions, participants performed a sequence tapping task in the scanner (Sun et al., 2004). Before the scan, participants were well trained on two sequences. The first sequence required a response of four button presses with fingers of the right hand followed by four button presses with fingers of the left hand, which we named “right-then-left.” When defining each key press by a letter (R⫽right, L⫽left) and a number (2⫽index finger, 3⫽middle finger, 4⫽ring finger, 5⫽pinkie finger), the sequence order was as follows: R3–R5–R2–R4 –L5–L2–L3–L4. The second sequence required interleaved bimanual responses in which participants alternated right and left button presses for a total of eight presses: R3–L5–R5–L2–R2–L3– R4 –L4. This sequence was named “interleaved,” and alternated the right-handed and left-right-handed sequences of the right-then-left condition. Each sequence was considered learned only after participants were able to execute the sequence with an accuracy of at least 80% and a mean re-sponse time to complete the eight button presses of⬍2500 ms. Training lasted on average 27 min, with a mean of 115 trials of the right-then-left sequence (always learned first) and 251 trials of the interleaved sequence (always learned second).
Each participant performed four runs of⬃7.5 min of the task, for a total of 48 right-then-left and 48 interleaved sequences (Fig. 1A). Each run began with a 10 s fixation (crosshair) followed by 12 right-then-left and 12 interleaved sequences randomly interspersed with the constraint that no condition occurred⬎3 times in a row. On each trial, a visual cue (“right-then-left” or “interleaved”) indicated to the participant which sequence to execute. Participants were instructed in advance to complete each sequence accurately over the course of⬃2 s (1 press per 250 ms). On average, participants completed each right-then-left sequence in 2336.5 ms and each interleaved sequence in 2486.8 ms. Participants re-ceived visual feedback regarding the accuracy and speed of their response immediately after the completion of each sequence or after 4500 ms if the sequence had not been completed. The feedback remained on the screen for 2000 ms. Intertrial interval length was randomly jittered so that total trial length (including cue, response, and feedback) was 16, 18, or 20 s. Each trial length occurred 8 times per run, randomly interspersed with the constraint that no one length occurred⬎3 times in a row. After the participant’s response and the feedback, participants fixated on a cross-hair in the center of the screen for the remainder of each trial.
N-back task.During the other testing session, participants received an n-back task in the scanner (Jacobs and D’Esposito, 2011), which con-sisted of four runs of ⬃11.5 min (Fig. 1B). Participants completed 3 loads of the task (0-, 2-, and 3-back) during which they were presented visually with a series of single consonants that appeared sequentially every 2 s. Using two buttons with the index and middle fingers of their right hand, participants indicated whether the current letter did not match (left button press) or matched (right button press) the letter seen
npreviously. A “target” was a letter that matched the letter seenn previ-ously. For example, in a 3-back condition, the second “R” in the sequence R–T–K–R–D was a target. A “lure” was a letter that matched a letter seen
whether a target letter (“X”) appeared. The 0-back blocks consisted of targets and nontargets; lure trials were not relevant in that condition.
There were 32 n-back blocks divided evenly over the 4 runs: 10 0-back, 11 2-back, and 11 3-back ordered pseudorandomly so that each run consisted of at least 1 block of each load and no load was presented more than twice sequentially. Each block consisted of 20 trials plus 5 randomly placed null events. The null events introduced temporal jitter to allow for event-related analyses. Each trial included the stimulus (an uppercase letter) presented for 1 s, followed by a 1 s delay (blank screen); null events consisted of a blank screen for 2 s. Each block began with a 6 s instruction period and a 10 s fixation period. Each block was followed by a 20 s fixation period. There were 20% targets, 15% lures, and 65% nontargets in the 2-back and 3-back conditions, for a total of 44 targets, 33 lures, and 143 nontargets per condition. There were 20% targets and 80% nontar-gets in the 0-back condition, for a total of 40 tarnontar-gets and 160 nontarnontar-gets. These proportions ensured that targets and lures were rare enough so as to not be expected, but often enough to be analyzed reliably.
Resting state.Before and after each task, participants received a single resting state scan (10 min). Participants were instructed to stay awake with their eyes open and to fixate on a white crosshair in the center of a gray screen. Only data from the two pre-task resting scans will be ana-lyzed here.
Although data exist indicating that functional connectivity during rest is influenced by a recent task, it has been found that by 12 min intrinsic connectivity returns to its pre-task baseline (Barnes et al., 2009;Tung et al., 2013). The average time between the termination of behavioral train-ing on the sequence tapptrain-ing task and the initiation of the resttrain-ing state scan during that session for all participants was 25.72 min (SD⫽7.06, range⫽17– 47). Comparing the pre-task resting scans of each session revealed that, whereas there was some variability across sessions, resting organization was not significantly different across the two sessions in the metrics and brain atlases examined here (all correctedp⬎0.98, false discovery rate [FDR] corrected for 12 comparisons; see below for de-scription of the metrics and brain atlases). This confirms that the pre-task resting state scans were not influenced by pre-scan training.
fMRI data acquisition
Imaging data were collected using a 12-channel head coil on a 3-tesla Siemens MAGNETOM Trio whole-body MR machine at the UC Berke-ley Henry H. Wheeler Jr. Brain Imaging Center. Whole-brain functional data were acquired using a T2*-weighted echoplanar imaging (EPI) pulse sequence (37 descending axial slices parallel to the AC–PC line, slice thickness 3.5 mm, interslice distance⫽0.7 mm, TR⫽2000 ms, TE⫽24 ms, FA⫽60°, matrix 64⫻64, field of view 224 mm). A total of 300 volumes were collected for each resting state run, 224 for each run of the sequence tapping task, and 345 for each run of the n-back task. A high-resolution T1-weighted structural 3D MP-RAGE was also acquired (160 slices, slice thickness 1 mm, TR⫽2300 ms, TE⫽2.98 ms, FA⫽9°, matrix 256⫻256, field of view 256 mm). An LCD projector back pro-jected visual stimuli onto a screen mounted to the RF coil. PsychoPy
software共http://www.psychopy.org兲was used to present stimuli and re-cord responses and latencies via a fiber-optic motor response rere-cording device for the sequence tapping task and E-Prime software (Psychology Software Tools) was used for the n-back task.
fMRI data processing
Functional image preprocessing was performed using AFNI (Cox, 1996, RRID:SCR_005927). Images were corrected for differences in motion and slice timing acquisition, the brain was extracted from the skull, and images were coregistered into each participant’s own high-resolution structural (MP-RAGE) space. The MP-RAGE was segmented using SPM8 (Wellcome Department of Cognitive Neurology, London, United Kingdom, RRID:SCR_007037) to create white matter and ventricle re-gions of interest (ROIs) from which average time-series were calculated as nuisance regressors. Functional images were then spatially smoothed with a 6 mm FWHM isotropic Gaussian kernel. Finally, the functional time-series were band-pass filtered (0.009 – 0.08 Hz) and signal from movement, white matter, and ventricles (as well as temporal derivatives) was regressed out simultaneously. This method has been shown to con-trol effectively time-series variability related to nuisance variables, in-cluding movement (Hallquist et al., 2013). In a second set of analyses, we added nuisance regressors corresponding to stimulus events for each task to remove potential effects of stimulus presentation that were not directly relevant to the cognitive processes of interest. Because the nuisance re-gression was different for rest and for the tasks, we only related the differences in network organization across sequence tapping and n-back tasks for this analysis. When comparing the differences across tasks ob-served using both sets of nuisance regressors (with and without stimulus events), our results did not change when including the extra task-related regressors: statistical comparison of thetstatistics of the two regression methods resulted in allp-values greater than 0.72 when FDR correcting for 12 comparisons. This result is not surprising because the sequence tapping and n-back tasks were designed to require sustained cognitive processes throughout task blocks, as opposed to transient processes that could have been affected by individual stimuli. Given the similarity in results across the two regression methods, we are only reporting our initial analyses without including task regressors (described in detail below).
Data from all relevant volumes were included in all analyses, given evidence that the simultaneous filtering/nuisance regression approach implemented here reduces correlations adequately between time-series fluctuations and motion (Hallquist et al., 2013). To rule out motion effects, we calculated average frame-wise displacement (FD) across each run (Power et al., 2012). We found that all participants had minimal motion (across all participants and all runs: mean⫽0.14 mm; max⫽ 0.34 mm; average percentage of volumes with⬎0.3 mm motion⫽ 4.67%). In addition, motion did not differ across tasks (F(2,84)⫽0.57,
p⫽0.57). There were also no significant relationships between FD and any of the brain or behavioral metrics of interest described below (allp⬎
0.39, FDR corrected for 50 comparisons).
A
B
Sequence Tapping Task
N-back Task
Time
Trials Inter-leaved
Right-then-Left
Right-then-Left
Inter-leaved
Right-then-Left
Error RT: N/A
+
Interleaved
Correct! RT: 2500 ms
+
Time
Blocks 3-back 0-back 2-back 3-back
Trials K ... B ... C ... B ... – ... R ... F ... G ... R ... – ... M ... M
non-target target (null)
lure 3-back ‘match’
lure 1-back ‘match’
Functional connectivity
To calculate functional connectivity between pairs of brain regions, we partitioned the brain into cortical ROIs using two different whole-brain atlases: the 96 cortical ROIs from the anatomical Harvard–Oxford atlas (Desikan et al., 2006) and the 264 cortical and subcortical ROIs from a commonly used functional brain atlas, the areal atlas fromPower et al. (2011). Throughout, we refer to the Harvard–Oxford atlas as the ana-tomical atlas and the Power atlas as the functional atlas. We conducted all analyses on each atlas separately to confirm that our results were not due to the idiosyncrasies of any single atlas. For each atlas, the fully processed time-series data were averaged within each ROI and then each ROI’s average time-series was correlated with the average time-series for all other ROIs, resulting in a 96⫻96 (anatomical atlas) or 264⫻264 (functional atlas) correlation matrix for each task (or rest) block of each participant. We constructed the correlation matrices identically for rest and for both tasks with the goal of relating overall functional connectivity during rest (intrinsic connectivity) to that during task performance (en-compassing both task-related and background connectivity). The corre-lation coefficients were standardized intoz-scores to allow for statistical conclusions to be made from the magnitudes of the correlations. Due to minor signal dropout in the inferior temporal and orbitofrontal cortex, data from six ROIs of the anatomical atlas and 18 ROIs of the functional atlas were not collected in all 30 included participants. Therefore, all analyses were conducted on a 90⫻90 (anatomical) or 246⫻246 (func-tional) Fisher-transformed connectivity matrix that included only ROIs with data from all participants.
For the resting state scans, each time-series included the entire run (600 s; 300 volumes). For the task scans, each time-series included only the relevant volumes for a given block. Each block time-series began 6 s (3 volumes) after the start of each block and ended 6 s (3 volumes) after the end of each block to account for the delay of the hemodynamic response. Although concatenating across nonadjacent volumes is typically done when probing time-series that are not contiguous in time (i.e., across task blocks within a scan or combining data across multiple scans), concate-nation ignores important temporal information that may be critical when measuring low-frequency neural oscillations. For example, if signal intensity changes from the last volume of one block to the first volume of the next, spurious correlations could be induced. Therefore, we chose to analyze our data in two different ways to ensure that any results were not due to the specific data combination procedure selected. First, we calcu-lated time-series correlations within each block individually and then averaged across all blocks to result in a single, average time-series for each condition. For this method, termed “block-wise connectivity,” each se-quence tapping task time-series was 14 s (7 volumes) and each n-back task time-series was 50 s (25 volumes). Sequence tapping time-series were separated into right-then-left and interleaved conditions (48 blocks each). N-back time-series were separated into 0-back, 2-back, and 3-back conditions (10 blocks of 0-back; 11 blocks each of 2-back and 3-back). Connectivity matrices of all blocks of a given condition were averaged together to stabilize connectivity values. Although the block length was quite different across tasks, the total number of volumes used to calculate each connectivity value was similar (300 volumes for resting blocks; 336 volumes for each sequence tapping condition; 275 volumes each for n-back 2-back and 3-back conditions). Second, we standardized each block (mean⫽0; SD⫽1) to minimize the possibility of spurious corre-lations being induced due to changes in signal intensity or variability across blocks and then concatenated across blocks. This method, termed “concatenated connectivity,” resulted in a single time-series for each condition, with 336 volumes for each sequence tapping condition and 275 volumes each for n-back 2-back and 3-back conditions. As before, there was a single block of 300 volumes for the resting state, since resting state blocks were continuous and thus did not require averaging or con-catenation. Results were nearly identical regardless of which method was used. Statistical comparison of the results of the two methods with paired
ttests resulted in allp-values greater than 0.99 when FDR correcting for 60 comparisons (one for each statistical test conducted). Given that there were no significant differences in results when comparing the two meth-ods, we only report results for the block-wise connectivity method.
Graph construction
To create graphs from the Fisher-transformed connectivity matrices of the anatomical and functional atlases, we used tools from the Brain Con-nectivity Toolbox (www.brain-connectivity-toolbox.net;Rubinov and Sporns, 2010, RRID:SCR_004841). First, we assigned each node to a network using the consensus clustering method (Lancichinetti and For-tunato, 2012). We used the Louvain community detection algorithm with weighted edges ( positive only) to produce an estimate of the opti-mal partitioning of nodes into networks (Rubinov and Sporns, 2011). We set the resolution parameter (␥), which determines the size of each network within the whole-brain graph, to 1.25 because this value pro-duced functional graphs with the same number of networks that were reported in the initial study describing the functional atlas (Power et al., 2011). To maintain analytical consistency across atlases, we used␥⫽ 1.25 for both the anatomical and functional atlases. Because the Louvain community detection algorithm is stochastic, we ran this algorithm 150 times and created a consensus matrix,D, from the 150 partitions, where each cell (Dij) indicates the proportion of partitions that particular pair of
nodes (i,j) were assigned to the same network. We thresholded each cell at 0.5. In other words, the agreement of all pairs of nodes that were not assigned to the same network at least 50% of the time was set to 0. The goal of this step was to remove the influence of noisy, and potentially spurious, node agreement. Last, we created a consensus partition from the agreement matrix,D, by running the Louvain algorithm 100 times to create 100 consensus partitions. This last step was repeated until a single representative partition was obtained. This method has been shown to produce more accurate partitions than other commonly used algorithms (Lancichinetti and Fortunato, 2012).
For each atlas, we created optimal network partitions separately for each condition of each task for each participant. We then constructed undirected, unweighted graphs using the Fisher-transformed correlation matrices described above. First, we thresholded each connectivity matrix to create an adjacency matrix of 1s (above threshold) and 0s (below threshold). Each of the ROIs was a node of the graph and each of the above-threshold connections was an edge. To be able to compare graphs most directly across conditions and participants, we equated the number of edges across all graphs (van Wijk et al., 2010;Garrison et al., 2015). We did this by thresholding each graph at a set cost, or percentage of total edges. Each analysis was conducted over a range of costs (10 –25% in 5% increments) to ensure that any results were not due to the chosen thresh-old. All graph metrics reported are the average value across all costs. The range of thresholds was chosen because it is within the range of values that produce graphs with small world characteristics (Bullmore and Bassett, 2011).
Graph theoretical metrics
To calculate all graph theoretical metrics, we used an in-house software toolbox developed at UC Berkeley that was programmed with Python (www.python.org, RRID:SCR_008394). The toolbox, Brainx 共https:// github.com/nipy/brainx兲, is based on the Networkx graph theory pack-age共https://networkx.github.io/兲. First, we calculated the modularity of the graphs using the adjacency matrices and the optimal network parti-tions of each graph as input. Modularity relates the number of within-network connections to all connections to quantify the strength of segregation into distinct networks. Higher values indicate stronger sep-aration of networks. Modularity (Q) is defined as follows:
Q⫽
冘
i⫽1m
共eii⫺ai2兲
whereeiiis the fraction of all edges that connect two nodes within module
i,aiis the fraction of edges that connect a node in moduleito any other
node, andmis the total number of modules.
strength of edges between all pairs of nodes that spanned two net-works (zb). System segregation was calculated to describe the relative strength of within-network connectivity compared to between-network connectivity as follows:
System Segregation⫽zw⫺zb
z w
In addition to network-based measures, we calculated average local efficiency and global efficiency across all nodes regardless of network membership (Latora and Marchiori, 2001;Achard and Bullmore, 2007). Both are calculated using the metric of minimum path length (L), which counts the smallest number of edges that must be crossed to get from nodeito nodej. The efficiency of each node, nodal efficiency (Enodal), is
calculated as the inverse of the harmonic mean ofLbetween nodeiand all other nodes as follows:
Enodal共i兲⫽
1 共N⫺1兲j
冘
僆G1 Li,j
whereNis the number of nodes in graphG, andLi,jis the minimum path length between nodesiandj.
Local efficiency (Elocal) is a measure of the efficiency of information
transfer limited to neighboring nodes (i.e., nodes with direct edges [L⫽
1] to the node of interest). Local efficiency is calculated as the average nodal efficiency among the neighboring nodes of nodei, excluding node
iitself, as follows:
Elocal⫽
1
NGi共NGi⫺1兲j,
冘
k僆Gi 1 Lj,kwhereNis the number of nodes in graphGi.Giis the subgraph of graph
Gthat includes all neighboring nodes ofi(excludingi).
Global efficiency (Eglobal) is a measure of the efficiency of information
transfer among all pairs of nodes in the graph, and is simply calculated as the average nodal efficiency of all nodes as follows:
Eglobal⫽
1
N共N⫺1兲i⫽
冘
j僆G 1 Li,jLast, we quantified two properties of individual nodes: participation coefficient, an index of internetwork connections, and within-module degree, an index of intranetwork connections (Guimera` and Amaral, 2005a,2005b). Participation coefficient (PC) is defined as follows:
PCi⫽1⫺
冘
s⫽1NM
冉
kis ki冊
2
wherekisis the degree (number of connections) of nodeito other nodes in its own network (s), andkiis the degree of nodeiregardless of network membership. By subtracting that ratio from 1, participation coefficient is a normalized measure of the connections that arenotwithin a node’s own network, or that are across networks.
Within-module degree (WD) is defined as follows:
WDi⫽ kis⫺ksi
ksi
wherekisis the degree of nodeito other nodes in its own network (s),ksi
is the average degree of all nodes ins(only including within-network connections), andksiis the SD of the degree of all nodes ins. Within-module degree, therefore, is a standardized (z-scored) metric of how connected a node is to all other nodes within its own network.
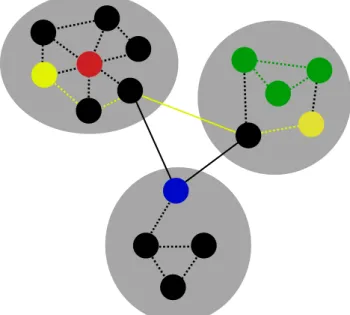
Participation coefficient and within-module degree can be used to define different types of nodes that are important for network communication. Here, we investigated how two of these types of nodes were related to specific cognitive demands: provincial hubs and connector hubs. We adapted the definitions of these two node types fromGuimera` and Amaral (2005a, 2005b). These investigators defined provincial hubs as nodes that are impor-tant for within-network, but not between-network, communication as as-sessed by high WD (ⱖ2.5) and low PC (ⱕ0.3). Due to the different types of
networks examined, their WD was higher than that observed in our partic-ipants; therefore, we defined provincial hubs as WDⱖ1.5 and PCⱕ0.3. Connector hubs were defined byGuimera` and Amaral (2005a,2005b) as nodes that are important for between-network, but not within-network, communication (WD⬍2.5, PC⬎0.62). Again, we adapted their defi-nition and defined connector hubs in our study as WD⬍1.5 and PC⬎0.8. The thresholds were chosen to ensure that all participants had at least one node above that threshold for at least one task. A schematic describing all metrics calculated is visualized inFigure 2.
For statistical comparisons between the resting and task scans, as well as between the two tasks, metrics for both active conditions of each task were averaged (right-then-left and interleaved conditions for the sequence tap-ping task and 2-back and 3-back conditions for the n-back task). We com-bined the two conditions of each task because the average metrics for each task condition were not significantly different from each other, with one expected exception: system segregation, which measures the relative strength of between-network and within-network connectivity, was significantly stronger during the right-then-left than during the interleaved condition of the sequence tapping task, for the functional atlas only (t(28)⫽3.33,
cor-rectedp⫽0.015). This was expected due to the increased interhemispheric integration anticipated during the interleaved condition (Sun et al., 2004; Grefkes et al., 2008). Importantly for the below analyses, investigating the two conditions separately did not change the results, so they are reported combined to remain consistent (all otherp-values⬎0.08, FDR corrected for 6 comparisons). Pairedttests were conducted to compare any two tasks within an individual (rest vs sequence tapping, rest vs n-back, sequence tapping vs n-back). For comparisons involving the sequence tapping task, in which one additional participant was excluded due to computer malfunc-tion (see “Participants” secmalfunc-tion), that participant was also removed from the comparison task to limit comparisons to the same participants for both tasks. For relationships with performance, behavior and brain metrics for only the most difficult condition were correlated using Pearson’s
correla-...
... ...
...
...
...
...
...
...
...
...
...
...
...
...
...
...
...
...
...
...
tions because brain– behavior relationships were not identical for the two task conditions. We fo-cused on the most difficult condition of each task to maximize the effort needed for successful per-formance, which we hypothesized would maxi-mize concentration on the task and therefore brain– behavior relationships. Because we did not have specific hypotheses regarding which graph metrics would be related to behavior, we related behavioral performance on the relevant task to all six graph theoretical metrics that we calculated during the interleaved condition of the sequence tapping task and the 3-back condition of the n-back task (modularity, system segrega-tion, local efficiency, global efficiency, number of provincial hubs, and number of connector hubs). Because of a computer malfunction, behavioral data were not collected for one participant during the n-back task, so that participant was excluded from the correlations with behavior, leaving 29 participants for those analyses.
In addition, a participant was excluded for an individual correlation analysis if that partic-ipant was an outlier for the relevant brain or behavior metric (as defined by being ⬎3 SDs from the mean); this resulted in a single participant being excluded from 2 of the 24 analyses: functional atlas n-back task global ef-ficiency and number of provincial hub nodes, leaving 28 participants for those two correla-tions with behavior. No other participants for any other analyses were outliers.
All analyses that compared rest to sequence tapping, rest to n-back, and sequence tapping to n-back using pairedttests were FDR cor-rected for three comparisons. The behavioral correlations were FDR corrected for six com-parisons for each task separately. Corrected
p-values are reported at a significance thresh-old of correctedp⫽0.05.
Results
Graph partitions
First, we defined participant-specific and
condition-specific brain networks during
rest and each of the tasks using consensus
clustering to define community structure.
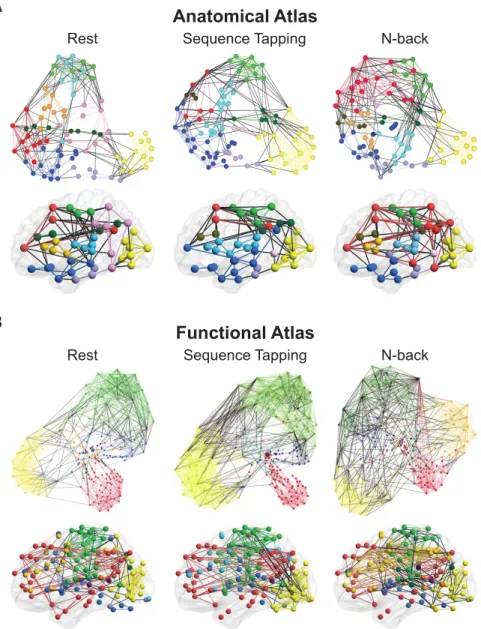
Qualitatively, we observed a greater
sepa-ration of distinct brain networks during
the sequence tapping task as compared to
both rest and the n-back task and an
in-crease in connections across networks
during the n-back task as compared to
both rest and the sequence tapping task.
This pattern was observed consistently
when examining network organization using both the
anatomi-cal and the functional atlases (
Fig. 3
). The following analyses will
address the potentially increased segregation during the sequence
tapping task and increased integration during the n-back task
quantitatively.
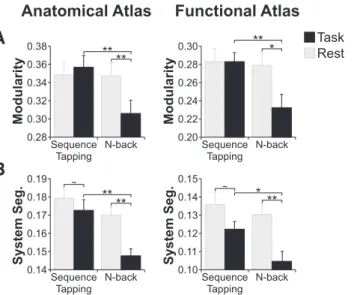
Modularity and system segregation
Modularity was significantly higher during the sequence tapping
task than during the n-back task (anatomical atlas:
t
(28)⫽
3.25,
corrected
p
⫽
0.005; functional atlas:
t
(28)⫽
3.32, corrected
p
⫽
0.008). Modularity during rest was equivalent to modularity
dur-ing the sequence tappdur-ing task and higher than modularity durdur-ing
the n-back task (anatomical atlas: rest vs sequence tapping
t
(28)⫽
0.04, corrected
p
⫽
0.70, and rest vs n-back
t
(29)⫽
3.17, corrected
p
⫽
0.005; functional atlas: rest vs sequence tapping
t
(28)⫽
0.06,
corrected
p
⫽
0.95, and rest vs n-back
t
(29)⫽
2.85, corrected
p
⫽
0.01;
Fig. 4A
).
We also assessed how the balance of within-network
connec-tions, which are likely responsible for local processing, and
between-network connections, which are likely responsible for
global, integrative processing, differed across tasks. First, we
mea-sured the connectivity strength of within-network connections
and between-network connections. We used a measure of system
segregation that quantifies the relative difference in strength of
A
B
Anatomical Atlas
Rest
Sequence Tapping
N-back
Rest
N-back
Functional Atlas
Sequence Tapping
within- versus between-network connections (larger positive
val-ues indicating stronger within-network connectivity compared
to between-network connectivity;
Chan et al., 2014
). We found
that system segregation was consistently higher during the
se-quence tapping task compared to the n-back task (anatomical
atlas:
t
(28)⫽
3.34, corrected
p
⫽
0.004; functional atlas:
t
(28)⫽
2.58, corrected
p
⫽
0.02). This difference in system segregation
across tasks was driven by a large numerical and significant
de-crease in system segregation between rest and the n-back task
(anatomical atlas:
t
(29)⫽
4.20, corrected
p
⫽
0.0007; functional
atlas:
t
(29)⫽
3.69, corrected
p
⫽
0.003), accompanied by a
smaller, numerical but nonsignificant trend toward a decrease in
system segregation between rest and the sequence tapping task
(anatomical atlas:
t
(28)⫽
1.82, corrected
p
⫽
0.08; functional
atlas:
t
(28)⫽
1.74, corrected
p
⫽
0.09;
Fig. 4B
).
Local and global efficiency
In addition to measuring the strength of connections within
de-fined networks, we measured the graph theoretical properties of
local and global efficiency, which are calculated independently
from network structure, to determine how these two distinct
types of information transfer may contribute differentially to
per-formance of the sequence tapping and n-back tasks.
We found that local efficiency, a measure of how
intercon-nected neighboring nodes are to each other, was consistently
higher during rest compared to both the sequence tapping and
n-back tasks (anatomical atlas: rest vs sequence tapping
t
(28)⫽
2.95, corrected
p
⫽
0.009, and rest vs n-back
t
(29)⫽
3.72,
cor-rected
p
⫽
0.003; functional atlas: rest vs sequence tapping
t
(28)⫽
2.01, corrected
p
⫽
0.08, and rest vs n-back
t
(29)⫽
3.09, corrected
p
⫽
0.01). Local efficiency was not significantly different across
tasks (both atlases corrected
p-
values
⬎
0.48;
Fig. 5A
).
Global efficiency, a measure of the interconnectedness of all
nodes globally across the entire brain, was significantly higher
during the n-back task compared to the sequence tapping task
(anatomical atlas:
t
(28)⫽
3.10, corrected
p
⫽
0.01; functional
atlas:
t
(28)⫽
3.15, corrected
p
⫽
0.006). Similar to the findings
when measuring system segregation, this result was driven by an
increase in global efficiency between rest and the n-back task
(anatomical atlas:
t
(29)⫽
2.51, corrected
p
⫽
0.03; functional
atlas:
t
(29)⫽
3.40, corrected
p
⫽
0.006), accompanied by a
smaller, numerical (but nonsignificant) decrease in global
effi-ciency between rest and the sequence tapping task (anatomical
atlas:
t
(28)⫽
1.72, corrected
p
⫽
0.097; functional atlas: (
t
(28)⫽
0.54, corrected
p
⫽
0.59;
Fig. 5B
).
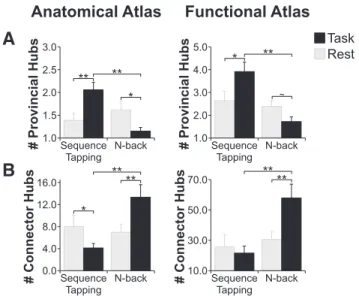
Nodal roles
Another important characteristic of large-scale brain
organiza-tion is how individual brain regions, or nodes, communicate with
the rest of the brain. Two types of nodes that can be distinguished
using graph theory are provincial hubs, which are important for
within-network communication, and connector hubs, which are
important for between-network integration (
Guimera` and
Ama-ral, 2005a
,
2005b
). We investigated whether the number of
pro-vincial and connector hubs changed from rest during each of the
tasks, as well as how they compared across the two tasks. We
found that the number of provincial hubs was higher during
sequence tapping than during the n-back task (anatomical atlas:
t
(28)⫽
4.57, corrected
p
⫽
0.0003; functional atlas:
t
(28)⫽
4.49,
corrected
p
⫽
0.0003), indicating that there were more highly
connected nodes within networks during the sequence tapping
task. This finding was driven by both an increase in number of
provincial hubs during sequence tapping compared to rest
(ana-tomical atlas:
t
(28)⫽
3.88, corrected
p
⫽
0.0009; functional atlas:
t
(28)⫽
2.47, corrected
p
⫽
0.03) and a decrease in number of
provincial hubs during the n-back task compared to rest
(ana-tomical atlas:
t
(29)⫽
2.22, corrected
p
⫽
0.03; functional atlas
strong but nonsignificant trend:
t
(29)⫽
1.96, corrected
p
⫽
0.06;
Fig. 6A
).
In contrast, we found that the number of connector hubs was
significantly higher during the n-back task than during the
se-quence tapping task (anatomical atlas:
t
(28)⫽
3.98, corrected
p
⫽
0.001; functional atlas:
t
(28)⫽
3.97, corrected
p
⫽
0.001). This
result was driven by a significant increase in number of connector
hubs during the n-back task compared to rest (anatomical atlas:
t
(29)⫽
3.60, corrected
p
⫽
0.002; functional atlas:
t
(29)⫽
3.17,
corrected
p
⫽
0.005). The number of connector hubs additionally
A
B
Anatomical Atlas
Functional Atlas
0.28 0.30 0.32 0.34 0.36 0.38
Modularity
Sequence Tapping
N-back
Task Rest
0.20 0.22 0.24 0.26 0.28 0.30
Modularity
Sequence Tapping
N-back
0.14 0.15 0.16 0.17 0.18 0.19
System Seg.
Sequence Tapping
N-back 0.10 0.11 0.12 0.13 0.14 0.15
System Seg.
Sequence Tapping
N-back
**
** ** *
** ~
** ~ *
**
Figure 4. A, Modularity was lower during the n-back task than during the sequence tapping task and during rest.B, Whole-brain system segregation was significantly higher during rest and during the sequence tapping task than during the n-back task. **p⬍0.01; *p⬍0.05; ⬃p⬍0.10.
A
B
Anatomical Atlas
Functional Atlas
0.75 0.76 0.77 0.78 0.79
Local Efficiency Sequence
Tapping N-back
Task Rest
0.71 0.72 0.73 0.74 0.75
Local Efficiency Sequence
Tapping N-back
0.50 0.51 0.52
Global Efficiency Sequence Tapping
N-back 0.54 0.55 0.56
Global Efficiency Sequence Tapping
N-back
**
**
** ~ *
** *
~ *
decreased between rest and sequence tapping, although not
con-sistently across the anatomical and functional atlases (anatomical
atlas:
t
(28)⫽
2.33, corrected
p
⫽
0.03; functional atlas:
t
(28)⫽
0.72, corrected
p
⫽
0.48;
Fig. 6B
).
Relationships between network organization and
behavioral performance
If one’s underlying network organization is critical to successful
cognition, then behavioral performance should be related to
brain organization. Therefore, we conducted exploratory
analy-ses relating each of the above graph metrics to behavioral
perfor-mance on each of the tasks. We focused on perforperfor-mance and
brain organization during the most difficult condition of each
task (interleaved sequence tapping trials and 3-back lure trials),
when cognitive effort was presumably maximized. All
partici-pants were highly trained on the sequence tapping task, so their
accuracy was quite high compared to n-back task accuracy (mean
interleaved condition accuracy
⫽
88.8%; mean 3-back lure
accu-racy
⫽
69.4%). Therefore, we correlated brain organization with
the SD of response times during the interleaved sequence tapping
trials, with lower response time variability indicating a better
command of the test sequences. For the n-back task, we
corre-lated accuracy on lure trials during the 3-back condition. We
focused specifically on lure trial accuracy during the n-back task
because these trials presumably required the most cognitive
con-trol. These are trials during which the current stimulus matched
the stimulus seen
n
⫾
1
previously. Therefore, they were
non-matches, but the letter was familiar in approximately the location
of a match (which would have been
n
previous), so the prepotent
inclination to respond “match” had to be suppressed on these
trials.
We report correlations between functional brain network
orga-nization and behavioral performance that were statistically
signifi-cant when using either one or both brain atlases. In all instances in
which a significant effect was found in only one atlas, the effect was in
the same direction when using the other atlas and the statistical effect
did not differ between the atlases (all
p-
values relating brain–
behav-ior correlation strength across atlases
⬎
0.05).
Sequence tapping task (interleaved condition)
Modularity, which did not change between rest and sequence
tapping, was positively correlated with response time variability
(anatomical atlas:
r
⫽
0.46, corrected
p
⫽
0.03; functional atlas:
r
⫽
0.30, corrected
p
⫽
0.40), indicating that higher modularity
was related to poorer—more variable—performance. Local
effi-ciency, which was the only measure of network segregation that
decreased between rest and sequence tapping, was also positively
correlated with response time variability (anatomical atlas:
r
⫽
0.48, corrected
p
⫽
0.03; functional atlas:
r
⫽
0.09, corrected
p
⫽
0.64), indicating that lower local efficiency was related to
improved—more stable—performance (
Fig. 7A
).
N-back task (3-back lure condition)
Modularity, which decreased between rest and the n-back task,
was negatively correlated with accuracy (anatomical atlas:
r
⫽
⫺
0.24, corrected
p
⫽
0.31; functional atlas:
r
⫽ ⫺
0.43, corrected
p
⫽
0.03). Local efficiency, which decreased between rest and the
n-back task, was also negatively correlated with accuracy
(ana-tomical atlas:
r
⫽ ⫺
0.49, corrected
p
⫽
0.02; functional atlas:
r
⫽ ⫺
0.56, corrected
p
⫽
0.01). Conversely, global efficiency,
which increased between rest and the n-back task, was positively
correlated with accuracy (anatomical atlas:
r
⫽
0.61, corrected
p
⫽
0.003; functional atlas:
r
⫽
0.49, corrected
p
⫽
0.02). Finally,
the number of connector hubs, which increased between rest and
the n-back task, was positively correlated with accuracy
(anatom-ical atlas:
r
⫽
0.33, corrected
p
⫽
0.16; functional atlas:
r
⫽
0.42,
corrected
p
⫽
0.03;
Fig. 7B
).
Discussion
This study related large-scale network organization during an
intrinsic, resting state to organization during a sequence tapping
task, which is thought to engage a single brain network
subserv-ing motor execution, and an n-back task, which is thought to
require the coordination of multiple brain networks subserving
cognitive processes required by working memory. Consistent
across multiple whole-brain atlases, several measures of network
segregation and integration, and several data analytic methods,
we found that local, within-network communication is critical
for motor execution, whereas integrative, between-network
communication is critical for working memory.
Extant literature emphasizes strong similarity in network
or-ganization across rest and multiple cognitive tasks:
⬃
60% of
con-nections do not change between rest and multiple cognitive tasks
(
Cole et al., 2014
;
Krienen et al., 2014
), whole-brain network
correspondence between rest and different tasks is quite high (
r
⬎
0.69 between each task pair;
Krienen et al., 2014
), and
connec-tions that change do so minimally (average absolute change in
r
⫽
0.04;
Cole et al., 2014
). Although there is general agreement
that observed network variations are related to differences in
task-specific brain network engagement (or differences between
rest and tasks), there is no unifying hypothesis regarding why
certain connections change during the performance of certain
tasks. In some studies, connections stemming from nodes within
a frontoparietal network purported to underlie cognitive control
are most variable (
Cole et al., 2013
;
Krienen et al., 2014
); in
oth-ers, connections involving those same nodes are highly consistent
(
Mennes et al., 2013
;
Davison et al., 2015
). These seemingly
con-tradictory findings highlight the importance of developing a
co-hesive framework within which to interpret results of network
studies. We demonstrate that a task engaging a single discrete
A
B
Anatomical Atlas
Functional Atlas
1.0 1.5 2.0 2.5 3.0
# Provincial Hubs Sequence Tapping
N-back
Task Rest
1.0 2.0 3.0 4.0 5.0
# Provincial Hubs Sequence Tapping
N-back
0.0 4.0 8.0 12.0 16.0
# Connector Hubs Sequence Tapping
N-back 10.0 50.0 70.0
# Connector Hubs Sequence Tapping
N-back 30.0
** * **
** **
*
*
~ **
** **
brain network (sequence tapping) results in increased
segrega-tion of brain networks, whereas a task requiring the engagement
of multiple brain networks (n-back) results in increased global
integration. This emphasizes the utility of interpreting
task-related differences in brain organization in terms of segregation
and integration.
Despite recognition that both segregation and integration of
brain networks are critical for cognitive function (
Friston, 2009
;
Sporns, 2013
;
Deco et al., 2015
), existing literature relating
net-work reconfiguration across tasks rarely interprets findings
within this dual segregation-integration framework (but see
Ber-tolero et al., 2015
;
Crossley et al., 2013
;
Yeo et al., 2015
). For
example, complex tasks result in increased long-range
connec-tions compared to rest (
Davison et al., 2015
), which is consistent
with our finding that n-back performance results in increased
long-range connections integrating across distinct networks
compared to performing sequence tapping or to rest. However,
that study did not assess segregation and integration across
dis-tinct functional networks, nor were the complex tasks related to a
simpler task thought to engage a single network. As another
ex-ample, whole-brain connectivity patterns during a semantic
n-back task are more different from connectivity patterns during
rest than are connectivity patterns of simpler tasks such as passive
observation or stimulus detection, which likely require fewer
dis-crete brain networks (or a single network;
Krienen et al., 2014
).
Although this finding is similar to ours in that n-back
perfor-mance resulted in greater changes to intrinsic network structure
than sequence tapping, differences across tasks were not
clas-sified in terms of within-network connections (segregation)
and between-network connections (integration).
Few studies have examined whole-brain organization during
motor tasks such as sequence tapping. Two recent motor learning
studies focused on the contrast between stable, task-relevant core
networks and flexible, peripheral networks (
Bassett et al., 2013
,
2015
). The segregation of two task-relevant networks, a
sensori-motor and a visual network, increased with training. Further, a
200400 600 800
SD RT (ms)
0.1 0.2 0.3 0.4 0.5 200 400 600 800
SD RT (ms)
0.1 0.2 0.3 0.4
200 400 600 800
SD RT (ms)
0.73
0.71 0.75
200 400 600 800
SD RT (ms)
0.75
0.71 0.79
A
Sequence Tapping
B
N-back
ANATOMICAL ATLAS FUNCTIONAL ATLAS
Modularity
ANATOMICAL ATLAS FUNCTIONAL ATLAS
45 65 75 95
Accuracy (%)
0.69 0.73 0.77 0.81 55
85 45 65 75 95
Accuracy (%)
0.1 0.2 0.3 0.4 0.5 55
85
45 65 75 95
Accuracy (%)
0.1 0.2 0.3 0.4 55
85
45 65 75 95
Accuracy (%)
0.72 0.74 0.76 55
85
45 65 75 95
Accuracy (%)
0.53 0.55 0.57 55
85
45 65 75 95
Accuracy (%)
0 60 120 180 55
85 45
65 75 95
Accuracy (%)
0.50 0.52 0.54 0.56 55
85
45 65 75 95
Accuracy (%)
0 20 30 50
55 85
10 40
Global
Efficiency
# Connector
Hubs
Local
Efficiency
r=.46, p=.03
r=.30, p=.40
r=.48, p=.03
r=.09, p=.64
r=-.24, p=.31
r=-.43, p=.03
r=-.49, p=.02
r=-.56, p=.01
r=.61, p=.003
r=.49, p=.02
r=.33, p=.16
r=.42, p=.03