From laboratory to road
A compArison of officiAl And ‘reAl-world’ fuel
consumption And co
2vAlues for cArs in europe
And the united stAtes
Authors:
Peter mock, John German, anup bandivadekar
(icct)
Iddo riemersma
(sidekick project support)
Norbert ligterink
(tno)
Udo lambrecht
(ifeu)
www.theicct.org [email protected]
the authors would like to thank all internal and external reviewers of this report for their guidance and constructive comments. furthermore, the authors would like to thank the following individuals and organizations for contributing data and background informa-tion for this analysis: maciej czarnecki (leaseplan deutschland), rick goeltz (ornl), david greene (ornl), christof gauss (AdAc), sascha grunder (tcs), chas hallett (whatcar?), dan harrison (honestjohn.co.uk), stefan hausberger (tu graz), mario Keller (infrAs), reinhard Kolke (AdAc), hartmut Kuhfeld (diw), uwe Kunert (diw), nick molden (emissions Analytics), lars mönch (uBA), gerd preuss (fiA), sonja schmidt (AdAc), travelcard nederlands.
for additional information: 1225 i street nw suite 900 washington dc 20005 +1 202 534 1600
[email protected] www.theicct.org
© 2013 international council on clean transportation
executive summAry
fuel consumption and carbon dioxide emission values for new cars in europe today are determined via the so-called type-approval process, which involves testing vehicles under laboratory conditions using the new european driving cycle (nedc). the type-approval
values are the basis for consumer information, co2 regulation, and co2-based vehicle
taxa-tion and therefore ought to provide a reliable and stable indicataxa-tion of fuel consumptaxa-tion and emission levels observed—on average—under ‘real-world’ conditions on the road. A technically precise definition of real-world driving conditions is elusive because of variations in vehicle design and in the ways that drivers drive. But by aggregating large sets of on-road driving data, clear trends can be observed. this analysis makes use of several such datasets, for both private and company cars, from various european countries. it reveals an overarching trend: while the average discrepancy between
type-approval and on-road co2 emissions was below 10 percent in 2001, by 2011 it had
increased to around 25 percent.
methods of collecting on-road co2 emissions differ from source to source, as do fleet characteristics and driving styles, and therefore the absolute discrepancies found vary from one data source to another as well. But more important than the absolute discrepancy is the increase over time, and the annual rate of increase is similar for all sources examined.
100% 105% 110% 115% 120% 125% 130% 135% 2000 2002 2004 2006 2008 2010 2012
‘real-world’ vs. manufacturers’ type-approval CO
2
emissions
Vehicle model year / Fleet composition year / Test year Spritmonitor.de (Germany) On-road, ~5,000/year
Travelcard (Netherlands) On-road, ~15,000/year LeasePlan (Germany) On-road, ~15,000/year
Honestjohn.co.uk (United Kingdom) On-road, ~3000/year
WhatCar? (United Kingdom) On-road, 174 vehicles TCS (Switzerland) On-road, ~20/year
100% means type-approval and ‘real-world’ emission levels are in line.
Values above 100% indicate a gap, with 'real-world' emissions being higher than according to type-approval.
divergence, real-world vs. manufacturers’ type-approval co2 emissions for various
on-road data sources.1
1 for spritmonitor.de, travelcard, and honestjohn.co.uk data are shown by vehicle model year. for tcs and WhatCar? data are shown by the year in which vehicles were tested. for leaseplan the vehicle fleet average for a given year is shown. A detailed description of differences in the datasets is given in the following chapters.
it is reasonable to assume that driving behavior has not changed appreciably over the past ten years. instead, the observed increase of the gap is most likely due to a combination of these developments:
»
increasing application of technologies that show a higher benefit in type-approvaltests than under real-world driving conditions (for example, start-stop technology)
»
increasing use of ‘flexibilities’ (permitted variances) in the type-approval procedure(for example, during coast-down testing)
»
external factors changing over time (for example, increased use of air conditioning)the underlying data show that the increase in the gap was especially pronounced after
2007–2008, when a number of european union member states switched to a co2-based
vehicle taxation system and a mandatory eu co2 regulation for new cars was introduced.
it is important to clarify that nothing in this analysis suggests that manufacturers have done anything illegal. however, the nedc was not originally designed to measure
fuel consumption or co2 emissions, and some features of the test procedure can be
exploited to influence test results for those values. manufacturers appear to be taking
advantage of permitted tolerances in the nedc, resulting in unrealistically low co2
emission levels. results from tests that closely resemble type-approval testing, appear to confirm this. in such tests, run using vehicles provided directly by manufacturers and in laboratory settings that are in line with those customary for type approval, the discrepancies between laboratory and real-world results tend to be much smaller and do not show any sign of a marked increase over time. however, these type-approval like laboratory tests do not take into account a number of conditions and behaviors typically found in on-road driving.
the public policy implications of this study are significant. the growing gap between reported efficiencies and actual driving experience cuts in half the expected benefits
of europe’s passenger vehicle co2 regulations. it creates a risk that consumers will lose
faith in type-approval fuel consumption values, which in turn may undermine govern-ment efforts to encourage the purchase of fuel-efficient vehicles through labeling and
tax policy. for tax authorities, the gap between type-approval and real-world co2
values translates into a gap between actual and potential revenues from vehicle taxes.
finally, increasing discrepancies between type-approval and on-road co2 emissions
can result in a competitive disadvantage for some vehicle manufacturers since it tilts the playing field.
efforts are being made to address this situation. the united nations is developing a new vehicle test procedure, the worldwide harmonized light vehicles test procedure (wltp), which is close to being finalized, as well as a separate test procedure for vehicle air
conditioning systems, the mobile Air-conditioning test procedure (mActp). the wltp will feature a more representative driving cycle, more precise road-load testing (to measure rolling and aerodynamic resistance), as well as an improved test procedure generally. exist-ing tolerances and flexibilities will be reduced, and more realistic co2 emission test results are expected. each of these new test provisions ought to be adopted in the eu as quickly as possible. they will help toward reducing the gap between type-approval and on-road
co2 emission levels. nevertheless, it should be acknowledged that the new test procedure
will not resolve all the open issues, and may itself have vulnerabilities that are not yet recognized. to contend with these eventualities, the european commission is investigating the use of additional correction methods at the eu level.
in-service conformity checks for co2, similar to those that already exist for air pollutant emissions, should be introduced into eu legislation, to ensure compliance of the on-road
question of whether there are better ways to determine co2 emission levels of vehicles than making use of a fixed driving cycle and test procedure. portable emissions mea-surement systems (pems) could offer a plausible alternative, and that possibility should be actively investigated.
in the final assessment, eu regulation of vehicle co2 emissions should discourage
investment in technologies that do not perform well under real-world conditions, should minimize the exploitation of flexibilities in testing procedures, and should spur innova-tions that will lead to co2 reductions in reality as well as in the laboratory. reversing the
trend of increasing discrepancies between type-approval and on-road co2 emissions,
1 tAble of contents
executive Summary ... i 1 table of Contents ... v 2 Abbreviations ... vi 3 introduction ...1 4 Data Analysis ... 34.1 on-road driving data (europe) ... 3
4.1.1 spritmonitor.de (germany) ... 3
4.1.2 travelcard (netherlands) ...13
4.1.3 leaseplan (germany) ...21
4.1.4 honestjohn.co.uk (united Kingdom) ...28
4.1.5 whatcar? (united Kingdom) ...32
4.1.6 tcs (switzerland) ...34
4.2 laboratory test data (europe) ...35
4.2.1 AdAc ecotest (germany) ...35
4.2.2 Quechoisir (france) ... 40
4.3 comparison of european data sources ... 40
4.3.1 Average values over time ... 40
4.3.2 By vehicle segment...47
4.3.3 By manufacturer / brand ... 50
4.4 on-road driving data (united states) ...52
4.4.1 doe/epA “my mpg” (united states) ...52
5 policy context ...56
5.1 current type-approval testing ...56
5.1.1 purpose and concept of type-approval testing ...56
5.1.2 potential reasons for an increasing gap ...58
5.1.3 consequences of an increasing gap ... 60
5.2 development of a new test protocol ...62
5.2.1 issues addressed by wltp ...63
5.2.2 issues not addressed by wltp...67
5.2.3 outlook ...69
6 Conclusions and recommendations ...70
7 references ...73
2 AbbreviAtions
a Year
AdAc Allgemeiner deutscher Automobil-club
At Automatic transmission
Bev Battery electric vehicle
cd charge depleting
cs charge sustaining
co2 carbon dioxide
doe u.s. department of energy
ec european commission
eeA european environment Agency
epA environmental protection Agency
eu european union
g/km grams per kilometer
ghg greenhouse gas
gm general motors
hev hybrid electric vehicle
icct international council on clean transportation
ifeu institut für energie- und umweltforschung heidelberg
km/h Kilometers per hour
mActp mobile air conditioning test procedure
mpg miles per gallon
mph miles per hour
mt manual transmission
nedc new european driving cycle
nox nitrogen oxide
pems portable emissions measurement system
rn renault-nissan
soc state of charge
tcs touring club schweiz
tno netherlands organisation for Applied scientific research
u.K. united Kingdom
un united nations
unece united nations economic commission for europe
u.s. united states
vw volkswagen
wltc worldwide harmonized light vehicles test cycle
3 introduction
in order to limit the negative effects of climate change and to reduce dependence on oil imports, the european union (eu) needs to reduce its greenhouse gas (ghg) emissions to 80–95 percent below 1990 levels by 2050. A reduction of at least 60 percent by 2050 with respect to 1990 (70 percent with respect to 2008) is required from the transport sector, the only sector in which ghg emissions have increased since 2005 (up 30 percent, compared with a 7 percent decline for all sectors) (ec 2011a, 2011b). for passenger cars, accounting for two-thirds of the ghg emissions from the eu’s transport sector, a voluntary commitment by the automotive industry to reduce the level of emissions for new vehicles was reached in 1998–99. however, the annual rate of reduction between 1998 and 2006, as measured by the new european driving cycle (nedc), ranged only between 0.6 percent and 2.2 percent, and the target of 140 grams
of carbon dioxide (co2) emitted per kilometer traveled (g/km) for 2008 was missed (ec
2010). in 2007, a decision was taken to introduce mandatory regulatory measures, and in
early 2009, the first mandatory co2 performance standards for passenger cars in the eu
were adopted, setting a target of 130 g/km for 2015 and 95 g/km for 2020 (eu 2009). in the course of applying mandatory standards, the annual rate of reduction of the average
level of co2 emissions from new passenger cars has accelerated from 1.6 percent in
2007 to about 4 percent in the past few years (mock 2012a). the (preliminary) european
average co2 emission level in 2012 was 132.2 g/km, compared to 158.7 g/km in 2007
(eeA 2013).
in july 2012, the european commission put forward a regulatory proposal confirming the
2020 co2 target of 95 g/km for new passenger cars (ec 2012). this proposal is currently
being discussed in the european parliament and european council, and it is expected that it will be adopted later in 2013.
it is important to understand that the performance standards set by the eu only affect the type-approval value for individual vehicles. the term “type approval” refers to laboratory measurements of emission values according to a clearly defined test cycle and test procedure (currently, in the eu, the nedc is used for this purpose) in a reproducible way to certify that manufacturers are in compliance. in order to achieve
real co2 emission reductions, it is of great importance to ensure that reductions in the
level of co2 emissions registered in the laboratory during the type-approval test are
also realized under “real-world” driving conditions. the term “real-world” (or, similarly, “on-road”) refers here to the practical experience of car owners in their everyday driving. it is acknowledged that every driver has a distinct way of driving, and hence a technically clear definition of real-world driving is elusive. still, as will be discussed in more detail later, in aggregating a large amount of driving data, clear trends can be observed and analyzed.
in 2012, the international council on clean transportation (icct) carried out the first attempt to quantify more precisely the historical divergence of type-approval versus
real-world co2 values of light-duty vehicles (mock et al. 2012). At that time, 28,000 user
entries from the vehicle database spritmonitor.de were analyzed. the database collects real-world driving fuel consumption data in germany for most vehicle models available and allows consumers to compare their own figures with those of other users. the fuel
consumption information can be converted into co2 emissions numbers, and these data
were then compared to the type-approval data provided for each vehicle. it was found that there was a discrepancy between the two values and that this discrepancy had increased from about 8 percent in 2001 to 21 percent in 2010, with a particularly pro-nounced increase since 2007. in addition, laboratory data for 1,200 vehicle models tested by europe’s largest automobile club, germany’s Allgemeiner deutscher Automobil-club
(AdAc), were analyzed for the same time period, helping to pinpoint the underlying reasons for the variance found in the analysis.
co2 emissions and fuel consumption are directly linked.2 therefore, the trend found in
the 2012 analysis has implications not only for the reduction of co2 emission levels in
the atmosphere but also, from a consumer’s perspective, for the fuel consumption of their vehicles. most drivers are aware that there is a gap between the fuel consumption rates they experience during everyday driving and the corresponding values that they obtain from their local car dealer, the internet, or other media sources. As this gap widens, an ever percentage of the advertised fuel consumption reductions does not result in actual cost savings for consumers. this could lead to a situation whereby consumers lose faith in the official type-approval values provided by the vehicle manufacturers, sapping the public’s willingness to invest into new vehicle technologies
to cut fuel consumption and co2 emissions. this concern has been highlighted recently
by an open letter by three eu consumer organizations asking the european commis-sion to act accordingly (mock 2012b).
the main objective of this report is to carry out additional analyses with updated and supplemental data in order to see whether they confirm the pattern of growing
discrep-ancies between type-approval and real-world co2 values found by icct researchers in
2012. for this, the icct, in collaboration with the netherlands organisation for Applied scientific research (tno) and the institute for energy and environmental research heidelberg (ifeu), collected and analyzed various datasets, including those from car magazines and leasing company driving data.
the report is divided into two parts. in the first, a number of different data sources are
analyzed in detail, focusing on real-world vs. type-approval co2 emission values for
vari-ous vehicle fleets, in some instances also differentiated by vehicle segment and manu-facturers/brands. the second part aims to put the findings into a larger policy context. the united nations is currently developing a worldwide harmonized test procedure for light-duty vehicles, the so-called wltp. how the wltp might affect the discrepancies will be discussed, as well as the implications of persistent gaps between laboratory results and on-road experience from the perspectives of customers, manufacturers, and society as a whole.
4 dAtA AnAlysis
this chapter discusses various sources of the co2 emission levels of light-duty vehicles.
section 4.1 focuses on on-road driving data for europe, that is, data gathered while driving on normal roads under real-world driving conditions. section 4.2 looks at data generated in vehicle laboratories under various test conditions. in each case, wherever possible, both current and historical data are analyzed to identify trends over time. section 4.3 compares the various european data sources to each other. section 4.4 evaluates data from the united states, which is presented to illustrate differences in vehicles, driving, and testing in the two different regions.
4.1 On-rOAD Driving DAtA (eurOpe)
4.1.1 Spritmonitor.de (Germany)
Data type On-road
Data availability 2001–11, approx. 5,000 entries per year
Data collection fuel-consumption data, entered by vehicle drivers into publicly available online database Fleet structure,
driving behavior mostly private cars, urban and extra-urban driving, no details on driving style known
description
spritmonitor.de3 is an online database with more than 250,000 registered users that
provides on-road fuel consumption figures for cars in germany. Anyone can register for free, choose a vehicle model and exact configuration, and then enter the fuel consumption data that one observes in daily driving. the reported values are freely accessible to everyone, for each vehicle individually or aggregated to compile average fuel consumption for a specific vehicle model configuration. in contrast to some other websites, spritmonitor.de does not ask users to estimate the fuel consumption rate directly but instead asks them to enter the amount of fuel purchased (in liters) and the odometer reading after each refueling stop. the resulting specific fuel consumption is then calculated automatically.
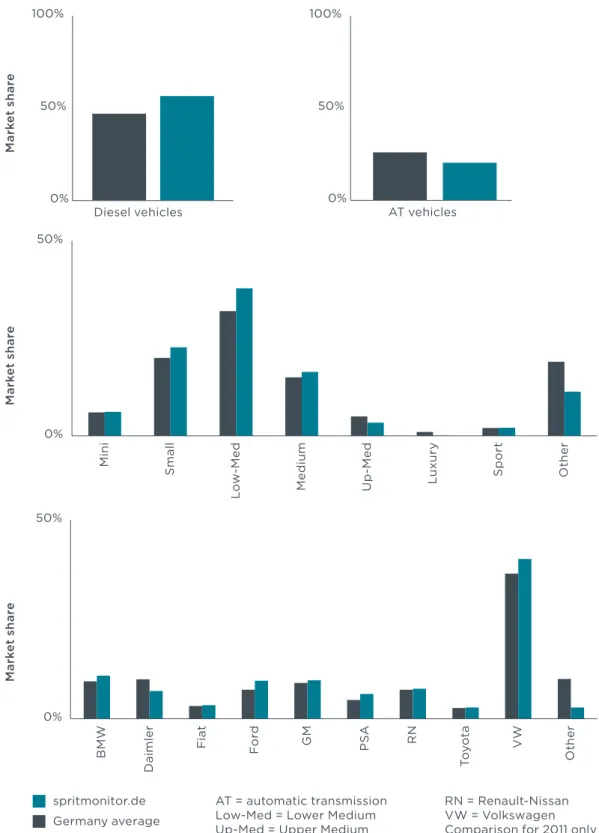
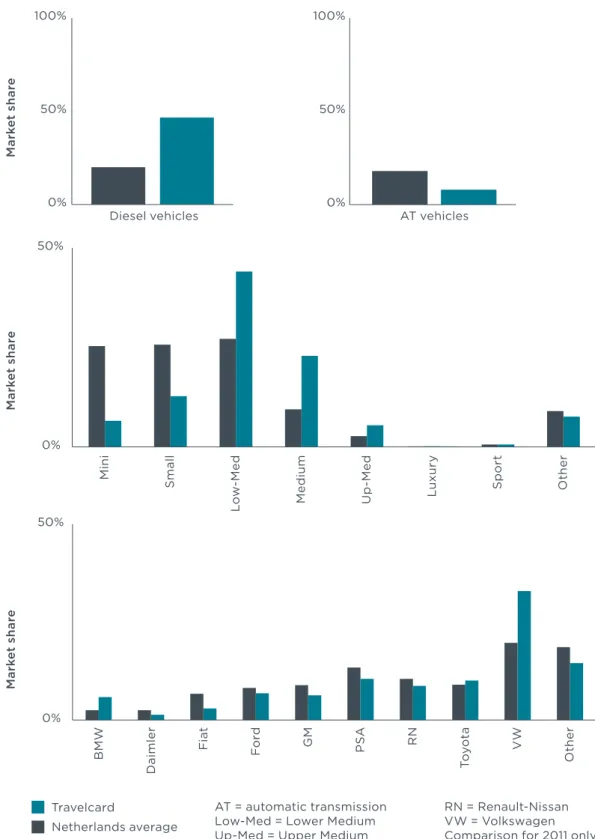
for this study, all entries for the years 2001–11 were analyzed for the following manufac-turers/brands: Bmw (Bmw, mini), daimler (mercedes-Benz, smart), fiat, ford, general motors (opel), psA (peugeot, citroën), renault-nissan (renault, nissan), toyota, volk-swagen (Audi, seat, skoda, vw), volvo. collectively, the vehicle models covered account for about 75 percent of annual sales in germany. each vehicle model is differentiated by type of fuel, transmission, engine power, and model year. in total, more than 69,000 user entries were analyzed. it was found that the spritmonitor.de data provides a good representation of the german car market (see figure 1). the respective market share of diesel and automatic transmission vehicles is similar to that of the overall german market. similarly, the distribution by segment and manufacturer is in line with the actual
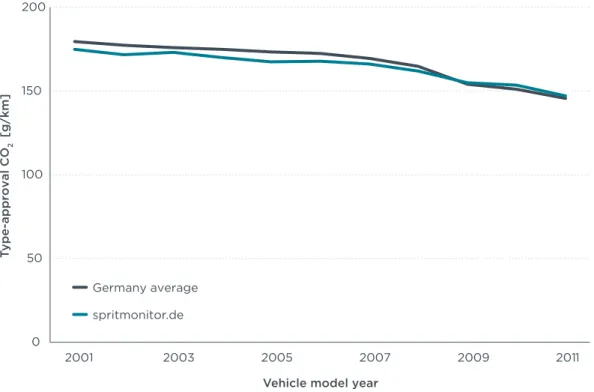
market characteristics. the average (type-approval) co2 emission level of the
spritmoni-tor.de fleet was 145 g/km in 2011, very close to the 146 g/km reported for the entire german new car fleet in 2011 (figure 2).
0% 50% 100% Diesel vehicles 0% 50% 100% AT vehicles Total number of vehicles with spritmonitor.de data evaluated: 69,005
AT = automatic transmission Low-Med = Lower Medium Up-Med = Upper Medium
RN = Renault-Nissan VW = Volkswagen Comparison for 2011 only Germany average 0% 50% BM W Daimler Fiat Ford GM PSA RN To yo ta VW Ot he r Ma rk et shar e spritmonitor.de 0% 50% Mini Smal l Low-Me d Me dium Up-Med Luxu ry Spor t Ot he r Ma rk et shar eM ar ke t shar e
Figure 1. characteristics of the spritmonitor.de data analyzed in comparison with the
0 50 100 150 200 2001 2003 2005 2007 2009 2011 Ty pe-approval CO 2 [g/km]
Vehicle model year
Germany average spritmonitor.de
Figure 2. co2 type-approval data for spritmonitor.de fleet and german new car market.
methodologY
to aggregate the detailed data from spritmonitor.de, for every vehicle variant the average fuel consumption was determined and divided by the respective type-approval number to obtain a relative value. the relative differences were then weighted according to the respective german market sales numbers for the vehicle variant in a given year. in contrast to the type-approval data, fuel consumption rates reported by spritmonitor. de are not based on laboratory measurements and are not subject to any process of standardization; rather, they reflect how drivers experience fuel consumption in practice. for the analysis, the values obtained from spritmonitor.de are therefore considered to be
a good representation of real-world co2 values. A breakdown of the spritmonitor.de data
in terms of driving situations (for example urban, extra-urban, highway) is not feasible within the scope of this analysis.
considering that those consumers reporting their experiences to spritmonitor.de are likely to pay more attention to the fuel efficiency of their vehicles and to drive in a more fuel-conserving manner than others, one might posit that the difference between
real-world co2 and type-approval values is actually higher than what is suggested by
the spritmonitor.de analysis. the gap between type-approval and spritmonitor.de fuel consumption rates may thus be viewed as a conservative estimate. others might argue that spritmonitor.de users are especially frustrated with their cars consuming more fuel than expected and that this is their main reason for submitting data to the system. in any case, even if there is a bias (no matter in which direction) in the data reported to spritmonitor.de with respect to average in-use fuel consumption, that bias should be consistent over time and should not affect the observed trends in the relationship between the spritmonitor.de data and the type-approval data.
results
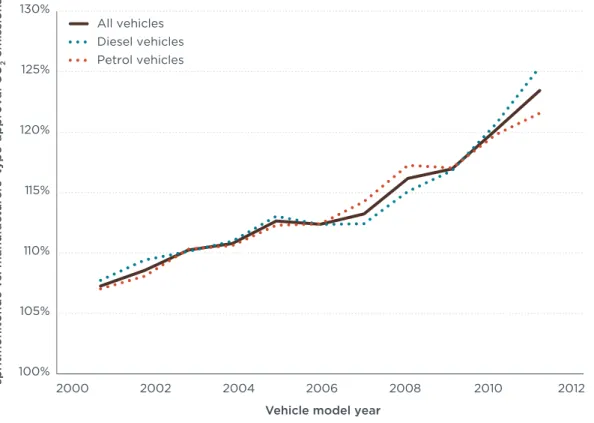
As can be seen from figure 3, the average discrepancy between fuel consumption (and,
by extension, co2 emission) values reported in spritmonitor.de and manufacturers’
type-approval values increased from 7 percent in 2001 to 13 percent in 2007 and then jumped to 23 percent by 2011. this trend confirms the findings of the previous icct analysis (mock et al. 2012) mentioned in the introduction, now adding a data point for the year 2011 and including more data entries for 2001–10. A significant difference in results between petrol and diesel vehicles cannot be determined based on the overall data for all years. however, just looking at the years 2007 to 2011, the widening in the discrepancy appears to be less pronounced for petrol than for diesel vehicles (figure 3).
100% 105% 110% 115% 120% 125% 130% 2000 2002 2004 2006 2008 2010 2012 spritmonitor
.de vs. manufacturers’ type-approval CO
2
emissions
Vehicle model year
All vehicles Diesel vehicles Petrol vehicles
Figure 3. divergence, spritmonitor.de vs. manufacturers’ type-approval co2 emissions
figure 4 shows the same analysis by transmission type. According to the data, a greater disparity is observable for vehicles equipped with automatic transmission since 2007, with such vehicles now having a divergence of 26 percent, compared with 22 percent for manual transmission vehicles.
100% 105% 110% 115% 120% 125% 130% 2000 2002 2004 2006 2008 2010 2012 spritmonitor
.de vs. manufacturers’ type-approval CO
2
emissions
Vehicle model year
All vehicles
Automatic transmission vehicles Manual transmission vehicles
Figure 4. divergence, spritmonitor.de vs. manufacturers’ type-approval co2 emissions by
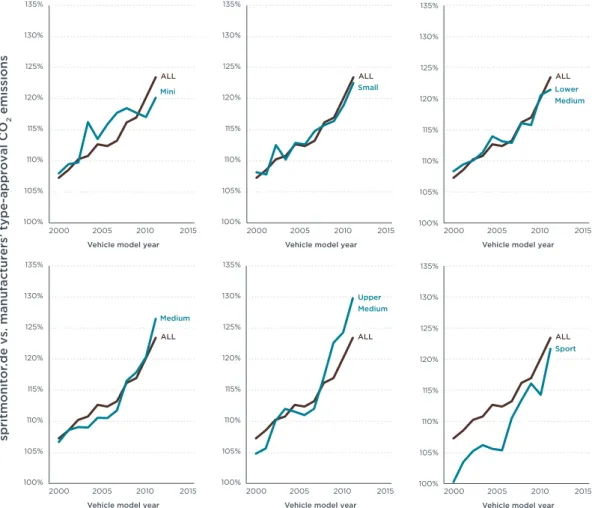
An analysis by vehicle class (figure 5) reveals hardly any differences among them. most of the vehicle segments mirror closely the overall market trend. only the divergence for vehicles in the upper-medium-size and sports car category seems to have grown slightly more than for other vehicle segments.
100% 105% 110% 115% 120% 125% 130% 135% 2000 2005 2010 2015 spritmonitor
.de vs. manufacturers’ type-approval CO
2
emissions
Vehicle model year Mini ALL 100% 105% 110% 115% 120% 125% 130% 135% 2000 2005 2010 2015
Vehicle model year Small ALL 100% 105% 110% 115% 120% 125% 130% 135% 2000 2005 2010 2015
Vehicle model year Lower Medium ALL 100% 105% 110% 115% 120% 125% 130% 135% Medium ALL 2000 2005 2010 2015
Vehicle model year
100% 105% 110% 115% 120% 125% 130% 135% Upper Medium ALL 2000 2005 2010 2015
Vehicle model year
100% 105% 110% 115% 120% 125% 130% 135% Sport ALL 2000 2005 2010 2015
Vehicle model year
Figure 5. divergence, spritmonitor.de vs. manufacturers’ type-approval co2 emissions by
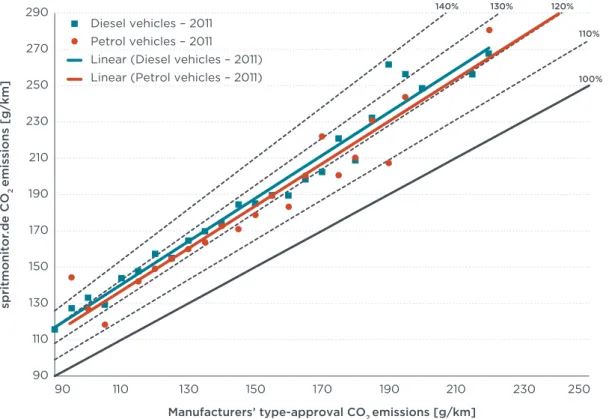
to illustrate the differences between low- and high-co2-emitting vehicles, in terms of their divergence from the official rates, figure 6 shows the 2011 data for petrol and diesel cars at 5 g/km co2 emission intervals.5 looking at the linear regression lines, it can
be seen that the spritmonitor.de data for 2011 petrol vehicles ranges between 120 and 125 percent of the type-approval numbers and for diesel vehicles between 125 and 130
percent. hence, there is little variation between low- and high-co2-emitting cars. this is
particularly true in focusing on the absolute co2 emission levels instead of percentage
differences. the absolute difference between type-approval and real-world emissions is
about constant over a large co2 range, according to the spritmonitor.de dataset.6
90 110 130 150 170 190 210 230 250 270 290 90 110 130 150 170 190 210 230 250 spritmonitor .de CO 2 emissions [g/km]
Manufacturers’ type-approval CO2 emissions [g/km] Diesel vehicles – 2011
Petrol vehicles – 2011
Linear (Diesel vehicles – 2011)
Linear (Petrol vehicles – 2011) 100%
140% 130% 120%
110%
Figure 6. correlation deviation, spritmonitor.de vs. manufacturers’ type-approval co2
emissions by co2 emission category.
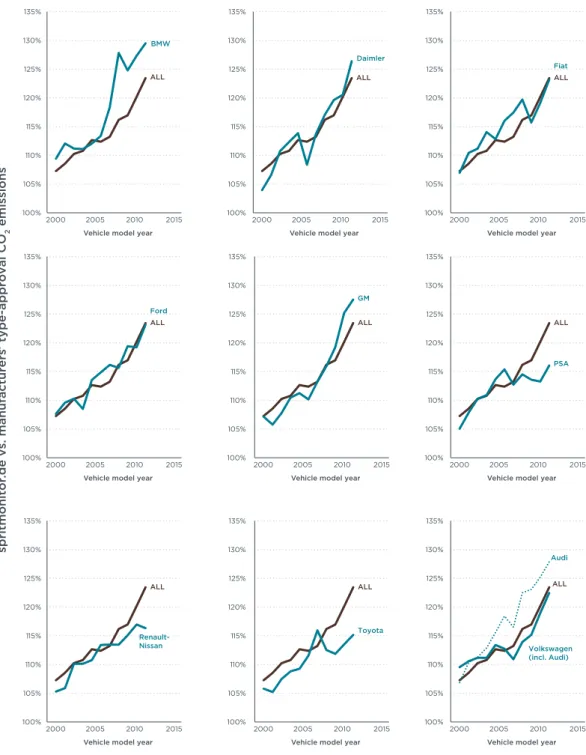
the spritmonitor.de data is detailed enough to allow for a meaningful analysis of individual brands and manufacturers. According to the data, while most manufacturers follow the overall trend line, there are some differences between them that can be seen in figure 7. it is important to note that for a comparison between manufacturers, differ-ences in framework conditions need to be taken into account.
for example, as will be discussed in further detail in chapter 5.1.1, differences in driving behavior and vehicle use can explain part of the absolute level of discrepancy between
type-approval and real-world co2 emissions. therefore, a direct comparison of vehicles
that are mostly driven at high speeds on the highway with other vehicles that are driven more on urban roads or on highways but typically with lower speeds does not allow for any meaningful conclusions. this is of course true as well for the respective manufacturers of these vehicles. more useful is a comparison of manufacturers with a similar customer base, such as, for example, Audi, Bmw, and daimler. on the other hand,
5 for the spritmonitor.de data, a conversion factor of 2.43 kg co2 per liter of petrol and 2.65 kg per liter of diesel fuel
was used.
6 note that the figure does not include any information on the number of vehicles for each data point. for a vehicle number weighted analysis, please see the previous figure examining specific vehicle segments.
differences in driving styles and vehicle use cannot explain the observed increase in the level of discrepancy, as again will be discussed in the following chapter.
for a more detailed discussion of the challenges in comparing manufacturers’ data, please see section 4.3.3.
100% 105% 110% 115% 120% 125% 130% 135% 2000 2005 2010 2015 spritmonitor
.de vs. manufacturers’ type-approval CO
2
emissions Vehicle model year
BMW ALL 100% 105% 110% 115% 120% 125% 130% 135% 2000 2005 2010 2015
Vehicle model year Daimler ALL 100% 105% 110% 115% 120% 125% 130% 135% 2000 2005 2010 2015
Vehicle model year
ALL Fiat 100% 105% 110% 115% 120% 125% 130% 135% 2000 2005 2010 2015
Vehicle model year
ALL Ford 100% 105% 110% 115% 120% 125% 130% 135% 2000 2005 2010 2015
Vehicle model year
ALL GM 100% 105% 110% 115% 120% 125% 130% 135% 2000 2005 2010 2015
Vehicle model year
ALL PSA 100% 105% 110% 115% 120% 125% 130% 135% 2000 2005 2010 2015
Vehicle model year
ALL Renault-Nissan 100% 105% 110% 115% 120% 125% 130% 135% 2000 2005 2010 2015
Vehicle model year
ALL Toyota 100% 105% 110% 115% 120% 125% 130% 135% 2000 2005 2010 2015
Vehicle model year Volkswagen (incl. Audi)
ALL
Audi
Figure 7. divergence, spritmonitor.de vs. manufacturers’ type-approval co2 emissions by
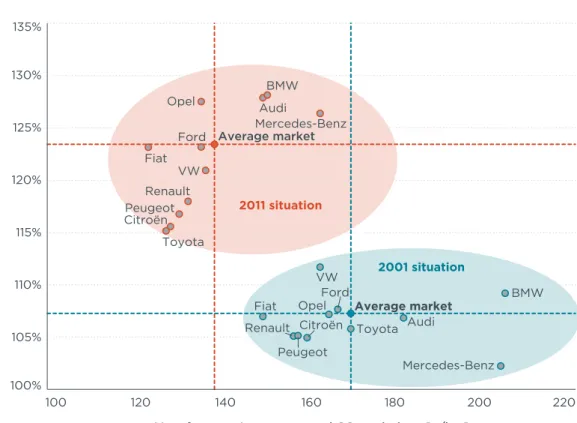
figure 8 compares the 2001 situation to 2011 for selected manufacturers and brands.
whereas in 2001 the average co2 emission level8 for new cars in the eu was 168 g/km,
and the discrepancy according to spritmonitor.de data was 7 percent, the corresponding
figures were 138 g/km and 23 percent in 2011.9 that is, while in every instance the co
2
emission level has decreased over the past ten years according to the data examined,
the gap for each manufacturer has also widened, resulting in smaller real-world co2
reductions than one would expect at first sight.
Audi Audi BMW BMW Citroën Citroën Fiat Fiat Ford Ford Mercedes-Benz Mercedes-Benz Opel Opel Peugeot Peugeot Renault Renault Toyota Toyota Average market Average market VW VW 100% 105% 110% 115% 120% 125% 130% 135% 100 120 140 160 180 200 220
spritmonitor.de vs. manufacturers’ type-approval CO
2
emissions [g/km]
Manufacturers’ type-approval CO2 emissions [g/km]
2011 situation
2001 situation
Figure 8. 2001 and 2011 co2 emission level and spritmonitor.de vs. type-approval
discrepancy on average and for selected brands/manufacturers.
8 co2 data from mock (2012c). values may be different from those given in other reference materials for reasons
provided in the source.
9 the official co2 emission value for 2011 was 136 g/km (eeA 2011). for reasons explained in mock (2012c), the value used here differs slightly from this level.
figure 9 illustrates the effect of these disparities on measurements of absolute co2 reductions achieved in germany for new cars over the past ten years. According to
type-approval data, the average co2 emission level decreased from 180 g/km in 2001
to 146 g/km in 2011, a 19 percent drop. According to spritmonitor.de data, though, the real-world emission level in 2001 was around 193 g/km (about 13 g/km higher than the type-approval level). over the years, the gap widened to 34 g/km in 2011, which is
equivalent to about 1.4 liters of fuel10 per 100 km. According to the spritmonitor.de data,
the real-world co2 emission reduction from 2001 to 2011 therefore was only about 7
percent instead of 19 percent. Also, the spritmonitor.de data register notable differences in deviations between manufacturers. while for some the gap amounted to only 22 g/ km (Min. manufacturer), for others it was as high as 43 g/km (Max. manufacturer) in 2011. this represents almost a 0.9 liter/100 km difference in fuel consumption between manufacturers at the extremes.
180 177 176 175 173 173 170 165 154 151 146 193 193 194 194 195 194 192 191 180 182 180 0 50 100 150 200 250 2000 2002 2004 2006 2008 2010 2012 CO 2 emissions [g/km]
Vehicle model year
Germany type-approval data spritmonitor.de on-road data
spritmonitor Min. manufacturer spritmonitor Max. manufacturer
34 g/km ≈ 1.4 l/100km
Figure 9. Average co2 emissions of new cars in germany according to type-approval
4.1.2 travelcard (Netherlands)
Data type On-roadData availability 2004–11, approx. 15,000 entries per year
Data collection fuel consumption data, automatically recorded using a tank card when refueling at gas station Fleet structure,
driving behavior company cars, urban and extra-urban driving; fuel is usually paid for by the employer
description
travelcard11 is a fuel card system introduced in the netherlands that can be used at
any gas station in the netherlands and at more than 33,000 fuel stops across europe. travelcard is part of leaseplan corporation n.v. About 200,000 vehicles, out of the 8 million total in the netherlands, regularly fill up with petrol or diesel using travelcard. typically, the fuel is paid for by the employer since many employees in the netherlands have a company car as part of their job benefits.
for this study, detailed fuel consumption data for more than 260,000 travelcard vehicles for the years 2004–11 were analyzed by tno. in total, about 20 million individual filling events—after a thorough quality check—were used for the analysis. the following brand/ manufacturer classification was applied: Bmw (Bmw), daimler (mercedes-Benz), fiat (Alfa-romeo, fiat), ford, general motors (opel), psA (peugeot, citroën), renault, toyota, volkswagen (Audi, seat, skoda, vw). even though not separately analyzed, other brands (such as mini, smart, nissan, lexus) are included in the calculations for overall average fleet values.
Among the distinct characteristics of the travelcard dataset (see figure 10), about 50 percent of the vehicles are powered by diesel fuel. this is about twice as much as for the dutch vehicle fleet taken as whole. given that—taking into account dutch vehicle taxes and fuel prices, a diesel-operated vehicle is more economical above an annual mileage of about 20,000 km—diesel vehicles are very popular among business users. this is precisely the case for the travelcard fleet, consisting mostly of company cars that have a higher annual mileage than average private vehicles. Automatic transmission is not common among travelcard drivers; only about 8 percent of their vehicles make use of this technology, as opposed to about 18 percent on average in the netherlands. therefore, the amount of data on such vehicles is limited, and a separate analysis for automatic transmission vehicles was not carried out. At the manufacturers/brands level, Bmw and volkswagen are overrepresented in the travelcard dataset compared with the dutch fleet overall, while daimler and fiat are underrepresented. small and mini models
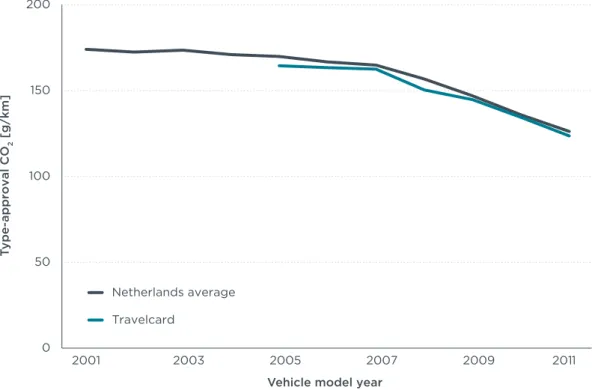
are also underrepresented in the travelcard fleet. the average co2 emission value for
model-year 2010 vehicles in the travelcard dataset was 135 g/km, slightly lower than the average for new passenger cars in the netherlands in that same year (137 g/km), despite the underrepresentation of small cars, owing to the larger share of diesel vehicles in the select group (figure 11).
AT = automatic transmission Low-Med = Lower Medium Up-Med = Upper Medium
RN = Renault-Nissan VW = Volkswagen Comparison for 2011 only
Ma rk et shar e Ma rk et shar e Ma rk et shar e 0% 50% Mini Smal l Low-Me d Me dium Up-Med Luxu ry Spor t Ot her 0% 50% 100% Diesel vehicles 0% 50% 100% AT vehicles Total number of vehicles with Travelcard data evaluated: 261,792
0% 50% BM W Daimler Fiat Ford GM PS A RN To yo ta VW Ot he r Travelcard Netherlands average
Figure 10. characteristics of the travelcard data analyzed in comparison with the dutch
0 50 100 150 200 2001 2003 2005 2007 2009 2011 Type-approval CO 2 [g/km]
Vehicle model year
Netherlands average Travelcard
Figure 11. co2 type-approval data for travelcard vehicle fleet and the dutch new car market.
methodologY
the travelcard data include manufacturers’ type-approval fuel consumption figures for
every vehicle12 as well as the real-world fuel consumption rates determined by analyzing
pairs of consecutive fueling events, with proper mileage data recorded on each filling oc-casion for each vehicle. thus, the dataset can be analyzed without needing to reference other data sources. when aggregating individual vehicle data to fleet-wide averages, the travelcard vehicle count was used to weight the results.
As with the spritmonitor.de data, fuel consumption reported by travelcard is not based on laboratory measurements but reflects the in-use consumption experience of a large number of customers. the values are therefore considered a good representation of
real-world co2 emission values but keeping in mind that the fleet is almost entirely made
up of company cars.
since fuel expenses are usually paid by the employer, travelcard users are not likely to be much motivated by fuel conservation in their driving style. on the other hand, many motorways in the densely populated western part of the netherlands have speed limits of 100 km/h and 80 km/h and tend to be relatively congested. these conditions have to be taken into account when comparing travelcard to similar data from germany (for example, spritmonitor.de), where much higher speeds are common on the Autobahn. overall, the travelcard drivers are a more homogeneous group than the spritmonitor. de users, with their company obligations largely responsible for the substantial mileage
totals racked up.13 their fuel consumption may be pushed higher than average because
their driving style is unconstrained by fuel saving concerns, but this is counterbalanced by the typical characteristics of their vehicle usage: longer trip distances and limited urban driving.
12 the type-approval data given was additionally validated by tno using other sources.
13 typically, during the first four years of the lifetime of a vehicle—while being used as a company car—about half of the total lifetime mileage of the vehicle is accrued.
results
As can be seen in figure 12, the discrepancy between co2 emission values reported by
travelcard and manufacturers’ type-approval values increased from 11 percent in 2004 to 28 percent in 2011. for the years prior to 2004, no data are available. As in the case of spritmonitor.de, the increase seems to have accelerated markedly since 2007, when the gap stood at 14 percent. the difference between petrol and diesel vehicles is more evident than is true for the spritmonitor.de data, again with a swifter increase for diesel vehicles during the past several years.
100% 105% 110% 115% 120% 125% 130% 135% 2000 2002 2004 2006 2008 2010 2012
Travelcard vs. manufacturers’ type-approval CO
2
emissions
Vehicle model year
All vehicles Diesel vehicles Petrol vehicles
Figure 12. divergence, travelcard vs. manufacturers’ type-approval co2 emissions on
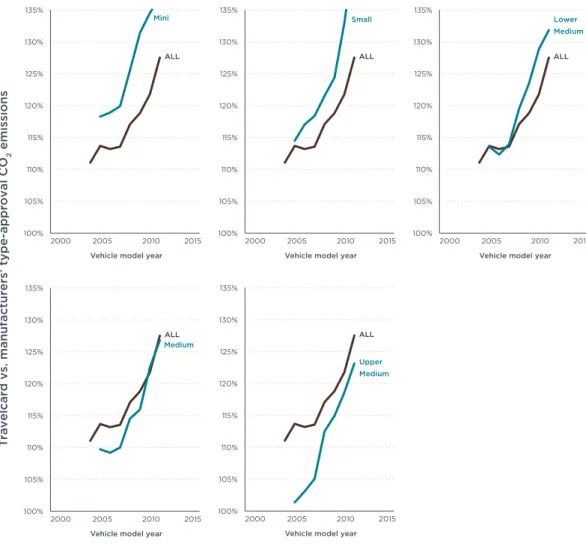
in analyzing the travelcard data by vehicle segment (figure 13), a larger discrepancy shows up for vehicles of the mini, small, and lower-medium-sized segments than for those of the medium and upper-medium-sized segments. Although the travelcard da-taset is biased toward larger cars, the number of smaller cars in the dada-taset is sufficient to generate significant results. what the figure does not depict is that the discrepancy is especially large for small diesel vehicles, more so than for petrol vehicles.
Travelcard vs. manufacturers’ type-approval CO
2 emissions 100% 105% 110% 115% 120% 125% 130% 135% 2000 2005 2010 2015
Vehicle model year Lower Medium ALL 100% 105% 110% 115% 120% 125% 130% 135% 2000 2005 2010 2015
Vehicle model year Mini ALL 100% 105% 110% 115% 120% 125% 130% 135% 2000 2005 2010 2015
Vehicle model year Medium ALL 100% 105% 110% 115% 120% 125% 130% 135% 2000 2005 2010 2015
Vehicle model year Small ALL 100% 105% 110% 115% 120% 125% 130% 135% 2000 2005 2010 2015
Vehicle model year Upper Medium
ALL
Figure 13. divergence, travelcard vs. manufacturers’ type-approval co2 emissions by
the analysis by vehicle segment is confirmed by means of classifying vehicles by 5 g/ km co2 emission intervals (see figure 14).14 As shown by the linear regression lines in the
figure, the discrepancy is largest for low-co2-emission vehicles, in which case the deviation is around or even exceeding 40 percent, with slightly higher values for diesel vehicles.15 for
high-co2-emission vehicles, the discrepancy is smaller, closer to 20 percent. focusing on
the absolute co2 emission levels instead of percentage differences, the observed
differ-ences would be more constant over the range of co2 emission intervals.
90 110 130 150 170 190 210 230 250 270 290 90 110 130 150 170 190 210 230 250 Tr avelcard CO 2 emissions [g/km]
Manufacturers’ type-approval CO2 emissions [g/km] Diesel vehicles – 2011
Petrol vehicles – 2011 Linear (Diesel vehicles – 2011)
Linear (Petrol vehicles – 2011) 100%
140% 130% 120% 110%
Figure 14. correlation deviation, travelcard vs. manufacturers’ type-approval co2
emissions by co2 emission category.
like the spritmonitor.de data, the travelcard results are detailed enough to permit a meaningful analysis of individual brands and manufacturers. figure 15 summarizes the results. only for daimler are the data points too sparse to allow for any historical trend line. Because hybrid vehicles make up approximately 3 percent of vehicle sales in the netherlands (compared to 0.7 percent on average in the eu) and around 25 percent of toyota’s vehicle sales in the country, the figures for toyota were segmented to show nonhybrids only, in addition to toyota overall.
14 for the travelcard data, a conversion factor of 2.36 kg co2 per liter of petrol and 2.65 kg per liter of diesel fuel
was used.
Travelcard vs. manufacturers’ type-approval CO 2 emissions 100% 105% 110% 115% 120% 125% 130% 135% 2000 2005 2010 2015
Vehicle model year
ALL Ford 100% 105% 110% 115% 120% 125% 130% 135% 2000 2005 2010 2015
Vehicle model year
ALL Renault 100% 105% 110% 115% 120% 125% 130% 135% 2000 2005 2010 2015
Vehicle model year BMW ALL 100% 105% 110% 115% 120% 125% 130% 135% 2000 2005 2010 2015
Vehicle model year
ALL GM 105% 110% 115% 120% 125% 130% 135% ALL Toyota Toyota (excl. hybrid cars) 100% 2000 2005 2010 2015
Vehicle model year
100% 105% 110% 115% 120% 125% 130% 135% 2000 2005 2010 2015
Vehicle model year
ALL Fiat 100% 105% 110% 115% 120% 125% 130% 135% 2000 2005 2010 2015
Vehicle model year
ALL PSA 105% 110% 115% 120% 125% 130% 135% Volkswagen (incl. Audi) ALL Audi 100% 2000 2005 2010 2015
Vehicle model year
Figure 15. divergence, travelcard vs. manufacturers’ type-approval co2 emissions by
manufacturers/brands.16
16 there are insufficient data points to allow detailed analysis for daimler. gm = general motors (opel), psA (peugeot-citroën), volkswagen (Audi, seat, skoda, vw)
figure 16 illustrates the absolute co2 reductions for new cars in the netherlands over
the past few years. According to type-approval data, the average co2 emission level
decreased from 171 g/km in 2004 to 126 g/km in 2011, a 26 percent reduction. however, according to travelcard data, the real-world emission level in 2004 was around 190 g/ km, about 11 percent higher than the certified figure. over the years, the gap widened to 35 g/km in 2011, which is equivalent to about 1.4 liters of fuel per 100 km. thus,
accord-ing to the travelcard data, the real-world co2 emission reduction over the seven-year
period was only about 15 percent.
174 172 174 171 170 167 165 157 147 136 126 190 193 189 187 183 175 165 161 0 50 100 150 200 250 2000 2002 2004 2006 2008 2010 2012 CO 2 emissions [g /k m]
Vehicle model year Netherlands type-approval data
Travelcard on-road data
35 g/km ≈ 1.4 l/100km
Figure 16. Average co2 emissions of new cars in the netherlands according to
4.1.3 leasePlan (Germany)
Data type On-roadData availability 2006–11, approx. 15,000 entries per year
Data collection fuel consumption data, automatically recorded using a tank card when refueling at gas station Fleet structure,
driving behavior company cars, mostly extra-urban and highway driving; fuel is usually paid for by the employer
description
leaseplan,17 which offers travelcard as one of its lines of business, is a global fleet and vehicle
management company of dutch origin. established more than 45 years ago, leaseplan has grown to become the world’s leading fleet and vehicle leasing company, managing around 1.3 million vehicles of multiple brands and providing financing and operational fleet and vehicle management services in 30 countries. leaseplan is located in the netherlands and is 50 percent owned by the volkswagen group and 50 percent by fleet investments B.v.
for the analysis in this section, only passenger car data from leaseplan germany18 were
analyzed. leaseplan germany is a fully owned subsidiary of leaseplan corporation and oversees 80,000 vehicles. its dataset is similar to the one compiled by travelcard, only the geographic range is different (germany versus the netherlands). the following brand/manufacturer classification was used: Bmw (Bmw, mini), daimler (mercedes-Benz, smart), fiat (Alfa-romeo, chrysler, fiat, jeep), ford, general motors (chevrolet, opel), psA (peugeot, citroën), renault-nissan (dacia, nissan, renault), toyota (lexus, toyota), volkswagen (Audi, porsche, seat, skoda, vw).
only data for 2011 were available at a level of detail that allowed an analysis by segment or individual manufacturer. data for 2006–10 were provided by leaseplan only at an aggregate level. for the leaseplan data, the model year of vehicles is not known, simply the fleet average in a given year. the leaseplan data therefore represent a fleet-wide average rather than new vehicle data. According to leaseplan, the average holding period for a lease is about three years, that is, there will be a time lag of about one to two years before the fuel consumption data provided for a certain year truly reflects the new vehicle average for that given year. reductions in fuel consumption figures will therefore occur more slowly in the data than in real life.
the cars managed by leaseplan are company cars and thus different in a number of respects from the type of cars typically found in the private car market. this becomes clear by comparing leaseplan with the german new car market (see figure 17). Almost all leaseplan vehicles (94 percent) are diesel powered, whereas among the overall fleet only around 50 percent are. information on transmission type is not available from the leaseplan data for comparison. looking at the market shares for segments, mini and small vehicles hardly show up at all in the leaseplan statistics. the dataset mostly contains lower-medium-sized, medium and upper-medium-sized vehicle models, with the larger two of these size classifications strongly overrepresented compared to their share in the overall german market. in terms of individual companies, Bmw, ford, and volkswagen vehicles tend to be more prevalent in the leaseplan dataset than on the nation’s highways, while fiat, psA, renault-nissan, and toyota are less frequently found.
the average co2 (type-approval) emission value for 2011 in the leaseplan dataset was
140 g/km, significantly lower than the average for new passenger cars in the germany in that same year (146 g/km), especially when taking into account that the leaseplan data
17 http://www.leaseplan.com 18 http://www.leaseplan.de
represent a fleet average and include as well 2009 and 2010 vehicles for 2011 (figure 18). the reason is the much higher diesel vehicle share in the leaseplan fleet, and the fact
that co2 emission levels tend to be lower for diesel vehicles than for petrol vehicles.
Ma rk et shar e 0% 50% 100% Diesel vehicles Ma rk et shar e 0% 50% Mini Smal l Low-Me d Me dium Up-Med Luxu ry Spor t Ot he r Ma rk et shar e 0% 50% BM W Daimler Fiat Ford GM PS A RN To yo ta VW Ot he r
Low-Med = Lower Medium
Up-Med = Upper Medium RN = Renault-NissanVW = Volkswagen
Comparison for 2011 only LeasePlan
Total number of vehicles with Leaseplan data evaluated: approx. 150,000
Germany average (Diesel vehicles only) Germany average
Figure 17. characteristics of the leaseplan data analyzed in comparison with the german
0 50 100 150 200 2001 2003 2005 2007 2009 2011 Ty pe-approval CO 2 [g/km]
Fleet composition year
German average LeasePlan
Figure 18. co2 type-approval data for leaseplan vehicle fleet and the german new car market.
methodologY
the leaseplan data include manufacturers’ type-approval fuel consumption figures
for each vehicle19 as well as the real-world consumption measurements determined by
summing up the fueling events for each vehicle. therefore, the dataset can be analyzed without needing to consult other data sources. in aggregating the individual vehicle data to fleet-wide averages, the leaseplan vehicle count was used to weight the results. in other words, the composite data do not reflect the distribution of the german market generally but instead the frequency with which a vehicle is included in the leaseplan fleet. fuel consumption reported by leaseplan, along the same lines as the spritmonitor.de or travelcard data, does not depend on laboratory measurements but reflects the actual experience of a substantial customer base, so the values are a good representation of
real-world co2 values. however, as with the travelcard data, it needs to be taken into
account that leaseplan vehicles are company cars. leaseplan drivers themselves gener-ally do not have to pay for their fuel, which is covered by their employers. it is therefore to be expected that leaseplan drivers have weaker incentives to drive in a fuel-efficient manner. At the same time, according to leaseplan, many customers drive long distances on the Autobahn (for example, as sales representatives), often at speeds higher than
130 km/h, in which case co2 emissions increase drastically. Yet, as discussed for the
spritmonitor.de and travelcard data already, any bias in driving behavior is not expected to have significantly changed in recent years.
results
leaseplan data go back only as far as 2006. the degree of discrepancy starts at 21 percent in 2006 and increases to 33 percent in 2011, with a particular acceleration since 2008/2009 (see figure 19). As discussed at the beginning of this section, only the fleet-wide average for a given year is reported—if focusing only on new vehicles, the increase in the discrepancy is thus projected to be even steeper than what the figure indicates.
100% 105% 110% 115% 120% 125% 130% 135% 2000 2002 2004 2006 2008 2010 2012
LeasePlan vs. manufacturers’ type-approval CO
2
emissions
Fleet composition year
Figure 19. divergence, leaseplan vs. manufacturers’ type-approval co2 emissions
on average.
differences between vehicle segments and manufacturers could only be analyzed for the year 2011, as for the years 2006–10 only aggregated data were provided by leaseplan. so the results shown in figure 20 to figure 22 are only a snapshot in time. moreover, because these are vehicle fleetwide data, the 2011 figures take in some vehicles that entered the market up to three years earlier.
figure 20 shows the 2011 leaseplan data by vehicle segment. while the discrepancy tends to be smaller for the mini and luxury/sport segments than for other vehicle seg-ments, there is limited scope for data interpretation, given the low number of vehicles in the mini and small segments.
1 1.05 1.1 1.15 1.2 1.25 1.3 1.35 1.4 Mini Smal l Lower Medium Medium Upper Mediu m Luxury Sport Off-road Multi-Purpose
LeasePlan vs. manufacturers’ type-approval CO
2
emissions 2011
AVERAGE
Figure 20. divergence, leaseplan vs. manufacturers’ type-approval co2 emissions by
figure 21 provides a more detailed analysis by vehicle co2 emission 5 g/km intervals for the year 2011. According to the data, discrepancies are higher (closer to 140 percent) for
low-co2-emitting cars than for high-co2-emitting cars (closer to 120 percent). however,
given the scarcity of small and low-co2-emitting cars in the leaseplan dataset, it is not
possible to draw any solid conclusions regarding differences between vehicle segments
when it comes to co2 emissions.
90 110 130 150 170 190 210 230 250 270 290 90 110 130 150 170 190 210 230 250 LeasePlan CO 2 emissions [g/km]
Manufacturers’ type-approval CO2 emissions [g/km] Diesel vehicles – 2011
Linear (Diesel vehicles – 2011)
100%
140% 130% 120%
110%
Figure 21. correlation deviation, leaseplan vs. manufacturers’ type-approval co2
no major differences show up in the 2011 analysis by manufacturer, with all carmakers
falling into a fairly narrow band, close to an average of 33 percent higher real-world co2
emissions than according to type-approval values. it may well be that for the years prior to 2011 differences would have been more pronounced and then converged, as was the case for the spritmonitor.de and travelcard data.
100% 105% 110% 115% 120% 125% 130% 135% 140% BM W Daimle r Fiat Ford General Motors PSA Renault-Nissan To yota Vo lkswagen Vo lv o (Audi)
LeasePlan vs. manufacturers’ type-approval CO
2
emissions 2011 AVERAGE
Figure 22. divergence, leaseplan vs. manufacturers’ type-approval co2 emissions by
brands/manufacturers20 for the year 2011.
4.1.4 Honestjohn.co.uk (United Kingdom)
Data type On-roadData availability 2000–2011, approx. 3,000 entries per year
Data collection fuel consumption data, entered by vehicle drivers into publicly available online database Fleet structure,
driving behavior mostly private cars, urban and extra-urban driving, no details on driving style known
description
honestjohn.co.uk21 is motoring website in the united Kingdom that allows anyone to
submit real-world fuel-consumption data. users can select a vehicle model and engine configuration and enter the fuel consumption figure that is based on their everyday driving experience. in contrast to spritmonitor.de, the honestjohn.co.uk fuel consumption data are entered directly by the user (in miles per gallon, mpg) and not calculated by the website itself based on the amount of fuel purchased and the odometer readings. the reported values are freely accessible, individually by vehicle model and engine configura-tion or aggregated by model or manufacturer. in total, approximately 37,000 user entries have been submitted so far, with 33,500 data entries being available for this analysis. vehicle model-years 2000–2011 are included here, with all of these years having more than 600 data entries per year.
comparing the honestjohn.co.uk dataset with the u.K. new car average for 2011 shows that there are more diesel vehicles in the honestjohn.co.uk data (58 percent vs. 51 percent) (figure 23). the difference was even more pronounced for previous model years, with the honestjohn.co.uk fleet always having around 50–60 percent diesel vehicles, while the u.K. diesel market share steadily increased from 18 percent in 2001 to 51 percent in 2011. information on the transmission type could not be analyzed in the context of this study. A differentiation by vehicle segments is possible and, for 2011, shows an overrepresentation of lower-medium-sized and upper-medium-sized vehicles in the honestjohn.co.uk dataset and an underrepresentation particularly of small vehicles. however, it has to be noted that there are fluctuations in the dataset when looking at the segment allocation for different model years, and the share of small vehicles is larger for most of the years before 2011.
looking at the type-approval co2 emission levels of the honestjohn.co.uk dataset, it is
obvious that the average of all honestjohn.co.uk vehicles registers a lower emission level
than the u.K. new vehicle average (figure 24)—128 g/km vs. 138 g/km in 2011.22 to some
extent this is caused by the above-average share of diesel vehicles in the honestjohn. co.uk dataset. however, the prevalence of diesel cannot fully explain the difference observed. nevertheless, as the difference found is quite constant over time and as for the further analysis only relative differences between type-approval and real-world data are assessed, no further implications are expected.
Ma rk et shar e Ma rk et shar e 0% 50% 100% Diesel vehicles 0% 50% Mini Smal l
Low-Med Medium Up-Med Luxury
Spor
t
Othe
r
Low-Med = Lower Medium Up-Med = Upper Medium Comparison for 2011 only
honestjohn.co.uk
Total number of vehicles with honestjohn.co.uk data evaluated: 33,500
UK average
Figure 23. characteristics of the honestjohn.co.uk data analyzed in comparison with the
u.K. new car market.23
0 50 100 150 200 2001 2003 2005 2007 2009 2011 Ty pe-approval CO 2 [g/km]
Vehicle model year
UK average honestjohn.co.uk
Figure 24. co2 type-approval data for honestjohn.co.uk vehicle fleet and u.K. new car market.
methodologY
in contrast to spritmonitor.de, users of honestjohn.co.uk select their precise vehicle model and engine configuration from a list, and honestjohn.co.uk then matches the user’s real-world data entry (after carrying out plausibility checks for the data entries) with the corresponding type-approval entry from a commercial database. therefore, both real-world and type-approval data for all vehicles are directly provided by honestjohn.co.uk. the honestjohn.co.uk dataset for some vehicles includes a minimum/maximum range for the type-approval co2 emission level. in this case, the average level was used. the relative difference between real-world and type-approval data was calculated for each vehicle model and then aggregated using the honestjohn.co.uk user entry count.
As with the datasets previously examined, fuel consumption rates reported by
honestjohn.co.uk are not based on laboratory measurements and are expected to reflect real-world driving of customers. details on the driving style of users are not known. nevertheless, any bias in the data reported to honestjohn.co.uk is expected to be largely consistent over time and should not affect the observed trends in the relationship between the real-world and the type-approval data.
results
the discrepancy between real-world and manufacturers’ type-approval values according to honestjohn.co.uk increased from 3 percent in 2000 to 27 percent in 2011 (figure 25). A significant difference in results between petrol and diesel vehicles cannot be deter-mined based on the data.
100% 105% 110% 115% 120% 125% 130% 2000 2002 2004 2006 2008 2010 2012
honestjohn.co.uk vs. manufacturers’ type-approval CO
2
emissions
Vehicle model year All vehicles
Diesel vehicles Petrol vehicles
Figure 25. divergence, honestjohn.co.uk vs. manufacturers’ type-approval co2 emissions
A more detailed analysis is possible only for some vehicle classes—for others, the number of data points per year is too low to allow for a meaningful trend analysis. As figure 30 shows, no major differences can be observed for the small, lower-medium-sized, medium and upper-medium-sized categories. overall, each vehicle class follows the general trend of displaying an increasing discrepancy over time.
honestjohn.co.uk vs. manufacturers’ type-approval CO
2 emissions 100% 105% 110% 115% 120% 125% 130% 135% 2000 2005 2010 2015
Vehicle model year
Small ALL 100% 105% 110% 115% 120% 125% 130% 135% 2000 2005 2010 2015
Vehicle model year
Lower Medium ALL 100% 105% 110% 115% 120% 125% 130% 135% 2000 2005 2010 2015
Vehicle model year
Medium ALL 100% 105% 110% 115% 120% 125% 130% 135% 2000 2005 2010 2015
Vehicle model year
Upper Medium ALL
Figure 26. divergence, honestjohn.co.uk vs. manufacturers’ type-approval co2 emissions
by vehicle segment.
An analysis of the honestjohn.co.uk data by manufacturer/brand does not provide any statistically meaningful results because of the relatively low number of data entries and is therefore not included in this report.
4.1.5 WhatCar? (United Kingdom)
Data type On-roadData availability 2011–12, approx. 174 vehicle models tested
Data collection portable emissions measurement system (pems) testing on urban and extra-urban roads Fleet structure,
driving behavior mixed vehicle fleet; professional drivers always using the same test route
description
the uK magazine WhatCar? calls itself “Britain’s biggest and best car buyer’s guide,”24
offering a section on its website (“true mpg”) where readers can find out about the
real-world fuel consumption of various vehicle models.25 the underlying data source is
a series of on-road vehicle tests using portable emission measurement system (pems)
equipment.26 these tests are carried out by a company called emissions Analytics27 on
behalf of the magazine.
the vehicles are driven on a test route that encompasses urban and extra-urban roads with a hot engine and takes about 1.5 hours in total, including extended driving at 112 km/h on the motorway. the average speed during the test is approximately 60 km/h. According to emissions Analytics, the test route is more aggressive than the nedc as it has been matched to typical u.K. driving patterns. vehicles are tested in the default state from the manufacturer. therefore, any alternative driving settings available, such as “econ” modes, are not used. Air conditioning and other nonessential on-board systems are left switched off. the test drivers, says WhatCar?, move at “steady pace, avoiding
heavy acceleration and braking whenever possible.”28 during the vehicle test, sensors
measure various parameters, including vehicle speed, which allows subsequent
adjust-ment of the co2 emissions measured in the test, depending on the volume of traffic and
other conditions such as ambient temperature. this ensures that the final co2 emission
figures are as consistent as possible when comparing the results from different test drives. the results are standardized to 20 degrees celsius, one atmosphere of air pres-sure, and average humidity.
in total, 174 vehicle models have been tested by emissions Analytics on behalf of WhatCar? in the time period september 2011 to december 2012, and the results were made available for this analysis. fifty-seven percent of the vehicles tested are diesel, slightly more than the u.K. average in 2011 (51 percent) (see figure 27). the distribution across vehicle segments is fairly representative but with fewer small vehicles and more upper-medium-sized and luxury-class vehicles being tested than would be character-istic for the u.K. market. Bmw and daimler cars are slightly overrepresented; ford and
gm cars are underrepresented. the type-approval co2 emission value calculated based
on the WhatCar? data is 136 g/km. this is slightly lower than the u.K. new car average for 2011 (138 g/km). however, it should be noted that the WhatCar? dataset is a mix of
2011 and 2012 vehicles, which might explain the difference in co2 emission levels.
24 http://www.whatcar.com/truempg/how-we-did-it 25 http://www.whatcar.com/truempg/
Ma rk et shar e Ma rk et shar e Ma rk et shar e Av er ag e CO 2 le ve l [g /k m] 0% 50% 100% Diesel vehicles 0% 50% Mini Smal l Low-Me d Me dium Up-Med Luxu ry Spor t Ot he r 0% 50% BM W Daimler Fiat Ford GM PS A RN To yo ta VW Ot he r
Low-Med = Lower Medium Up-Med = Upper Medium UK average
Total number of vehicles with WhatCar? data evaluated: 174
RN = Renault-Nissan VW = Volkswagen Comparison for 2011 only 0 50 100 150 200 Type-approval CO2 WhatCar?
Figure 27. characteristics of the WhatCar? data analyzed in comparison with the u.K.
new car market.
methodologY
the WhatCar? dataset includes type-approval as well as real-world test co2 emissions
for every individual vehicle model variant tested. the dataset was linked to u.K. sales data for 2011 in order to allow the calculation of sales-weighted averages.
results
the discrepancy between type-approval and real-world co2 emissions based on the
WhatCar? dataset is 25 percent. A historical analysis is not possible since only data for 2011–12 are available. Also, a more detailed analysis by vehicle segment or manufacturer has not been carried out, owing to the low total number of vehicles tested.
4.1.6 tCS (Switzerland)
Data type On-road and Laboratory
Data availability 1996–2012, approx. 20 vehicle models tested per year
Data collection laboratory testing + on-road driving for each vehicle, about 3,000 km Fleet structure,
driving behavior most popular vehicle models in switzerland; professional drivers
description
touring club schweiz (tcs) is switzerland’s largest car club, with about 1.6 million
members.29 since 1996 tcs has carried out vehicle tests to compare real-world fuel
consumption with manufacturers’ type-approval values. According to tcs, a key criterion for selecting test vehicle models is their popularity among swiss car buyers. in total about 15–20 vehicles, provided directly by the manufacturers, are tested in each year. in the early years it was mostly petrol-powered cars, whereas in recent years approximately the same number of gas and diesel vehicles were tested.
tcs carries out two different tests: in an on-road test each vehicle is driven for about 3,000 km, and the real-world fuel consumption is recorded. According to tcs, these on-road tests are usually carried out by the same drivers, whose driving behavior has not changed over the years. the second test for each vehicle is on a chassis dynamometer in a laboratory. the laboratory test is intended to reflect closely the type-approval tests carried out by the manufacturers, making use of the nedc and the procedures and settings used for type-approval testing.
methodologY
the dataset provided by tcs includes manufacturers’ type-approval values as well as tcs on-road and laboratory test results for each vehicle tested. the percentage discrepancy was ascertained, and an average discrepancy level was calculated for each test year.
results
figure 28 summarizes the aggregated results for the test years 1996 to 2012. the dis-crepancy (measured against manufacturers’ results) found by tcs laboratory tests, using the same test cycle and procedure as used for type approval (including using road-load coefficients supplied by the manufacturers), usually is below 4 percent over the entire time period. it should be noted that the swiss vehicle importers and tcs in 1997 agreed to a maximum allowed discrepancy between manufacturers’ type-approval values and tcs laboratory testing of 0.6 liters/100km (schwitzer and löhrer 2008) (this equals approximately 8–10 percent). At the same time on-road discrepancy levels increased from close to zero in 1996 to 22 percent in 2012, with a particularly steep climb since 2008. Because of the low number of vehicles tested in each year, a separate analysis for petrol and diesel vehicles is not regarded as meaningful.