– Steve Orloff, Blaine Hanson & Dan Putnam
–
Soil-Moisture
Monitoring
A Simple Method to Improve
Alfalfa and Pasture Irrigation Management
Soil-Moisture
Monitoring
Soil-Moisture
Monitoring
A Simple Method to Improve
Irrigation water is essential for profitable crop
production in most of the arid West. Proper irrigation
management is key for high yields and to avoid stress
from too much or too little water. Improper irrigation
management limits yields more often and to a greater
degree than any other production factor. Perhaps the
reason why irrigation practices often fall short of
optimum is that nearly all the action occurs in
the soil out of our view.
Determining when to irrigate and how much water
to apply are not simple tasks. How can you assess
whether irrigation practices are correct? This
publication provides information on a relatively
simple and effective method for managing irrigation
on alfalfa and irrigated pasture.
What’s the Best
Strategy for Irrigation
Scheduling?
The decision of when to irrigate is usually based on past experiences, weather-based information (crop evapotranspiration data), or soil-based measurements. Past experiences may not be correct and are often not adjusted for annual changes in weather.
Scheduling irrigations based on crop evapotranspiration can be difficult because, unlike other crops with a single harvest per season, the multiple harvests of alfalfa and pasture confound the process. Irrigation water cannot be applied too close to a cutting, and fields obviously cannot be irrigated while the crop is curing. Therefore, there is typically a 6- to even 20-day period during which fields cannot be irrigated. This can make irrigation scheduling using weather-based information problematic. In addition, it may be difficult to obtain accurate data for some locations and, even when data are available, the task of keeping track of evapotranspiration data for individual fields can be time consuming. Because of the difficulties and shortcomings of these methods, soil-based irrigation scheduling may be the preferred technique.
Soil-based measurements may be far more practical and easy-to-use for alfalfa and pasture producers. Soil moisture content often goes unchecked. If soil moisture is monitored, it is usually only done using a shovel or soil auger. While better than nothing, using a shovel or auger is imprecise and is only useful for a gross evaluation of the soil moisture content in the upper foot, or less, of soil. Several inexpensive technologies may help growers monitor soil moisture.
Funding provided by:
U.S. Department of the Interior, Fish and Wildlife Service under the authority of the Klamath Act and Klamath River Basin Conservation Area Restoration Program, administered and implemented by: The Siskiyou Resource Conservation District.
In cooperation with:
University of California Cooperative Extension Scott River Watershed Council
Published by:
University of California Cooperative Extension, Siskiyou County 1655 S. Main Street, Yreka, California 96097
Authors:
S. Orloff, UC Cooperative Extension 1655 S. Main St., Yreka, CA 96097;
B. Hanson, Dept. Land, Air, and Water Resources; and D. Putnam, Dept. Agronomy and Range Science, University of California, One Shields Ave., Davis, CA 95616
Additional Information:
For additional information and an Excel Spreadsheet to graph data see: http://alfalfa.ucdavis.edu.
The University of California prohibits discrimination against or harassment of any person employed by or seeking employment with the University on the basis of race, color, national origin, religion, sex, physical or mental disability, medical condition (cancer-related or genetic characteristics), ancestry, marital status, age, sexual orientation, citizenship, or status as a covered veteran (special disabled veteran, Vietnam-era vetVietnam-eran or any other vetVietnam-eran who served on active duty during a war or in a campaign or expedition for which a campaign badge has been authorized). University Policy is intended to be consistent with the provisions of applicable State and Federal laws. Inquiries regarding the University’s nondiscrimination policies may be directed to the Affirmative Action/Staff Personnel Services Director, University of California,
Agriculture and Natural Resources, 300 Lakeside Drive, 6th Floor, Oakland, CA 94612-3550; (510) 987-0096.
To simplify information, trade names of products have been used. No endorse-ment of named products is intended, nor is criticism implied of similar products that are not mentioned.
Introduction
Expressing Soil
Moisture Content
Soil moisture levels can be expressed in different ways, depending largely on the instrument used. Soil moisture content is often expressed as a percent (the weight of the water in the soil divided by the weight of oven-dry soil x 100). Other soil moisture monitoring devices use soil moisture tension to indicate soil moisture levels. Soil moisture tension refers to how strongly water is held on soil particles—the higher the tension the more difficult it is for plant roots to extract water from
➤ When do I start irrigating?
This is often a difficult decision. The soil profile is often filled from winter rains. But after the crop resumes growth in spring and the weather warms, you must decide when the soil moisture is depleted enough to require irrigation. Most irrigation systems do not have the capacity to “catch up” when the soil profile has been excessively depleted in spring.
Answer: The first irrigation should occur when soil moisture tension reaches the recommended value for your soil type (see table on next page).
➤ Do I irrigate again before harvest?
Alfalfa is most sensitive to water stress after cutting when the plants start to regrow. Resistance block readings help assess whether the soil-moisture content is sufficient to avoid water stress through the duration of the harvest period until irrigation can be resumed.
Answer: Track soil moisture to predict the rate of soil moisture
the soil. Therefore, low soil moisture tension indicates moist soil and high soil moisture tension indicates dry soil. Soil moisture tension is usually expressed in centibars. For some types of soil moisture resistance blocks, the instrument readings must be converted to soil moisture tension using appropri-ate calibration relationships.
Resistance Blocks –
A Useful Tool
More than six years of field studies in the Scott Valley (a high-elevation
valley in northern California) demon-strated the usefulness of soil moisture monitoring in alfalfa and irrigated pasture fields. These studies showed that significant improvements in irrigation management were possible in many fields by monitoring soil moisture levels and adjusting irrigation practices accordingly. Electrical resistance blocks provided a reliable indication of soil moisture levels and are a cost-effective tool for effective irrigation management.
depletion. By graphing the data and extending the line through the harvest period, you can anticipate soil moisture loss during harvest. If anticipated soil moisture levels fall well below the recommended values for your soil type (see table on next page), an irrigation or partial irrigation may be desirable before cutting.
➤ Did I fill the profile?
Soil moisture sensors are very useful to assess the moisture status at the lower end of the root zone—especially for a deep-rooted crop like alfalfa. The lower half of the root zone supplies moisture reserves to draw upon when needed and should not be excessively depleted. Answer: If the soil profile is filled after irrigation, soil moisture readings at all depths should return to less than 10 centibars for a sandy soil and less than about 30 centibars for medium/fine-textured soil. If the sensors do not respond after irrigation the water did not penetrate to the depth of the sensor. Monitor soil moisture after each irrigation to determine how many irrigations are needed to refill the profile.
➤ Should I change my irrigation practices?
Soil moisture monitoring is helpful to verify that current irrigation practices satisfy, but do not exceed, the needs of the crop. A graph of soil moisture readings over the season provides a sound basis for altering and fine-tuning irrigation practices.
Answer: Plot soil moisture readings on a graph (see example graphs on page 5). The lines on your graph should oscillate as they do in Figure 1. The highest soil moisture tension reached should be the values where irrigation is recommended (see table on next page). Then, following irrigations, the values should return to less than 10 for a sandy soil and less than about 30 for a medium/ fine-textured soil. If values exceed the recommended range, the soil is becoming excessively dry between irrigations and the field should be irrigated more frequently or with more water per irrigation. If values are low (indicating adequate moisture), irrigation can be skipped or delayed until soil moisture sensors indicate irrigation is needed.
Ask Questions About
Water Management!
Ask Questions About
Water Management!
Resistance Blocks
Electrical resistance blocks (also called gypsum blocks or resistance blocks) are not new, but recent advances have improved their accuracy and ease-of-use. Resistance blocks evaluate soil moisture tension by measuring the electrical resistance between two electrodes. The blocks take up and release moisture as the soil wets and dries. The higher the water content of the blocks, the lower the electrical resistance. The electrical resistance is measured with a portable meter that is connected to wire leads coming from the moisture sensors (Figure 4).
Because there is a known and consistent calibration between electrical resistance and soil moisture for the Watermark®
block (a resistance block made by Irrometer Company, Inc.), it can closely estimate soil moisture tension in centibars.
Interpreting the
resis-tance block readings
An important point to understand when using the Watermark® sensors is
that the lower the reading the higher the soil moisture content, and conversely, the higher the reading the lower the moisture content. When the soil is saturated after a rainfall or irrigation (air spaces are mostly filled with water) the Watermark® reading is low, typically
less than 5 to 10 centibars. As evapora-tion from the soil surface and transpira-tion by the crop dry the soil, the moisture sensor readings gradually increase until they indicate need for an irrigation.
The centibar reading at which irrigation is necessary depends on soil type (see table). Sandy soils retain far less water than soils with a high clay or organic matter content, so irrigation on sandy soils should occur more frequently and at a lower soil moisture tension value. Soil moisture sensors may not be useful for very sandy soils with extremely low water holding
Using Soil Moisture Data
Recommended Values at Which to Irrigate
Alfalfa and Pasture for Different Soil Types
Soil Type Moisture Reading (centibars)
Sand or loamy sand 40–50*
Sandy loam 50–70
Loam 60–90
Clay loam or clay 90–120
*Caution: Soil moisture sensors may not be useful for very sandy soils with extremely low water holding capacity, as the sensors may not respond quickly enough to the rapid decline in soil moisture.
Note: These values were based on 50% depletion of available soil moisture for different soil types.
respond quickly enough to the rapid decline in soil moisture.
After the field is irrigated the centibar readings typically return to the teens or single digit values. These wetting and drying cycles continue throughout the season as the crop is irrigated and then the soil dries with crop water use. The key to proper irrigation management using soil moisture sensors is to monitor the sensors regularly, track the soil mois-ture level, and irrigate when the centibar readings are in the desired range for your soil type (See Figure 1). Irrigating when the soil moisture readings exceed the desired range may result in crop stress and yield loss. Irrigation before the readings reach the desired range may result in excessive irrigation, water wastage or runoff.
Using and interpreting
a soil-moisture graph
The best way to use the soil-moisture measurements is to plot them on a graph. The plotted data present a picture of the soil moisture status and indicate how fast the soil is drying. After a few points are plotted, you can estimate approximately how many days it will take for the soil to dry before irrigation is needed. Plot the data from each Watermark® sensor with a
different color line so that the various depths can be easily distinguished. An Excel-based spreadsheet template for entering field data is available for free from the authors or from http://alfalfa.ucdavis.edu.
We prefer inverting the y-axis (the centibar readings) so that zero is at the top of the graph instead of the bottom (Figure 1). This simplifies interpreta-tion. Using this orientation, the line on the graph drops as the soil dries and rises when the soil is wet. This pattern is more consistent with how one conceptually thinks of changes in soil moisture content.
The graph in Figure 1 is an example of effective irrigation management and illustrates how readings typically fluctuate from spring through the first alfalfa cutting. Soil moisture at the uppermost sensor normally declines first, as there is greater root activity in the upper portion of the soil profile than at deeper depths. There was also far more fluctuation in soil moisture at the shallow depths (1 and 2 feet), as noted by the oscillation in the lines, than at the deepest depth (4 feet). Again, this is because of more extensive root activity in this zone. Figure 1 illustrates effective irrigation management— irrigations occurred when the 1-foot sensor readings reached the appropriate range for this soil type (60–90 centibars). Figures 2 and 3 illustrate inadequate and excessive irrigation examples, repectively.
0 20 40 60 80 100 120 140 160 180 200 4/15 5/1 5/15 5/29 6/11 7/3 7/17 7/30 8/13 8/29 9/17 10/1
Sensor Reading (centibar
s) 6" 1Ft 2Ft WET DRY Irrigation Irrigation Irrigation Harvest Harvest Harvest 0 20 40 60 80 100 120 140 160 180 200 4/15 4/22 4/29 5/6 5/13 5/20 5/27 6/3 6/10 6/17 6/24 7/1
Sensor Reading (centibar
s) 1 Ft 2 Ft 4 Ft Irrigation Irrigation WET DRY
A
B
C
D
E
F
Harvest IrrigationFigure 1.
Proper Irrigation
Management.
Shaded area indicates where irrigations should occur. At the start of the season the soil is moist from winter and spring rains— the readings are less than 20 centibars (A). Gradually the soil dries and the readings increase, beginning with the sensor located at the one-foot depth followed by the deeper depths. When the soil moisture reading dropped to near 80 in early May (B), irrigation water was applied and the centibar readings at all three depths went to below 20, indicating the soil profile had been refilled. The drying cycle resumed until a partial irrigation occurred in late May (D). A partial irrigation was needed to replenish enough soil moisture to carry the crop through the harvest period without excessive soil moisture depletion and crop stress. The first cutting occurred in early June [note point on graph when soil moisture content was lowest; (E)]. Following cutting, irrigation resumed until the soil moisture content at all three depths was restored (all readings below 20 centibars at point F).
Figure 2.
Under-irrigation example.
Soil moisture tension levels for an irrigated alfalfa/grass field. The first irrigation occurred too late, and soil moisture remained extremely low for much of the season. Not until late August was the soil profile refilled—too late for much benefit to the crop. This field would have benefitted from careful monitoring of soil moisture and timely early irrigation.
Figure 3.
Over-irrigation example.
Soil moisture levels for an irrigated alfalfa field. Soil moisture tension never exceeded 50 centibars and remained below 30 centibars for most of the season. (Irrigation should occur at 60–90 centibars; shaded area). One or two irrigations could have been eliminated or less water applied per irrigation. 0 20 40 60 80 100 120 140 160 180 200
Sensor Reading (centibar
s) 1 Ft 2 Ft 4Ft WET DRY 4/15 5/1 5/15 5/29 6/11 7/3 7/17 7/30 8/13 8/29 9/17 10/1 Irrigation Irrigation Irrigation Irrigation Irrigation Irrigation Irrigation
Harvest Harvest Harvest Harvest
1
2
3
Interpreting
Soil Moisture
Data
Why Monitor Soil
Moisture?
Soil moisture tension data can help ‘train’ the manager or irrigator to make wise irrigation decisions. Combined with observations of the crop and other irrigation scheduling techniques (e.g. the ‘checkbook’ method), soil moisture blocks can help you know what is happening in the soil, and to ‘ground truth’ your decisions. It can help answer questions such as:
When Do I Start
Irrigating?
Figure 2 shows a real-life example of a field where irrigation was delayed too late in the spring. The first irrigation did not occur until early June, when the soil was way too dry (160 centibars at the 6-inch sensor). It is likely that moisture stress occurred and yield was reduced— monitoring would have triggered an earlier irrigation decision.
Is There Enough
Deep Moisture?
It is important to have adequate soil moisture in the lower half of the root zone. Deep moisture serves as a reserve for use when needed, such as harvest periods during the hot summer. While the field in Figure 1 shows plenty of subsurface moisture, Figure 2 shows a field where moisture was excessively depleted at lower depths, stressing the plants. Information about a lack of deep moisture may enable a grower to take corrective action to refill the profile.
Am I Applying
Enough Water?
Under-irrigation is a common hazard of forage production. Figure 2 shows a real-life example of a field that was watered too-infrequently throughout much of the growing season. Many of the readings are above 160 centibars, indicating very dry soil. All but the last
irrigation was inadequate to wet the entire profile. Soil moisture monitoring indicates the grower should irrigate more frequently to correct this situation.
Am I Watering at
the Wrong Time?
In some cases, water is applied at a time when it’s not needed by the crop. In Figures 2 and 3, the growers irrigated late in the season (August) to fill the profile. However, irrigation was most likely unnecessary because the growing season was nearly over, and the crop needed less water. These irrigations probably could have been saved without reducing yield. Soil monitoring can help indicate when to stop watering, as well as when to start.
Am I Watering
Too Much?
Figure 3 shows over-irrigation, or too-frequent irrigation. Soil moisture tension never exceeded 50 centibars, and for most of the season remained below 30 centibars, indicating a continually wet soil (the grower should have waited until soil moisture tension was 60-90 centibars). Maintaining the soil too wet resulted in higher than necessary pumping costs and an increased infestation of the summer annual weeds lambsquarters and pigweed. Based on this graph, one or two irrigations could have been omitted, or less water applied per irrigation, without reducing yield.
Match Irrigation
to Crop Needs!
The principle behind irrigation management is to irrigate only enough to meet crop needs. Irrigation mistakes are easy to make, even for experienced growers. Soil moisture sensors improve the chances of making the right
irrigation decisions.
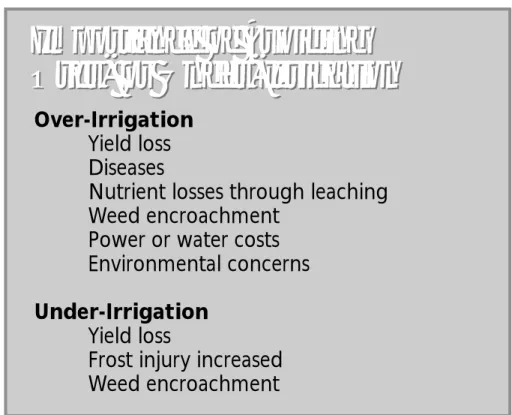
Importance of Avoiding
Over- or Under-Irrigation
Over-Irrigation
Yield loss
Diseases
Nutrient losses through leaching
Weed encroachment
Power or water costs
Environmental concerns
Under-Irrigation
Yield loss
Frost injury increased
Weed encroachment
Using Soil Data to Guide
Irrigation Decisions
Using Soil Data to Guide
Irrigation Decisions
Importance of Avoiding
Over- or Under-Irrigation
Site Selection
A critical part of installation is selecting an appropriate site for the sensors. Since irrigation of the whole field is based on the sensor readings, the sensors need to be in an area that represents the field. Locate the sensors in an area having the soil type typical of the field, uniform crop growth, and in an area that receives full uniform sprinkler or flood-irrigation coverage. If the sensors are placed in an area that is not representative, the results can be very misleading.
One sensor site per field is usually sufficient; however, if the field is variable, two sites are desirable. It may be helpful to install one of the sensors in a slightly sandier area of the field to use as an early indicator of when irrigation may be required.
Sensor Placement
Proper sensor placement is critical for accurately representing soil mois-ture in the crop root zone. We recom-mend installing two or three sensors at each evaluation site (Figure 5). One
Figure 4. The Watermark® soil moisture sensor is an example
of an electrical resistance block. Resistance blocks evaluate soil moisture by measuring the resistance between two electrodes imbedded in the sensor (A) using a calibrated portable meter (B). The blocks absorb moisture as the soil wets and release moisture as the soil dries—the higher the water content, the lower the electrical resistance.
Figure 5. Two
sensors at each evaluation site are acceptable but three are preferred because it provides a more complete picture of the soil moisture status at different depths, allowing the irrigator to determine the depth of the last irrigation. For alfalfa install sensors at 1 ft., 2 ft., and 4 ft. (9 inches, 1.5 ft. and 3 ft. in shallow soils). For pasture install sensors at 6 in., 1 ft. and 2 ft.
4
5
sensor should be in the upper one quarter of the root zone. Another should be toward the bottom of the root zone. When three sensors are used in an alfalfa field, install them at 1 ft., 2 ft., and 3.5 or 4 ft (depending on the depth of the soil). In cases where the rooting depth is more restricted, installations at 9 in., 1.5 ft., and 3 ft. are recommended. Because of shallower rooting in
irrigated pastures, the sensors should be installed at 6 in., 1 ft., and 2 ft.
Three sensors present a more complete soil moisture picture and allow better evaluation of the depth reached with each irrigation.
The uppermost sensor indicates when to irrigate. The second sensor helps determine the depth of the last irrigation and is a check for the first sensor to make sure it is operating properly. The deepest sensor measures moisture reserves deep in the root zone. Maintain the deepest sensor within an acceptable range—not too dry (over 90 centibars) or not too wet (saturated conditions, readings less than 5 or 10 centibars).
Installation and Management
Recommendations
Installation and Management
Recommendations
Photo by Suzanne Paisley
Installation
Use a probe or coring device to create a hole slightly larger than the diameter of the sensor (See Figure 6). The sensor must be in direct contact with the surrounding soil. To ensure contact, prepare a small slurry (mixture of the surrounding soil and water) to pour into the hole before seating the sensors. As the sensor is pushed into the hole, the slurry at the bottom squeezes up around the sensor to provide good contact between the soil and sensor.
The wire leads come up from the sensors to the soil surface. Carefully back fill the hole so as not to damage the wires. A 4- to 6-inch length of 2-inch PVC with a screw-on cap works well and protects the wire leads from a swather or cattle. Dig a shallow (3- to 6-inch) trench for the wire leads coming from each sensor to the PVC housing. You can color code the wires to keep
track of the depth of the sensors by tying a small piece of colored wire to each lead.
An alternative installation involves gluing a section of PVC pipe onto each sensor and feeding the wires through the pipe (Figure 7). This installation allows the sensors to be retrieved and reused. One-half inch Class 315 PVC has an inside diameter
Figure 6. This steel rod is pounded into the
soil to create a hole slightly larger than the diameter of the sensor. A coring device can also be used. Direct contact between the sensor and the soil is essential for reliable soil moisture readings.
Figure 7. Soil moisture sensors can be
glued to the end of PVC pipe. Wire leads from the sensor are connected to bolts protruding from a PVC cap for easy access while taking readings. This installation allows the sensors to be retrieved and reused.
6
7
shown that soil moisture sensors are very useful to diagnose changes needed and to fine-tune irrigation practices. Relatively minor adjustments in irrigation practices could pay large dividends in increased yield or water savings.
Photo by Suzanne Paisley
that fits exactly over the top of the sensor collar. Use PVC to ABS cement to weld the sensor to the PVC. A cap can be fitted directly on the pipe to house the wire leads and the depth of the sensor engraved on the cap.
How Often to Take
Soil Moisture Readings
How often you take soil moisture readings depends on their intended use. Weekly readings should provide an overall picture of the seasonal soil-moisture status of the field for evaluating current irrigation practices. However, if the Watermark® readings
are used for irrigation scheduling, readings should be taken at least twice a week, especially immediately before and after an irrigation. Commercial data logging devices are available that constantly record readings at predetermined intervals.
Conclusion
Irrigation management for alfalfa and irrigated pastures can be difficult—growers must schedule around harvests, making it problematic to use many irrigation-scheduling techniques. However, years of research and field experience have