Geoffrey A. Walford,
1,2,3Stefan Gustafsson,
4Denis Rybin,
5Alena Stan
cáková,
6Han Chen,
7,8Ching-Ti Liu,
7Jaeyoung Hong,
7Richard A. Jensen,
9,10Ken Rice,
11Andrew P. Morris,
12,13Reedik Mägi,
14Anke Tönjes,
15Inga Prokopenko,
13,16,17Marcus E. Kleber,
18Graciela Delgado,
18Günther Silbernagel,
19Anne U. Jackson,
20Emil V. Appel,
21Niels Grarup,
21Joshua P. Lewis,
22,23May E. Montasser,
22,23Claes Landenvall,
24,25Harald Staiger,
26,27,28Jian’an Luan,
29Timothy M. Frayling,
30Michael N. Weedon,
30Weijia Xie,
30Sonsoles Morcillo,
31,32María Teresa Martínez-Larrad,
33Mary L. Biggs,
9,11Yii-Der Ida Chen,
34Arturo Corbaton-Anchuelo,
33Kristine Færch,
35Juan Miguel Gómez-Zumaquero,
36,37Mark O. Goodarzi,
38Jorge R. Kizer,
39,40Heikki A. Koistinen,
41,42,43Aaron Leong,
3,44Lars Lind,
4Cecilia Lindgren,
13,45Fausto Machicao,
27,28Alisa K. Manning,
2,3,45Gracia María Martín-Núñez,
46Gemma Rojo-Martínez,
32,36,47Jerome I. Rotter,
34David S. Siscovick,
9,10,48,49Joseph M. Zmuda,
50Zhongyang Zhang,
51,52Manuel Serrano-Rios,
33Ulf Smith,
53Federico Soriguer,
32,36,47Torben Hansen,
21Torben J. Jørgensen,
54,55,56Allan Linnenberg,
56,57,58Oluf Pedersen,
21Mark Walker,
59Claudia Langenberg,
29Robert A. Scott,
29Nicholas J. Wareham,
29Andreas Fritsche,
26,27,28Hans-Ulrich Häring,
26,27,28Norbert Stefan,
26,27,28Leif Groop,
24,60Jeff R. O’Connell,
22,23Michael Boehnke,
20Richard N. Bergman,
61Francis S. Collins,
62Karen L. Mohlke,
63Jaakko Tuomilehto,
64,65,66,67Winfried März,
18,68,69Peter Kovacs,
70Michael Stumvoll,
15Bruce M. Psaty,
9,10,71,72,73Johanna Kuusisto,
74Markku Laakso,
74James B. Meigs,
3,44,45Josée Dupuis,
7,75Erik Ingelsson,
76,77and Jose C. Florez
1,2,3Genome-Wide Association Study
of the Modified Stumvoll Insulin
Sensitivity Index Identifies
BCL2
and
FAM19A2
as Novel Insulin Sensitivity Loci
Diabetes 2016;65:3200–3211 | DOI: 10.2337/db16-0199
Genome-wide association studies (GWAS) have
found few common variants that in
fl
uence fasting
measures of insulin sensitivity. We hypothesized that
a GWAS of an integrated assessment of fasting and
dynamic measures of insulin sensitivity would
de-tect novel common variants. We performed a GWAS
of the modi
fi
ed Stumvoll Insulin Sensitivity Index (ISI)
within the Meta-Analyses of Glucose and Insulin-Related
1Diabetes Research Center (Diabetes Unit), Massachusetts General Hospital,
Boston, MA
2Center for Human Genetic Research, Massachusetts General Hospital, Boston, MA 3Department of Medicine, Harvard Medical School, Boston, MA
4Department of Medical Sciences, Uppsala University, Uppsala, Sweden 5Data Coordinating Center, Boston University School of Public Health, Boston, MA 6University of Eastern Finland and Kuopio University Hospital, Kuopio, Finland 7Department of Biostatistics, Boston University School of Public Health, Boston, MA 8Department of Biostatistics, Harvard T.H. Chan School of Public Health,
Bos-ton, MA
9Cardiovascular Health Research Unit, University of Washington, Seattle, WA 10Department of Medicine, University of Washington, Seattle, WA
11Department of Biostatistics, University of Washington, Seattle, WA 12Department of Biostatistics, University of Liverpool, Liverpool, U.K. 13Wellcome Trust Centre for Human Genetics, University of Oxford, Oxford, U.K. 14Estonian Genome Center, University of Tartu, Tartu, Estonia
15Department of Medicine, University of Leipzig, Leipzig, Germany
16Department of Genomics of Common Disease, Imperial College London, London, U.K. 17Oxford Centre for Diabetes, Endocrinology and Metabolism, University of Oxford,
Oxford, U.K.
18Fifth Department of Medicine, Medical Faculty Mannheim, Heidelberg University,
Heidelberg, Germany
19Division of Angiology, Department of Internal Medicine, Medical University of Graz,
Graz, Austria
Traits Consortium. Discovery for genetic association was
performed in 16,753 individuals, and replication was
attempted for the 23 most signi
fi
cant novel loci in
13,354 independent individuals. Association with ISI was
tested in models adjusted for age, sex, and BMI and in a
model analyzing the combined in
fl
uence of the
geno-type effect adjusted for BMI and the interaction effect
between the genotype and BMI on ISI (model 3).
In model 3, three variants reached genome-wide
signi-fi
cance: rs13422522 (
NYAP2
;
P
= 8.87
3
10
21 1),
rs12454712 (
BCL2
;
P
= 2.7
3
10
28), and rs10506418
(
FAM19A2
;
P
= 1.9
3
10
28). The association at
NYAP2
was eliminated by conditioning on the known
IRS1
insulin
sensitivity locus; the
BCL2
and
FAM19A2
associations
20Department of Biostatistics and Center for Statistical Genetics, University of
Michigan, Ann Arbor, MI
21The Novo Nordisk Foundation Center for Basic Metabolic Research, Faculty of
Health and Medical Sciences, University of Copenhagen, Copenhagen, Denmark
22Division of Endocrinology, Diabetes, and Nutrition, University of Maryland
School of Medicine, Baltimore, MD
23Program for Personalized and Genomic Medicine, University of Maryland School
of Medicine, Baltimore, MD
24Department of Clinical Sciences, Diabetes and Endocrinology, Lund University
Diabetes Centre, Malmö, Sweden
25Department of Immunology, Genetics and Pathology, Science for Life
Labora-tory, Uppsala University, Uppsala, Sweden
26Department of Internal Medicine, Division of Endocrinology and Diabetology, Angiology,
Nephrology, and Clinical Chemistry, University Hospital Tübingen, Tübingen, Germany
27German Center for Diabetes Research (DZD), Tübingen, Germany
28Institute for Diabetes Research and Metabolic Diseases, Helmholtz Center Munich,
University of Tübingen, Tübingen, Germany
29MRC Epidemiology Unit, University of Cambridge School of Clinical Medicine,
Cam-bridge, U.K.
30University of Exeter Medical School, Exeter, U.K.
31CIBER Pathophysiology of Obesity and Nutrition, Madrid, Spain
32Department of Endocrinology and Nutrition, Hospital Regional Universitario de Málaga,
Málaga, Spain
33Spanish Biomedical Research Centre in Diabetes and Associated Metabolic Disorders
(CIBERDEM), Instituto de Investigación Sanitaria del Hospital Clínico San Carlos (IdISSC), Madrid, Spain
34Institute for Translational Genomics and Population Sciences, Departments of
Pediat-rics and Medicine, LABioMed at Harbor-UCLA Medical Center, Torrance, CA
35Steno Diabetes Center, Gentofte, Denmark
36Instituto de Investigación Biomédica de Málaga (IBIMA), Málaga, Spain
37Sequencing and Genotyping Platform, Hospital Carlos Haya de Málaga, Málaga, Spain 38Division of Endocrinology, Diabetes and Metabolism, Cedars-Sinai Medical Center,
Los Angeles, CA
39Department of Medicine, Albert Einstein College of Medicine and Montefiore Medical
Center, Bronx, NY
40Department of Epidemiology and Population Health, Albert Einstein College of
Med-icine, Bronx, NY
41Department of Health, National Institute for Health and Welfare, Helsinki, Finland 42Minerva Foundation Institute for Medical Research, Biomedicum 2U, Helsinki, Finland 43Department of Medicine and Abdominal Center: Endocrinology, University of Helsinki
and Helsinki University Central Hospital, Helsinki, Finland
44Division of General Internal Medicine, Massachusetts General Hospital, Boston, MA 45Broad Institute of the Massachusetts Institute of Technology and Harvard
Univer-sity, Cambridge, MA
46Department of Endocrinology and Nutrition, Hospitales Regional Universitario y
Virgen de la Victoria de Málaga, Málaga, Spain
47CIBER de Diabetes y Enfermedades Metabólicas Asociadas (CIBERDEM), Madrid, Spain 48Department of Epidemiology, University of Washington, Seattle, WA
49The New York Academy of Medicine, New York, NY
50Department of Epidemiology, Graduate School of Public Health, University of Pittsburgh,
Pittsburgh, PA
51Department of Genetics and Genomic Sciences, Icahn School of Medicine at Mount
Sinai, New York, NY
52Icahn Institute for Genomics and Multiscale Biology, Icahn School of Medicine at Mount
Sinai, New York, NY
53The Lundberg Laboratory for Diabetes Research, Department of Molecular and Clinical
Medicine, Sahlgrenska Academy at the University of Gothenburg, Gothenburg, Sweden
54Department of Public Health, Faculty of Health and Medical Science, University of
Copenhagen, Copenhagen, Denmark
55Faculty of Medicine, Aalborg University, Aalborg, Denmark
56Research Center for Prevention and Health, The Capital Region of Denmark,
Co-penhagen, Denmark
57Department of Clinical Experimental Research, Rigshospitalet, Glostrup, Denmark 58Department of Clinical Medicine, Faculty of Health and Medical Science, University of
Copenhagen, Copenhagen, Denmark
59Institute of Cellular Medicine, Newcastle University, Newcastle upon Tyne, U.K. 60Finnish Institute for Molecular Medicine, University of Helsinki, Helsinki, Finland 61Diabetes and Obesity Research Institute, Cedars-Sinai Medical Center, Los
Angeles, CA
62Medical Genomics and Metabolic Genetics Branch, National Human Genome
Research Institute, National Institutes of Health, Bethesda, MD
63Department of Genetics, University of North Carolina, Chapel Hill, NC 64Chronic Disease Prevention Unit, National Institute for Health and Welfare,
Helsinki, Finland
65Centre for Vascular Prevention, Danube-University Krems, Krems, Austria 66Diabetes Research Group, King Abdulaziz University, Jeddah, Saudi Arabia 67Dasman Diabetes Institute, Dasman, Kuwait
68Clinical Institute of Medical and Chemical Laboratory Diagnostics, Medical
University of Graz, Graz, Austria
69Synlab Academy, Synlab Services GmbH, Mannheim and Augsburg,
Germany
70Integrated Research and Treatment (IFB) Center AdiposityDiseases,
Univer-sity of Leipzig, Leipzig, Germany
71Epidemiology and Health Services, University of Washington, Seattle, WA 72Group Health Research Institute, Seattle, WA
73Group Health Cooperation, Seattle, WA
74Department of Medicine, University of Eastern Finland and Kuopio University
Hospital, Kuopio, Finland
75Framingham Heart Study, National Heart, Lung, and Blood Institute,
Fra-mingham, MA
76Department of Medical Sciences, Molecular Epidemiology and Science for
Life Laboratory, Uppsala University, Uppsala, Sweden
77Department of Medicine, Division of Cardiovascular Medicine, Stanford
University School of Medicine, Stanford, CA
Corresponding author: Geoffrey A. Walford, [email protected]. Received 8 February 2016 and accepted 5 July 2016.
This article contains Supplementary Data online at http://diabetes .diabetesjournals.org/lookup/suppl/doi:10.2337/db16-0199/-/DC1. G.A.W., S.G., and D.R. contributed equally asfirst authors. E.I. and J.C.F. contributed equally as senior authors.
The content is solely the responsibility of the authors and does not necessarily represent the official views of the National Institutes of Health.
were independent of known cardiometabolic loci. In
con-clusion, we identi
fi
ed two novel loci and replicated known
variants associated with insulin sensitivity. Further
stud-ies are needed to clarify the causal variant and function at
the
BCL2
and
FAM19A2
loci.
Genome-wide association studies (GWAS) have identi
fi
ed
common genetic variants associated with type 2 diabetes
(1), a disease marked by a reduction in
b
-cell function and
insulin sensitivity (2). While both
b
-cell function and
in-sulin sensitivity traits are partly heritable, GWAS have
demonstrated relatively few single nucleotide
polymor-phisms (SNPs) associated with insulin sensitivity (3).
Traits used to estimate insulin sensitivity from fasting
measurements in prior large GWAS, including fasting
insulin and the HOMA
–
insulin resistance (HOMA-IR),
demonstrate approximately half the heritability of traits
that incorporate both fasting and dynamic assessments of
insulin sensitivity following a glucose load (4).
More-over, there is only modest genetic correlation between
HOMA-IR and measures of insulin sensitivity by
euglyce-mic clamp, which is considered the gold standard measure
of peripheral insulin sensitivity (5,6). Thus, an alternative
approach to discover new common genetic variants
asso-ciated with insulin sensitivity is to perform GWAS using a
dynamic measure of whole-body insulin sensitivity. As an
example, a recent GWAS identi
fi
ed a novel insulin
sen-sitivity locus at
NAT2
using euglycemic clamp and insulin
suppression test techniques in 2,764 subjects, with
repli-cation in another 2,860 individuals (7). However, these
direct, whole-body measures of insulin sensitivity are
time- and resource-intensive interventions, which limits
the feasible sample size of such experiments. Indices
de-rived from an oral glucose tolerance test that integrate
fasting and dynamic measures of insulin sensitivity
rea-sonably approximate euglycemic clamp measures and can
be applied in existing large cohorts with glycemic traits,
potentially increasing the statistical power to detect novel
variant associations.
We tested the hypothesis that a well-powered GWAS
would detect common genetic variants for the modi
fi
ed
Stumvoll Insulin Sensitivity Index (ISI). Insulin sensitivity
assessed by the euglycemic-hyperinsulinemic clamp
(aver-age glucose infusion rate/aver(aver-age plasma insulin
concen-tration [M/I]) has a stronger correlation with the ISI than
with HOMA-IR (
r
= 0.79 vs. 0.59, respectively) (8). In
ad-dition, the ISI is well correlated (
r
= 0.69) with M/I, even
when calculated using only fasting insulin values and
glu-cose and insulin values 120 min after a 75-g oral gluglu-cose
load (9); this modi
fi
ed version is widely available in existing
cohorts, providing a larger sample size for association
anal-yses than the sample size that would be available if indices
requiring additional time points were used. We further
hypothesized that a subset of these common genetic
var-iants would in
fl
uence the ISI independently or through
their effect on BMI. Thus we tested the association of
the modi
fi
ed ISI in statistical models without adjusting
for BMI, in statistical models adjusting for BMI, and in a
validated model (10,11) analyzing the combined in
fl
uence
of the genotype effect adjusted for BMI and the interaction
effect between the genotype and BMI on ISI.
RESEARCH DESIGN AND METHODS
Cohort Descriptions
The cohorts participating in the Meta-Analyses of Glucose
and Insulin-related Traits Consortium (MAGIC)
contrib-uted a total of 30,107 individuals to the analyses. Detailed
information on the study cohorts and methods is provided in
Supplementary Table 1. All participants were of white
Euro-pean ancestry from the United States or Europe and did not
have diabetes. All studies were approved by local research
ethic committees, and all participants gave informed consent.
Modi
fi
ed Stumvoll ISI
Missing trait data were not imputed, and outliers were
not excluded from analyses. The ISI was calculated as
previously described (9), according to the following formula:
0
:
156
2
0
:
0000459
3
insulin
2h½pmol=L2
ð0
:
000321
3
insulin
fasting½pmol=L2
ð0
:
0054
3
glucose
2h½mmol=LDiscovery Effort: GWAS
Cohorts that were able to contribute genome-wide
geno-typing results during the course of the project were
in-cluded in the discovery effort. These were the Framingham
Heart Study (FHS), Sorbs, the Finland
–
United States
Investigation of NIDDM (FUSION), the Cardiovascular
Health Study (CHS), Ludwigshafen Risk and Cardiovascular
Health (LURIC) study, the Uppsala Longitudinal Study of
Adult Men (ULSAM), and Metabolic Syndrome in Men
(METSIM) study. For the discovery GWAS, all samples
with call rates
,
95% were excluded, and SNPs departing
from Hardy-Weinberg equilibrium (at
P
,
10
26), genotype
rate
,
95%, or minor allele frequency
,
1% were excluded.
Poorly imputed SNPs were excluded if
R
2,
0.3 or
proper-info was
,
0.4.
cohorts, effect estimates were normalized to the SD of
the ISI in each cohort (Supplementary Table 1). A
ro-bust estimate of the standard error was calculated in
the interaction analysis using ProbAbel, QUICKtest, or
generalized estimating equations using the R geepack
package. An inverse-variance meta-analysis using METAL
was performed on the
b
coef
fi
cient/SD from each
cohort.
Following meta-analysis, SNPs with total sample size
less than 8,500 (approximately half of the maximum
sample size) or with heterogeneity
P
values
#
10
26(a
value chosen to take into account multiple hypothesis
testing but below the level of strict Bonferroni correction)
in the meta-analysis of the discovery cohorts were
re-moved. Genomic correction of cohort-speci
fi
c association
statistics (i.e., correction for each individual study) was
performed. In total, up to 2.4 million SNPs were
meta-analyzed for association with ISI in the discovery effort.
Selection of SNPs for Replication
Candidate SNPs for replication were identi
fi
ed by their
association
P
value
#
10
27in one or more of the analysis
models. For gene loci with multiple replication candidates,
the SNP with the lowest
P
value and any other SNP in low
linkage disequilibrium (LD;
r
2,
0.5) with the index SNP
in Europeans were retained. Using these
fi
lters, 23 unique
candidate SNPs from 23 loci were identi
fi
ed for
replica-tion. The SNP Annotation and Proxy Search site was used
to
fi
nd up to three proxies in high LD (
r
2.
0.8) in
Europeans for each candidate SNP.
Replication Effort
Cohorts that did not contribute to the discovery effort
but were able to contribute association results during
the course of the project were included in the replication
effort. These were the European Network on Functional
Genomics of Type 2 Diabetes (EUGENE2) study, Amish
Studies, the Relationship between Insulin Sensitivity and
Cardiovascular Risk Study (RISC), the Tübingen Family
Study for Type 2 Diabetes (Tübingen), Inter99 Study, the
Segovia Study, the Pizarra Study, the Botnia Study, the
1936 Birth Cohort, and the Ely Study. Genotype data
were obtained using in silico data from preexisting GWAS
or de novo genotyping. In replication cohorts, SNPs with a
minor allele count (MAC)
,
20 were excluded. Additional
details of the replication cohort effort are provided in
Sup-plementary Table 1.
Combined Meta-analysis
We required the absence of heterogeneity in the combined
analysis of discovery and replication cohorts (
P
.
10
26) as
well as nominal signi
fi
cance (
P
,
0.05) in the replication
effort and genome-wide signi
fi
cance (
P
,
5
3
10
28) in the
combined meta-analysis for statistical evidence of association
between a novel SNP and the ISI. To assess the effect of
removing lower-frequency SNPs in model 3, a sensitivity
anal-ysis was performed using the MAC
,
20
fi
lter on a
cohort-wise basis in both the discovery and replication cohorts.
Assessment for Association of Known Insulin
Sensitivity Loci With ISI
The associations of published insulin sensitivity loci were
tested for association with the ISI in the discovery cohorts.
Loci associated with fasting insulin without (12) and with
adjustment for BMI (3,12), with fasting insulin using the
approach in model 3 (10), and with direct measures of
in-sulin sensitivity were included in these analyses (7). The
published results for associations with fasting insulin with
or without BMI adjustment (
N
=
;
50,000
–
100,000) (3,12)
or exploiting potential BMI-by-gene interaction (model 3;
N
=
;
80,000) (10) used the same statistical approach as
in the current study but were derived in a sample size
ap-proximately three to six times larger than that of the
cur-rent study discovery cohort (
N
=
;
16,000). The sample
sizes of the published fasting insulin analyses were much
greater because only fasting insulin and BMI phenotypes
were required for cohort participation. To analyze the
as-sociation with fasting insulin and ISI in a comparable
sam-ple, we also examined the subset of discovery cohorts that
contributed to the current assessment of ISI and prior
assessments of fasting insulin: FHS, Sorbs, FUSION,
and CHS. In models 2 and 3, only data from FHS, Sorbs,
and FUSION were analyzed because participant-level BMI
data were not available in CHS. A binomial sign test was
used to determine whether the expected direction of the
effect for these published loci with ISI occurred more
often than by chance.
Conditional Analyses and Assessment of the
Association of Top Findings With Direct Measures
of Insulin Sensitivity
Approximate conditional analyses were performed to
understand whether known loci contributed to the
associ-ations of novel
fi
ndings with the ISI (14). These analyses
were based on the summary-level statistics from the
meta-analysis and the estimated LD using individual-level
geno-type data from the FHS discovery cohort. The software
implementation for this approach does not incorporate
the interaction term from model 3, and therefore
condi-tional analyses were not performed in model 3.
RESULTS
The demographic characteristics of the participants
in-cluded in the discovery and replication efforts are
pre-sented in Table 1. In total, the discovery, replication, and
combined meta-analyses included up to 16,753, 13,354,
and 30,107 participants, respectively.
Using a variance component approach implemented in
SOLAR software (15), the heritability of the ISI (H2r
6
SE)
in related FHS participants (
n
= 2,833) was very similar
without or with adjustment for BMI (34.6
6
6.8%;
P
=
2.8
3
10
28and 33.4
6
6.8%;
P
= 1.0
3
10
26, respectively).
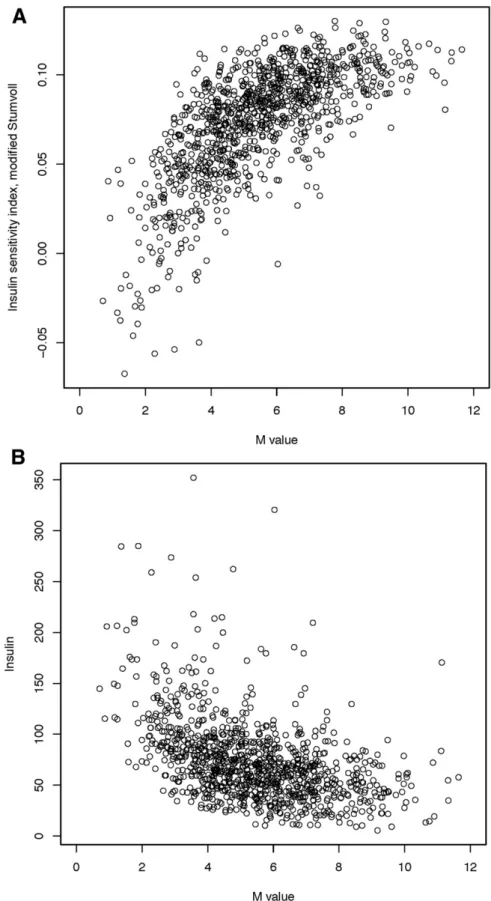
Within the ULSAM discovery cohort, the Spearman
corre-lation between the ISI and M value from the
euglycemic-hyperinsulinemic clamp was 0.71 (Fig. 1), consistent with
reports from the literature (9); the Spearman correlation
between ISI and fasting insulin was
2
0.49 (Fig. 1).
When tested in the full discovery cohort, 12 of 13 loci
previously associated with fasting insulin in the literature
(12) (
P
= 0.002 for binomial sign test) and 13 of 15 loci
previously associated with fasting insulin after adjusting
for BMI in the literature (3,12) (
P
= 0.004 for binomial
sign test) showed the expected direction of effect with
the ISI in the discovery cohorts (Supplementary Table 2).
When these associations were examined in a subset of the
current study discovery cohort (Supplementary Table 2),
statistical signi
fi
cance was reduced, but effects at each
loci remained in the expected direction (10 of 13 loci for
ISI vs. fasting insulin without BMI adjustment,
P
= 0.03 for
binomial sign test; 11 of 15 loci for ISI vs. fasting insulin
with BMI adjustment,
P
= 0.04 for binomial sign test).
Using a variant in LD with rs1208 (rs7815686;
r
2=
0.67), we also found the expected direction of effect with
ISI in the discovery cohorts (
n
= 16,753) at the
NAT2
locus
(model 1;
b
=
2
0.029;
P
= 9
3
10
23) (7).
The QQ plots for models 1, 2, and 3 are shown in
Sup-plementary Figs. 1
–
3, respectively. Measures of genomic
control were consistent with low in
fl
ation (model 1
l
GC=
1.015; model 2
l
GC= 1.006; model 3
l
GC= 1.079). While
genomic control was used to correct for each individual
study, no additional corrections were applied to the
meta-analysis results. The separate results of the discovery and
replication results for model 1 (adjusting for age and sex),
model 2 (adjusting for age, sex, and BMI), and model
3 (adjusting for age, sex, and BMI and analyzing the
com-bined in
fl
uence of the genotype effect adjusted for BMI
and1the interaction effect between the genotype and BMI
on ISI) are shown in Supplementary Table 3. Four SNPs
selected from the discovery effort reached nominal
signif-icance (
P
,
0.05) in the replication analyses: rs13422522
(
NYAP2
) in models 1, 2, and 3; rs12454712 (
BCL2
) in
mod-els 2 and 3; rs10506418 (
FAM19A2
) in model 3; and
rs6013915 (
PFDN4
) in model 3. Although the association
with rs4548846 (
CDH13
) reached nominal signi
fi
cance in
the replication effort for model 3, the association was in the
opposite direction of effect, as in the discovery analyses;
consequently, the association of this variant also had high
heterogeneity in the combined meta-analysis.
We compared the
b
coef
fi
cients for the 22 SNPs
iden-ti
fi
ed in the discovery effort (rs4548846 [
CDH13
] was
excluded given its high heterogeneity) with fasting
in-sulin and ISI in a subset of the discovery cohort. Pearson
correlations between the
b
for fasting insulin and the
b
for ISI were
2
0.494 in model 1,
2
0.797 in model 2,
and
2
0.461 (for SNP effect) and
2
0482 (for interaction)
in model 3.
The results of the combined discovery and replication
cohort meta-analyses in each of the three models are shown
in Table 2 and Supplementary Table 3. No association
reached genome-wide signi
fi
cance in model 1. In model 2,
rs13422522 (
NYAP2
;
P
= 1.8
3
10
211) and rs12454712
(
BCL2
;
P
= 1.9
3
10
28) achieved genome-wide signi
fi
cance.
In model 3, rs13422522 (
NYAP2
;
P
= 8.9
3
10
211),
rs12454712 (
BCL2
;
P
= 2.7
3
10
28), and rs10506418
(
FAM19A2
;
P
= 1.9
3
10
28) reached genome-wide signi
fi
-cance. In model 3, rs6027072 (
ARHGAP40
;
P
= 4.4
3
10
29)
also reached genome-wide signi
fi
cance but did not achieve
nominal signi
fi
cance in the replication cohort, and
rs6013915 (
PFND4
) had high heterogeneity in the
com-bined meta-analysis of discovery and replication cohorts
(
P
for heterogeneity = 6.03
3
10
27); therefore associations
with these SNPs were not included as trustworthy
fi
ndings.
Hence, rs13422522 (
NYAP2
), rs12454712 (
BCL2
), and
rs10506418 (
FAM19A2
) were the three SNPs that reached
our a priori requirements for claiming statistical evidence.
The association at rs13422522 (
NYAP2
) was in LD (
r
2=
0.7) with previously reported results at the known insulin
sensitivity signal rs2943641 (
IRS1
) (10), and the
associa-tion with the ISI in model 2 was greatly reduced by
con-ditioning rs13422522 on rs2943641 in the discovery cohort
(
b
=
2
0.066
6
0.01;
P
= 4.29
3
10
28to
b
=
2
0.025
6
0.01;
P
= 0.01). Thus, this SNP was considered a re
fl
ection
of the known
IRS1
signal and not an independent signal.
The associations for rs12454712 (
BCL2
) and rs10506418
(
FAM19A2
) with the ISI were consistent across the
discov-ery and replication cohorts (Supplementary Figs. 4 and 5,
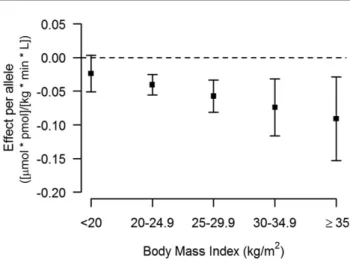
respectively). When stratifying by BMI, the effect of the
minor allele (A) at rs10506418 (
FAM19A2
) on insulin
sen-sitivity was negative at lower BMI and became positive and
stronger with increasing BMI (Fig. 2), and the effect of the
major allele (T) at rs12454712 (
BCL2
) on ISI was more
negative with increasing BMI (Fig. 3).
Figure 1—Correlation of ISI with the M value from the insulin clamp (A) and fasting insulin (B) in ULSAM. Insulin sensitivity was measured
within the ULSAM discovery cohort (n= 1,025) using a hyperinsulinemic-euglycemic clamp (M value), the modified Stumvoll ISI, and fasting
insulin. The ULSAM cohort contains only men, and individuals with known diabetes were excluded from these analyses. For the compar-ison of the M value with ISI, the Pearson correlation was 0.69 and the Spearman correlation was 0.71, which are consistent with prior
published reports. For the comparison of the ISI with fasting insulin, the Pearson correlation was20.45 and the Spearman correlation
to arise from population strati
fi
cation. We performed an
additional sensitivity analysis that applied the MAC
,
20
fi
lter to both the discovery and replication cohorts
(Supplementary Table 4), which tended to reduce the
sta-tistical signi
fi
cance of associations with high
heterogene-ity and slightly reduced the statistical signi
fi
cance of the
association at the
FAM19A2
locus in model 3 without
markedly reducing the magnitude of effect or affecting
heterogeneity (
b
=
2
0.62
6
0.13;
P
= 1.9
3
10
28;
P
for
heterogeneity = 0.11 to
b
=
2
0.58
6
0.13;
P
= 8.0
3
10
27;
P
for heterogeneity = 0.07). The sample size for the
FAM19A2
locus association in model 3 was 462 individuals
fewer when the MAC
fi
lter was applied in the discovery
cohorts versus when the minor allele frequency
fi
lter was
applied, and the resulting loss in power was likely
respon-sible for the slight reduction in statistical signi
fi
cance.
Conditioning the results at either variant with known
signals at least 1 Mb away did not attenuate the
as-sociation with the ISI in the discovery cohorts of model 2
(a full description is provided in Supplementary Table 5).
The rs10506418 (
FAM19A2
) variant was not associated
with fasting insulin using model 3 in a separate GWAS
result (10) or with direct measures of insulin sensitivity
in GENESIS. The major allele (T) of rs12454712 (
BCL2
),
which was associated with lower insulin sensitivity in this
study, was also associated with a trend toward higher
fasting insulin in a separate GWAS result using model
3 (SNP effect
2
0.006
6
0.003; interaction effect 0.001
6
0.001;
P
= 5.9
3
10
25;
N
= 38,649) (10). Similar trends
were observed when the variant was tested for association
with ISI and fasting insulin in the same discovery cohort
subset (Supplementary Table 5).
DISCUSSION
In a study of over 30,000 participants, we found novel,
independent, genome-wide signi
fi
cant associations for the
ISI at rs12454712 (
BCL2
) and rs10506418 (
FAM19A2
).
Strengths of this study
’
s design include a large sample
size, individuals with glycemic and metabolic
phenotyp-ing, high-quality genomic data, and use of traditional and
contemporary statistical models to account for the in
fl
uence
of BMI on insulin sensitivity. In addition, our approach
targeted a phenotype not previously examined in GWAS:
the modi
fi
ed Stumvoll ISI. By incorporating glucose and
insulin measures before and after a glucose load, this
phe-notype captures information that fasting assessments such
as HOMA-IR or insulin alone would not. Indeed, the
cor-relation between ISI and the M value is higher than that
between the M value and fasting insulin (16), which has
been used in prior genetic studies of insulin sensitivity
(10,12). At the same time, the use of measures obtained
at only two time points (fasting and 120 min into an oral
glucose tolerance test) permitted the assembly of the large
sample size required to achieve adequate statistical power.
Several
fi
ndings serve as positive controls for our
results and demonstrate that the ISI is a robust measure
of fasting and whole-body insulin sensitivity. First, we
observe a strong correlation of ISI with direct measures
of insulin sensitivity. Second, we show that the ISI can
detect genetic in
fl
uences on measures of fasting insulin
sensitivity (3,10,12), generally ascribed to hepatic
physi-ology, as well as on measures of whole-body insulin
sen-sitivity, which also incorporates contributions from
muscle and adipose tissue. Integrated measures of insulin
sensitivity may have clinical relevance, since a reduction
in peripheral insulin sensitivity may be an early
contrib-utor to the development of type 2 diabetes (17
–
19).
Consistent with prior genetic explorations of insulin
sensitivity (10), the association of variants at the
BCL2
and
FAM19A2
loci became stronger and genome-wide
sig-ni
fi
cant after accounting for the effect of BMI on ISI.
Notably, the ISI can be calculated with or without BMI
in the formula, and the correlation of the ISI with M/I is
Figure 2—The effect of rs10506418 (FAM19A2) on insulinsensitiv-ity by BMI category. The effect of the minor allele (A) at rs10506418
(FAM19A2) on the ISI is shown by BMI category. At a low BMI
(<20 kg/m2), the effect is negative. At each category of increasing
BMI above 20 kg/m2, the effect is positive and stronger.
Figure 3—The effect of rs10506418 (BCL2) on insulin sensitivity by BMI category. The effect of the major allele (T) at rs10506418
(BCL2) on the ISI is shown by BMI category. At each category of
greater when BMI is included (
r
= 0.69 vs. 0.79) (8,9). We note
that the effect of these loci on insulin sensitivity is modest,
consistent with published
fi
ndings on other common genetic
variants for glycemic traits, such as glucose (12) and fasting
insulin (3,10,12). Yet our
fi
ndings are meaningful because
they provide a more complete understanding of the
contri-bution of common genetic variations to insulin sensitivity.
The existing literature bolsters our
fi
nding of
BCL2
as
a novel candidate insulin sensitivity locus. The major allele
(T) at rs12454712, which was associated with lower
in-sulin sensitivity in our analysis, has been previously
asso-ciated with type 2 diabetes in a multiethnic GWAS (odds
ratio 1.09 [95% CI 1.05
–
1.11];
P
= 2.1
3
10
28) (20) in
analyses adjusted for BMI. Further, this same variant was
recently associated with higher BMI-adjusted waist-to-hip
ratio in women (
b
= 0.035;
P
= 1.1
3
10
29;
N
= 96,182)
but not in men (
b
= 0.007;
P
= 0.25;
N
= 73,576) (21). All
these
fi
ndings suggest that the metabolically deleterious
effects of the
BCL2
locus become more evident after
adjust-ing for BMI. Last, we
fi
nd that the statistical association of
rs12454712 (
BCL2
) is stronger with the ISI than with
fast-ing insulin (10). Notably, the published fastfast-ing insulin
re-sults were from a study much larger than ours. The ability
of the ISI to detect a genome-wide signi
fi
cant
fi
nding in a
smaller sample suggests that the
BCL2
locus may have a
greater in
fl
uence on insulin sensitivity when fasting and
postprandial phenotypes are assessed together.
The mechanism by which
BCL2
in
fl
uences insulin
sensi-tivity remains unclear. The
BCL2
family of proteins regulate
apoptosis through control of mitochondrial permeability
(22). Mouse models suggest that inhibiting
Bcl2
improves
glucose tolerance through effects on pancreatic
b
-cells (23).
Conversely, pharmacological inhibition of the BCL2
pro-tein causes hyperglycemia among a subset of patients with
chronic lymphocytic leukemia (24), but the mechanism of
this observation is unknown. By contrast, there is little direct
published literature to support the role of FAM19A2 in
in-sulin sensitivity. We found that the association of the minor
allele (A) at the FAM19A2 locus with reduced insulin
sensi-tivity was detected at BMI
,
30 kg/m
2. This may suggest the
variant is more deleterious among individuals with lower
levels of adiposity. While
BCL2
and
FAM19A2
are the closest
genes to rs12454712 and rs10506418, respectively, we
have not excluded other genes in the region
(Supplemen-tary Figs. 6 and 7). Additional in silico
fi
ndings at the
BCL2
and
FAM19A2
variants are provided in
Supplemen-tary Table 5.
We recognize limitations to our study. First,
anal-yses were performed exclusively in white individuals
of European ancestry. Exploring these loci in other racial
and ethnic groups is necessary. Second, we used an
es-timate of whole-body insulin sensitivity derived from
measures of glucose and insulin after a glucose load,
rather than direct measures of insulin sensitivity. The
wide availability of the ISI provided increased statistical
power of the association analyses relative to that of other
indices that are better correlated with euglycemic measures
of insulin sensitivity, such as the Matsuda Index (25).
As-sessment of our novel
fi
ndings in the GENESIS consortium
suggests that the ISI may be capturing different
informa-tion on insulin sensitivity than that provided by the insulin
clamp or the insulin suppression test, or that the power in
the GENESIS analyses was limited to detect this
associa-tion. Third, conditional analyses could not be performed in
model 3, which would have been the best method of
assess-ing the dependence of the signals at
BCL2
and
FAM19A2
.
However, the LD for each variant with other known
glu-cose and insulin loci in the region was low, and the
nom-inally signi
fi
cant associations of the
BCL2
and
FAM19A2
variants with ISI were stable after conditioning in model
2, suggesting that analyses in model 3 would have
prob-ably con
fi
rmed secondary loci. Fourth, given our desire for
the early dissemination of these results, no experimental
attempts at determining the causal gene and mechanisms
of action in our novel candidate insulin sensitivity loci
were performed.
In conclusion, we identi
fi
ed two novel candidate
insulin sensitivity loci through a GWAS of the modi
fi
ed
Stumvoll ISI. Our results demonstrate that the ISI is a
robust measure of fasting and whole-body measures of
insulin sensitivity and suggest that genetic variation in
the
FAM19A2
and
BCL2
loci in
fl
uence insulin
sensitiv-ity. While further functional work is needed to clarify
the causal genes and mechanisms of action of these loci,
our work and the published literature provide support
for genes in these loci having an effect on human glycemic
metabolism.
Acknowledgments.
The authors thank all the participants of each cohortfor their cooperation and contribution to this study. For FHS, this research was conducted in part using data and resources from the FHS of the National Heart Lung, and Blood Institute of the National Institutes of Health and Boston University School of Medicine; the analyses reflect intellectual input and resource development from the FHS investigators participating in the SNP Health Association Resource (SHARe) project. A full list of principal CHS investigators and institutions can be found at chs-nhlbi.org. For ULSAM, the authors thank the SNP&SEQ Technology Platform in Uppsala (www.genotyping.se) for excellent genotyping. Computations were performed on resources provided by SNIC through Uppsala Multidisciplinary Center for Advanced Computational Science (UPPMAX) under Project b2011036. For Sorbs, the authors thank Knut Krohn (Microarray Core Facility, Institute of Pharmacology, University of Leipzig) for genotyping support and Joachim Thiery (Institute of Laboratory Medicine, Clinical Chemistry and Molecular Diagnostics, University of Leipzig) for clinical chemistry services. For LURIC, the authors thank the LURIC study team members who are either temporarily or permanently involved in patient recruitment and sample and data handling. Furthermore, the authors thank the laboratory staff at the Ludwigshafen General Hospital and the Universities of Freiburg, Ulm, and Graz. For Amish Studies, the authors gratefully thank their Amish community and research volunteers for their long-standing partnership in research, and they acknowledge the dedication of their Amish liaisons,field workers, and the Amish Research Clinic staff, without whom these studies would not have been possible. For the Ely Study, the authors are grateful to the staff of St. Mary’s Surgery, Ely, U.K., and the study team.
Funding.
This work was supported by National Institutes of Health grantstudy was funded by the Academy of Finland (grants 77299 and 124243). For Sorbs, the work was supported by grants from the German Research Council (DFG-SFB 1052,“Obesity mechanisms,” A01, C01, B03, and SPP 1629 TO 718/2-1), the German Diabetes Association, and the Diabetes Hilfs- und Forschungsfonds Deutschland (DHFD). This work was further supported by the Federal Ministry of Education and Research (BMBF), Germany, FKZ (01EO1501, AD2-060E to P.K.), and by the Boehringer Ingelheim Foundation. For FHS, the study was supported by the National Heart, Lung, and Blood Institute (contract nos. N02-HL-6-4278 [supporting its contract with Affymetrix, Inc., for genotyping services], N01-HC-25195, HL084756, and HHSN268201500001I) and the National Institute of Diabetes and Digestive and Kidney Diseases (R01 DK078616 to J.D., U01-DK085526 to H.C. and J.D., 2R01 DK078616 and K24 DK080140 to J.M.). A portion of this research utilized the Linux Cluster for Genetic Analysis (LinGA‐II) funded by the Robert Dawson Evans Endowment of the Department of Medicine at Boston University School of Medicine and Boston Medical Center. A.K.M. was supported by American Diabetes Association Research Foundation (grant 7-12-MN-02). For CHS, research was supported by National Heart, Lung, and Blood Institute contract nos. HHSN268201200036C, HHSN268200800007C, N01HC55222, N01HC85079, N01HC85080, N01HC85081, N01HC85082, N01HC85083, and N01HC85086 and grant nos. U01HL080295, HL105756, and HL120393, with additional contri-bution from the National Institute of Neurological Disorders and Stroke. Additional support was provided by R01AG023629 from the National Institute on Aging (NIA). For ULSAM, the project was supported by the Knut and Alice Wallenberg Foundation (Wallenberg Academy Fellow), the European Research Council (ERC Starting Grant), the Swedish Diabetes Foundation (grant 2013-024), the Swedish Research Council (grant 2012-1397), and the Swedish Heart-Lung Foundation (20120197). A.P.M. is a Wellcome Trust Senior Fellow in Basic Biomedical Science (grant WT098017 from the Nordic Center of Excellence in Disease Genetics). For LURIC, the study was supported by the 7th Framework Program (AtheroRemo, grant agreement no. 201668, and RiskyCAD, grant agreement no. 305739) of the European Union and by the INTERREG-IV-Oberrhein-Program (Project A28, Genetic mechanisms of car-diovascular diseases) with support from the European Regional Development Fund (ERDF) and the Wissenschaftsoffensive. M.E.K. and W.M. are supported by the German Federal Ministry of Education and Research as part of the Competence Cluster of Nutrition and Cardiovascular Health (nutriCARD). For Inter99, the study wasfinancially supported by research grants from the Danish Research Council, the Danish Centre for Health Technology Assessment, Novo Nordisk, the Research Foundation of Copenhagen County, Ministry of Internal Affairs and Health of Denmark, the Danish Heart Foundation, the Danish Pharmaceutical Association, the Augustinus Foundation, the Ib Henriksen Foundation, the Becket Foundation, and the Danish Diabetes Association. For FUSION, the study was supported by the National Institute of Diabetes and Digestive and Kidney Diseases (DK093757, DK072193, DK062370) and the National Human Genome Research Institute (ZIA-HG000024). H.A.K. has received funding from the Academy of Finland (support for clinical research careers, grant no. 258753). Work on the Amish Studies was supported by National Institutes of Health awards K23GM102678 (from National Institute of General Medical Sciences) to J.P.L. and HL084756 (from National Heart, Lung, and Blood Institute) to J.R.O. The Botnia study has beenfinancially supported by grants from the Sigrid Juselius Foundation, the Folkhälsan Research Foundation, the Nordic Center of Excellence in Disease Genetics, a European Union grant (EXGENESIS, GA FP6 2004-005272), the Signe and Ane Gyllenberg Foundation, the Swedish Cultural Foundation in Finland, the Finnish Diabetes Research Foundation, the Foundation for Life and Health in Finland, the Finnish Medical Society, the Paavo Nurmi Foundation, the Helsinki University Central Hospital Research Foundation, the Perklén Foundation, the Ollqvist Foundation, the Närpes Health Care Foundation, and the Ahokas Foundation. The DGI study was further supported by a Swedish Research Council Linné grant (2006-237) and by the Ministry of Education in Finland, the Municipal Health Care Center and Hospital in Jakobstad, and the Health Care Centers in Vasa, Närpes, and Korsholm. The Tübingen study was supported in part by a grant from the German Federal Ministry of Education and Research to the German Center for Diabetes Research (DZD e.V.). For the Ely Study, J.L., C.Lang, R.A.S., and N.J.W. acknowledge support from the Medical
Research Council (MC_UU_12015/1). The Ely Study was funded by the Medical Research Council (MC_U106179471) and Diabetes UK. Genotyping in the Ely and Fenland studies was supported in part by a Medical Research Council– GlaxoSmithKline pilot program grant (G0701863). For the Birth Cohort 1936 and Inter99 studies, work was support by the Novo Nordisk Foundation Center for Basic Metabolic Research, an independent research center at the University of Copenha-gen partially funded by an unrestricted donation from the Novo Nordisk Foundation (www.metabol.ku.dk). Work on the Pizarra study was support by Instituto de Salud Carlos III PI11/00880 and Instituto de Salud Carlos III PS09/02117. For Segovia, this work was supported by the Fondo Europeo para el Desarrollo Regional, Red de Centros RCMN (C03/08) grants FEDER 2FD 1997/2309, the Instituto de Salud Carlos III-RETIC RD06/0015/0012, Madrid, Spain (FIS 03/1618); CIBER in Di-abetes and Associated Metabolic Disorders (Instituto de Salud Carlos III, Minis-terio de Ciencia e Innovación); and the Madrid Autonomous Community (MOIR S2010/BMD-2423), and by educational grants from Eli Lilly Lab, Spain; Bayer Pharmaceutical Co., Spain; and the Fundación Mutua Madrileña 2008, Spain.
Duality of Interest.
M.E.K. (LURIC) has received lecture fees fromAstraZeneca. G.S. (LURIC) is member of an Amgen advisory board (Thousand Oaks, CA). W.M. (LURIC) is employed by Synlab Services GmbH and holds shares of Synlab Holding GmbH. He has received grants from Siemens Diagnostics, Aegerion Pharmaceuticals, Amgen, AstraZeneca, Danone, Sanofi /-Genzyme, Pfizer, BASF, and Abbott Diagnostics. B.M.P. (CHS) serves on the data safety and monitoring board of a clinical trial funded by the manufacturer (Zoll LifeCor Corp.) and the Yale Open Data Access Project Steering Committee funded by Johnson & Johnson. No other potential conflicts of interest relevant to this article were reported.
Author Contributions.
G.A.W. (Massachusetts General Hospital [MGH])References
1. Morris AP, Voight BF, Teslovich TM, et al.; Wellcome Trust Case Control Con-sortium; Meta-Analyses of Glucose and Insulin-related traits Consortium (MAGIC) In-vestigators; Genetic Investigation of ANthropometric Traits (GIANT) Consortium; Asian Genetic Epidemiology Network–Type 2 Diabetes (AGEN-T2D) Consor-tium; South Asian Type 2 Diabetes (SAT2D) ConsorConsor-tium; DIAbetes Genetics Replication And Meta-analysis (DIAGRAM) Consortium. Large-scale association analysis provides insights into the genetic architecture and pathophysiology of type 2 diabetes. Nat Genet 2012;44:981–990
2. Kahn SE. The relative contributions of insulin resistance and beta-cell dysfunction to the pathophysiology of type 2 diabetes. Diabetologia 2003;46: 3–19
3. Dimas AS, Lagou V, Barker A, et al.; MAGIC Investigators. Impact of type 2 diabetes susceptibility variants on quantitative glycemic traits reveals mechanistic heterogeneity. Diabetes 2014;63:2158–2171
4. Bergman RN, Zaccaro DJ, Watanabe RM, et al. Minimal model-based in-sulin sensitivity has greater heritability and a different genetic basis than ho-meostasis model assessment or fasting insulin. Diabetes 2003;52:2168–2174
5. Rasmussen-Torvik LJ, Pankow JS, Jacobs DR, et al. Heritability and genetic correlations of insulin sensitivity measured by the euglycaemic clamp. Diabet Med 2007;24:1286–1289
6. Ingelsson E, Langenberg C, Hivert MF, et al.; MAGIC investigators. Detailed physiologic characterization reveals diverse mechanisms for novel genetic Loci regulating glucose and insulin metabolism in humans. Diabetes 2010;59:1266– 1275
7. Knowles JW, Xie W, Zhang Z, et al.; RISC (Relationship between Insulin Sensitivity and Cardiovascular Disease) Consortium; EUGENE2 (European Net-work on Functional Genomics of Type 2 Diabetes) Study; GUARDIAN (Genetics UndeRlying DIAbetes in HispaNics) Consortium; SAPPHIRe (Stanford Asian and Pacific Program for Hypertension and Insulin Resistance) Study. Identification and validation of N-acetyltransferase 2 as an insulin sensitivity gene [published correction appears in J Clin Invest 2016;126:403]. J Clin Invest 2015;125:1739– 1751
8. Stumvoll M, Mitrakou A, Pimenta W, et al. Use of the oral glucose tolerance test to assess insulin release and insulin sensitivity. Diabetes Care 2000;23:295– 301
9. Stumvoll M, Van Haeften T, Fritsche A, Gerich J. Oral glucose tolerance test indexes for insulin sensitivity and secretion based on various availabilities of sampling times. Diabetes Care 2001;24:796–797
10. Manning AK, Hivert M-F, Scott RA, et al.; DIAbetes Genetics Replication And Meta-analysis (DIAGRAM) Consortium; Multiple Tissue Human Expression Re-source (MUTHER) Consortium. A genome-wide approach accounting for body mass index identifies genetic variants influencing fasting glycemic traits and insulin resistance. Nat Genet 2012;44:659–669
11. Manning AK, LaValley M, Liu CT, et al. Meta-analysis of gene-environment interaction: joint estimation of SNP and SNP3environment regression coeffi -cients. Genet Epidemiol 2011;35:11–18
12. Scott RA, Lagou V, Welch RP, et al.; DIAbetes Genetics Replication and Meta-analysis (DIAGRAM) Consortium. Large-scale association analyses identify new loci influencing glycemic traits and provide insight into the underlying bi-ological pathways. Nat Genet 2012;44:991–1005
13. Knowles JW, Assimes TL, Tsao PS, et al. Measurement of insulin-mediated glucose uptake: direct comparison of the modified insulin suppression test and the euglycemic, hyperinsulinemic clamp. Metabolism 2013;62:548–553 14. Yang J, Ferreira T, Morris AP, et al.; Genetic Investigation of Anthropometric Traits (GIANT) Consortium; DIAbetes Genetics Replication And Meta-analysis (DIAGRAM) Consortium. Conditional and joint multiple-SNP analysis of GWAS summary statistics identifies additional variants influencing complex traits. Nat Genet 2012;44:369–375, S1–3
15. Almasy L, Blangero J. Multipoint quantitative-trait linkage analysis in gen-eral pedigrees. Am J Hum Genet 1998;62:1198–1211
16. Otten J, Ahrén B, Olsson T. Surrogate measures of insulin sensitivity vs the hyperinsulinaemic-euglycaemic clamp: a meta-analysis. Diabetologia 2014;57: 1781–1788
17. Kashyap SR, Belfort R, Berria R, et al. Discordant effects of a chronic physiological increase in plasma FFA on insulin signaling in healthy subjects with or without a family history of type 2 diabetes. Am J Physiol Endocrinol Metab 2004;287:E537–E546
18. Perseghin G, Ghosh S, Gerow K, Shulman GI. Metabolic defects in lean nondiabetic offspring of NIDDM parents: a cross-sectional study. Diabetes 1997; 46:1001–1009
19. Vaag A, Henriksen JE, Beck-Nielsen H. Decreased insulin activation of glycogen synthase in skeletal muscles in young nonobese Caucasianfirst-degree relatives of patients with non-insulin-dependent diabetes mellitus. J Clin Invest 1992;89:782–788
20. Saxena R, Elbers CC, Guo Y, et al.; Look AHEAD Research Group; DIAGRAM consortium. Large-scale gene-centric meta-analysis across 39 studies identifies type 2 diabetes loci [published correction appears in Am J Hum Genet 2012;90: 753]. Am J Hum Genet 2012;90:410–425
21. Shungin D, Winkler TW, Croteau-Chonka DC, et al.; ADIPOGen Consortium; CARDIOGRAMplusC4D Consortium; CKDGen Consortium; GEFOS Consortium; GENIE Consortium; GLGC; ICBP; International Endogene Consortium; LifeLines Cohort Study; MAGIC Investigators; MuTHER Consortium; PAGE Consortium; ReproGen Consortium. New genetic loci link adipose and insulin biology to body fat distribution. Nature 2015;518:187–196
22. Brenner D, Mak TW. Mitochondrial cell death effectors. Curr Opin Cell Biol 2009;21:871–877
23. Luciani DS, White SA, Widenmaier SB, et al. Bcl-2 and Bcl-xL suppress glucose signaling in pancreaticb-cells. Diabetes 2013;62:170–182