CATION-SELECTIVE APICAL TRANSPORTERS MEDIATE AN INTESTINAL CYCLING MECHANISM OF METFORMIN THAT ENHANCES ITS
PARACELLULAR ORAL ABSORPTION IN MICE
Chester Lee Costales
A dissertation submitted to the faculty of the University of North Carolina at Chapel Hill in partial fulfillment of the requirements for the degree of Doctor of Philosophy in the
School of Pharmacy.
Chapel Hill 2013
Approved by:
ii ©2013
iii ABSTRACT
CHESTER LEE COSTALES: Cation-selective Apical Transporters Mediate an Intestinal Cycling Mechanism of Metformin that Enhances its Paracellular Oral
Absorption in Mice
(Under the direction of Dhiren R. Thakker, Ph.D.)
Metformin is the most widely prescribed drug for type 2 diabetes mellitus; yet its in vivo mechanism of oral absorption has not been elucidated. A pKa of 12.4 and
logDpH6.0 of -6.13 suggest metformin is a hydrophilic cation at all physiologic pHs,
limiting its ability to cross biological membranes. However, metformin is well-absorbed with an oral bioavailability ranging from ~40-60% in man. Previous in vitro studies conducted using the Caco-2 Transwell® model of intestinal absorption demonstrated efficient transporter-mediated metformin apical uptake and efflux and poor basolateral egress. Kinetic modeling of these results suggested absorptive transport is predominantly paracellular, and led to the development of a novel mechanism of absorption stating that during oral absorption of metformin, transporter-mediated apical uptake and a lack of basolateral efflux leads to intestinal drug accumulation. Changes in luminal drug concentration as a result of gastrointestinal transit leads to apical efflux of metformin and its enhanced paracellular absorption. Studies presented in this dissertation evaluate this novel metformin absorption mechanism in a mouse model.
iv
v
ACKNOWLEDGEMENTS
I would first like to thank my advisor, Dr. Dhiren Thakker, for all the guidance and support throughout my graduate training, and for being a steady presence in my life during what has proven to be the most eventful phase of my 30+ years. Of all the things I have learned from you, I hope that I will always remember your seemingly endless generosity.
I would also like to thank my dissertation committee, Drs. Philip Smith, John Buse, Samuel Lai, and Zhiyang Zhao for their time, support, and always helpful insights.
This dissertation work was possible through the generous support from Amgen, Inc. and the PhRMA Foundation in the form of pre-doctoral fellowships.
I would like to acknowledge the UNC Eshelman School of Pharmacy faculty and staff, especially those in MOPH and DPET Divisions. In particular, I am very grateful for those who were willing to share their laboratories and resources with me, including Drs. Moo Cho, Leaf Huang, Mary Paine, Kim Brouwer, Angela Kashuba, Craig Lee, Arlene Bridges, and Xiao Xiao. I would also like to thank past and present staff members, especially Mrs. Amber Allen, Ms. Mary Guy, Ms. Lauren Wall, and Ms. Lauren McQuillan.
vi
Chapel Hill, NC are acknowledged for their collaborations and assistance providing human intestinal tissues from patients undergoing gastric bypass surgeries.
I would like to acknowledge all of the Thakker laboratory members, past and present, who have shaped my scientific career and become great friends. In particular, Drs. Will Proctor, Claudia Generaux, and Matthew Dufek in my first years at UNC, and Dr. Ravindra Alluri and Kevin Han who were so critical to my success and shared in the struggles as we completed our studies together in the lab. I would like to especially thank Dr. Ruth Everett for being a constant supporter throughout my graduate career in countless ways.
I am thankful for all the friends I have made here with whom I have grown as a scientist. I hope that we will continue to support each other as we move on to the next phase of our careers, wherever they take us.
vii
I dedicate this to my wife, Jamie, for always encouraging me to get the most out of my graduate school experience, for supporting me and our family throughout this journey,
and for pretending to care about intestinal drug absorption.
viii
TABLE OF CONTENTS
LIST OF TABLES ... xi
LIST OF FIGURES ... xii
LIST OF ABBREVIATIONS ... xiv
1. INTRODUCTION ...1
A. INTRODUCTION ...1
B. METFORMIN PHARMACOKINETICS ...4
1. Intravenous Pharmacokinetics of Metformin ...4
2. Oral Pharmacokinetics of Metformin ...5
3. Metformin Metabolism ...5
4. Drug Transporters Involved in Metformin Disposition ...6
C. CLINICALLY OBSERVED TRANSPORTER-MEDIATED DRUG- DRUG INTERACTIONS (DDIS) WITH METFORMIN ...11
D. MECHANISMS OF INTESTINAL DRUG ABSORPTION ...13
1. Methods Used to Study Intestinal Drug Transport ...16
E. METFORMIN ABSORPTION ACROSS THE INTESTINAL EPITHELIUM ...17
1. Rationale for the Proposed Study ...17
2. Specific Aims ...21
REFERENCES ...23
ix
A. OVERVIEW ...28
B. INTRODUCTION ...30
C. METHODS ...32
D. RESULTS ...36
E. DISCUSSION ...39
F. TABLES AND FIGURES ...45
REFERENCES ...53
3. METFORMIN UPTAKE AND ACCUMULATION IN THE SMALL INTESTINE OF MOUSE IS MEDIATED BY APICALLY LOCALIZED TRANSPORTERS ...57
A. OVERVIEW ...57
B. INTRODUCTION ...60
C. METHODS ...63
D. RESULTS ...69
E. DISCUSSION ...73
F. FIGURES ...78
REFERENCES ...85
4. APICAL UPTAKE AND EFFLUX TRANSPORTERS ENHANCE THE ORAL ABSORPTION OF METFORMIN VIA THE PARACELLULAR ROUTE: PROOF OF CONCEPT FOR THE NOVEL ORAL ABSORPTION MECHANISM OF METFORMIN ...88
A. OVERVIEW ...88
B. INTRODUCTION ...90
C. METHODS ...94
x
E. DISCUSSION ...102
F. TABLES AND FIGURES ...109
REFERENCES ...119
5. CONCLUSIONS...122
xi
LIST OF TABLES
Table 1.1 Putative Transporters of Metformin ...11 Table 2.1 Uptake kinetic parameters of mouse cation-selective
transporters for metformin ...45 Table 2.2 Inhibitory potencies of organic cations for mouse
and human transporters ...46 Table 4.1 Oral and intravenous pharmacokinetic parameters of metformin ...109 Table 4.2 Portal and systemic exposure of metformin with or without
xii
LIST OF FIGURES
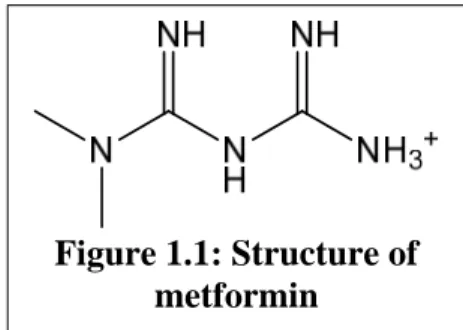
Figure 1.1 Structure of metformin ...1
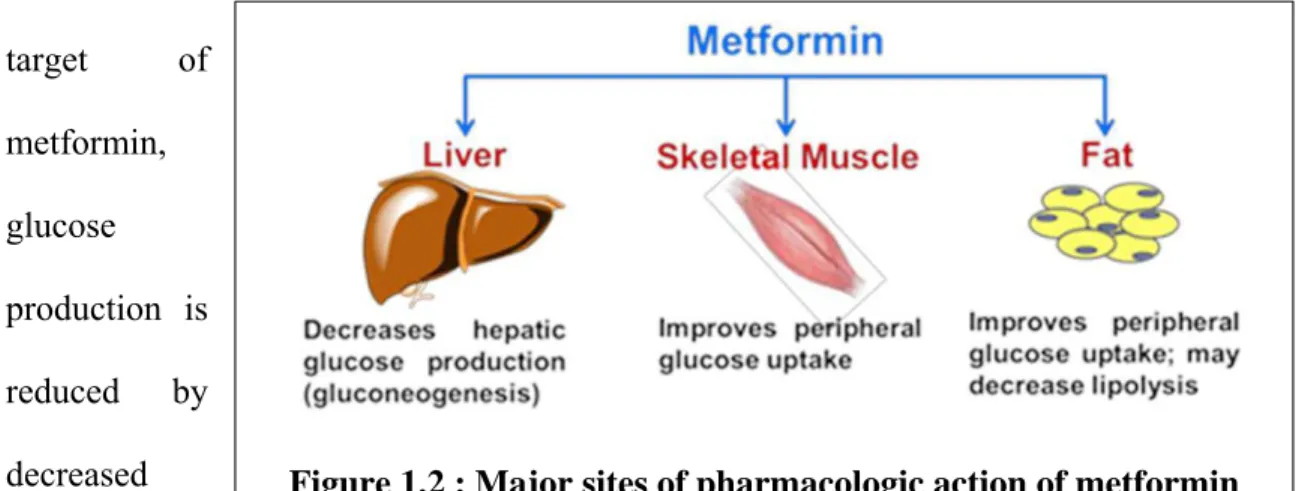
Figure 1.2 Major sites of pharmacologic action of metformin ...2
Figure 1.3 Transporters involved in the disposition of metformin ...7
Figure 1.4 Drug transport mechanisms across the intestinal epithelium ...15
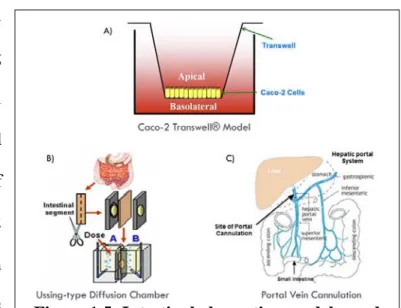
Figure 1.5 Intestinal absorption models used in the current study ...16
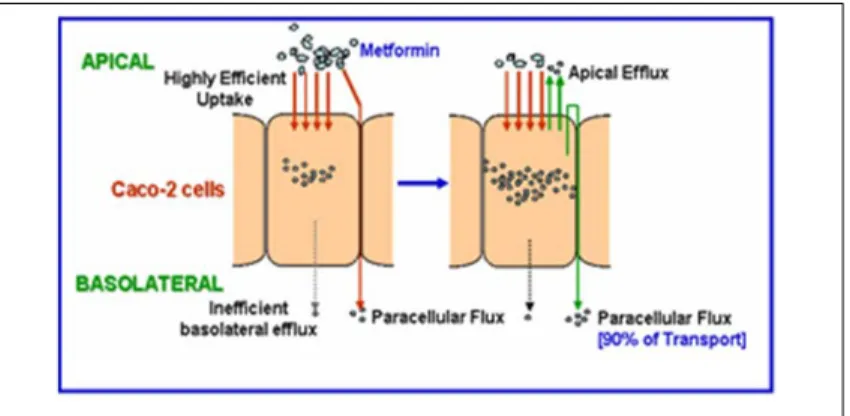
Figure 1.6 Metformin uptake and transport in Caco-2 cell monolayers ...18
Figure 1.7 Proposed Intestinal Sponge Absorption Mechanism of Metformin ...20
Figure 2.1 Structure of metformin and chemical inhibitors of metformin transporters ...47
Figure 2.2 Cation-selective transporter gene expression in the small intestine of C57BL/6J mice ...48
Figure 2.3 Kinetics of metformin uptake by mOct1–3, mMate1, and mPmat ...49
Figure 2.4 Inhibition of mOct1-, mOct2-, mOct3-, mMate1-, or mPmat-mediated [14C]metformin (50 µM) uptake by cationic inhibitors of these transporters in the respective mouse transporter-expressing CHO cell lines ...51
Figure 2.5 Metformin apical uptake in mouse intestinal tissue in the presence or absence of desipramine ...52
Figure 3.1 Chemical structures of A) metformin and B) pentamidine ...78
Figure 3.2 Uptake versus transport clearance of metformin in Caco-2 cell monolayers, as well as mouse and human intestinal tissue ...79
xiii
Figure 3.4 Trans-inhibition and -activation of metformin efflux from CHO cells that are singly-transfected with cation transporters
by pentamidine, quinidine, and desipramine ...81 Figure 3.5 Inhibition of metformin efflux from mouse intestinal tissue
by quinidine and pentamidine ...82 Figure 3.6 Total metformin accumulation in the small intestine of mouse ...83 Figure 3.7 Intestinal accumulation of metformin with and without orally
co-administered pentamidine ...84 Figure 4.1 Metformin AUC with and without co-administered
transporter inhibitors ...111 Figure 4.2 Plasma concentration versus time profile for pentamidine
after oral administration ...112 Figure 4.3 Systemic disposition of metformin with and without
co-administered pentamidine ...113 Figure 4.4 Effect of pentamidine on metformin absorption into the portal
and systemic circulation of portal vein cannulated mice ...114 Figure 4.5 Hypothetical changes in metformin pharmacokinetics
after delayed administration of pentamidine ...115 Figure 4.6 Metformin plasma concentration versus time profile
after oral dosing of metformin with or without delayed
administration of pentamidine ...116 Figure 4.7 Oral ranitidine pharmacokinetic profile after delayed
pentamidine administration ...117 Figure 4.8 Oral mannitol pharmacokinetic profile with and without
xiv
LIST OF ABBREVIATIONS
AMPK 5’ Adenosine monophosphate-activated protein kinase
AP Apical
AUC Area Under the Curve
BCA Bicinchoninic Acid
BSA Bovine Serum Albumin
BL Basolateral
CHO Chinese Hamster Ovary Cmax Peak plasma concentration
FBS Fetal Bovine Serum HBSS Hank’s Balanced Salt Solution HEK Human Embryonic Kidney
IACUC Institutional Animal Care and Use Committee
IP Intraperitoneal
IV Intravenous
KBR Krebs-Bicarbonate Ringer
Km Concentration of Half-maximal Velocity (Michaelis-Menten
Constant)
xv Papp Apparent Permeability
PD Pharmacodynamic
PK Pharmacokinetic
PMAT Plasma membrane monoamine transporter
PO Per Os (oral)
qRT-PCR Quantitative Real Time Polymerase Chain Reaction
SD Standard deviation
SDS Sodium dodecyl sulfate
SLC Solute Carrier (Family)
TEA Tetraethylammonium
Tmax Time to reach Cmax
Vmax Maximal velocity
Figure 1.1: Structure of metformin Chapter 1
INTRODUCTION
1.A. INTRODUCTION
Metformin (1,1-dimethylbiguanide) is an orally administered drug used to reduce blood glucose levels in patients with Type 2 diabetes mellitus, formally known as non-insulin dependent or adult-onset diabetes. As the first-line therapy for this global epidemic, metformin use is extensive with nearly 60 million prescriptions dispensed in 2011 in the United States alone (IMS Institute for Healthcare Informatics, National Prescription Audit). The biguande class of anti-diabetic drugs originated in the 1920s after extracts of French lilac (also known as goat’s rue), a plant used to treat diabetes since medieval times, was found to contain guanidine (Bailey, 1992). Because guanidine was too toxic for clinical use, chemical derivatives including galegine, alkylguanidines, and biguanides were synthesized. However, these drugs were largely ignored, partly due to the introduction of insulin therapy for Type 1 and Type 2 diabetes in the early 20th century. Several biguanides, including metformin (Figure 1.1), phenformin, and buformin, were first reported in the literature in the
2
Figure 1.2 : Major sites of pharmacologic action of metformin effects, both drugs were eventually withdrawn from the market due to a severe side effect, namely lactic acidosis. Because the risk of lactic acidosis associated with metformin was lower compared to other biguanides, its use was revitalized in Europe in the 1970s, and the FDA approved its use in the United States in the mid-1990s. Although the risk of lactic acidosis is still present with metformin therapy, it is much less common and typically avoidable when following generally prescribed guidelines (e.g., contraindicated for renal insufficiency).
Diabetes mellitus is a group of diseases characterized by elevated glucose levels in the blood (e.g., fasting plasma glucose >125 mg/dl) and develops from the failure of the body to produce or utilize the peptide hormone, insulin. Type 1 diabetes, previously called juvenile diabetes, results from the inability of the beta cells of the pancreas to produce insulin. The other major and most common form of this disease is Type 2 diabetes. Although usually diagnosed later in life, it can occur at any age, typically developing in the setting of insulin resistance, where cells are unable to utilize insulin efficiently combined with insulin secretory defects.
The mechanism of action of metformin exhibits tissue-specific behavior (Figure 1.2). For instance, in the liver, which is the generally accepted major pharmacological target of
metformin, glucose
3
hepatic gluconeogenesis. In skeletal muscle tissue, increased metformin-mediated glucose uptake via an upregulation of glucose transporter 4 (GLUT4) in the plasma membrane helps reduce blood glucose levels (Hundal et al., 1992; Lee et al., 2011). Additionally, in adipose tissue, metformin decreases lipolysis, which lowers the concentration of free fatty acids in the plasma and attenuates insulin resistance (Bourron et al., 2009). Although metformin is an insulin sensitizer, it does not increase insulin secretion, and therefore, hypoglycemia is rarely seen as a result of metformin monotherapy. In fact, insulin secretion is reduced in the setting of metformin treatment (Leclerc et al., 2004). In the small intestine, it has been proposed that blood glucose lowering by metformin occurs by decreased glucose absorption and increased glucose utilization (Wilcock and Bailey, 1991; Ikeda et al., 2000).
4 1.B. METFORMIN PHARMACOKINETICS 1.B.1 Intravenous Pharmacokinetics of Metformin
5 1.B.2. Oral Pharmacokinetics of Metformin
Clinical pharmacokinetic studies show that metformin is well-absorbed, although incompletely (~20–30% in feces), with a reported oral bioavailability between 40–60% (Pentikainen et al., 1979; Tucker et al., 1981). The Cmax of metformin ranges from ~1–3 μg/ml with an estimated Tmax of ~2–3 hours. Higher metformin doses of 1.0 and 1.5
grams showed decreased bioavailabilities of 38% and 35%, respectively (Tucker et al., 1981). Similarly, non-linear increases in metformin Cmax and AUC with increasing oral
doses were observed by Sambol et al. (1996). Deconvolution analysis of metformin oral pharmacokinetic data suggests that its absorption is nearly complete within six hours, and is consistent with its absorption in the small intestine (Tucker et al., 1981). In these three separate studies, the terminal rate of elimination of metformin from plasma was slower following oral administration compared to intravenous administration, which is indicative of flip-flop kinetics. Collectively, these results suggest that the oral absorption of metformin is mediated by a saturable process in the intestine.
1.B.3. Metformin Metabolism
6
mechanisms for metformin (Choi et al., 2006). The authors also suggest that the 27% decrease in metformin plasma AUC in rats following its administration via the portal vein compared to delivery via the jugular vein was due to hepatic first pass metabolism. A subsequent study also conducted in rats assessed changes in non-renal (presumably metabolic) clearance of metformin in the presence of cytochrome P450 inhibitors (~24– 79% lower clearance) and inducers (57% higher clearance) (Choi and Lee, 2006). Based on these changes in metformin clearance in the presence of P450 modulators, the authors proposed that rat Cyp2C11, 2D1, and 3A1/2 were involved in metformin metabolism. However, it should be noted that the use of P450 inhibitors such as quinine also significantly decreased calculated renal clearance of metformin by ~33–59%, a process mediated by drug transporters (Section 1.B.4). The effects of these specific inhibitors and inducers on transporter activity or expression have not been thoroughly investigated, although recent studies have begun to address this issue. For example, metformin has been shown to decrease P-glycoprotein (P-gp) expression by downregulating the multidrug resistance 1 (MDR1) gene in MCF-7 breast cancer cells (Kim et al., 2011). Collectively, these studies investigating metformin metabolism are inconclusive, having failed to detect a possible metabolite or show any evidence of metabolism by specific P450 isozymes through in vitro experiments.
1.B.4 Drug Transporters Involved in Metformin Disposition
7
Figure 1.3: Transporters involved in the disposition of metformin. Adapted from Zolk 2009.
transporting proteins (also known as
ATP-binding cassette (ABC) transporters). OCT2 (SLC22A2) and OCT3 (SLC22A3) were subsequently cloned in 1996 (Okuda
et al., 1996) and 1998 (Kekuda et al., 1998), respectively. OCT1 is primarily expressed in the liver, OCT2 is shows highest expression in the kidneys, while OCT3 is more widespread with high expression in liver, heart, skeletal muscle, and placenta (Koepsell et al., 2007) (Figure 1.3; Table 1.1). OCT3 is also known as the extraneuronal monoamine transporter (EMT) due to its role as a transporter of neurotransmitters such as dopamine, serotonin, and norepinephrine (Wu et al., 1998). OCT1-3 are driven in an electrogenic manner independent of sodium and proton gradients and can translocate substrates across membranes in either direction. Because they have the ability to transport a variety of endogenous and exogenous organic cations, these transporters are also described as polyspecific transporters.
8
higher accumulation of the drug in the liver of normal mice compared to Oct1 knockout animals, and small intestinal accumulation of metformin was ~3–7-fold higher in normal mice after intravenous dosing (Wang et al., 2002). A lack of difference in kidney accumulation of metformin suggest the presence of other uptake transporters of metformin in the basolateral membrane of renal proximal tubule cells which may be normally expressed in kidney tubules or upregulated as a compensatory mechanism. Studies conducted with Oct1/Oct2 double knockout mice demonstrated increased steady-state concentrations of the prototypical cation-selective transporter substrate, tetraethylammonium (TEA), providing strong evidence that Oct2 also mediates metformin uptake in the mouse kidney (Jonker et al., 2003).
9
and functional data. However, these data are circumstantial since direct uptake of metformin via these transporters in either intestinal tissue or cell-based models has not been demonstrated.
The multidrug and toxin extrusion (MATE) proteins are the most recent transporters identified in the literature to show metformin substrate activity. Cloned in 2005, MATE1 (SLC47A1) was identified as the long-hypothesized mammalian proton/organic cation exchanger responsible for excretion of cationic toxins and endogenous compounds into urine and bile (Otsuka et al., 2005). A year later, a report identifying and characterizing the human kidney specific MATE2-K (SLC47A2) was published (Masuda et al., 2006). Uptake of metformin was first demonstrated by MATE2-K, and MATE1 soon thereafter, suggesting that these transporters mediate the apical efflux of metformin from liver and kidney cells (Masuda et al., 2006; Tanihara et al., 2007) (Figure 1.3).
10
The ABC transporters, P-gp and breast cancer resistance transporter (BCRP), were reported to transport metformin based on studies using pooled inside-out vesicles prepared from human placental tissue (Hemauer et al., 2010). Evidence provided by Hemauer et al. (2010) for P-gp-mediated transport showed decreased vesicular uptake in the presence of the P-gp inhibitor, verapamil. However, at the concentration used in this study, verapamil (200 μM) could also inhibit organic cation transporters (i.e., OCT1 = 1.2 – 2.9 μM; OCT2 = 13.4 – 85 μM; MATE1 = 28 μM; MATE2-K = 32 μM). KO143 (25 nM and 1 μM) was also utilized to inhibit other ABC transporters suggesting that BCRP is another efflux transporter of metformin, although the inhibitory effect of this inhibitor on OCT- and MATE- mediated transport has not been investigated (Hemauer et al., 2010). However, studies by Proctor et al. (2008) using the P-gp selective inhibitor 1 μM GW918 showed no effect on metformin efflux from metformin preloaded Caco-2 cell monolayers. Additionally, in single-pass intestinal perfusion (SPIP) studies in rats, effective permeability (Peff) of metformin was not affected by duodenal co-perfusion of
11 Table 1.1. Putative Transporters of Metformin Transporter Name Transporter
Abbreviation
Gene Amino Acids
(Human / Mouse) Highest Tissue Expression Organic Cation Transporter 1
OCT1/Oct1 SLC22A1 554 / 556 Liver Organic Cation
Transporter 2 OCT2/Oct2 SLC22A2 555 / 553 Kidney Organic Cation
Transporter 3
OCT3/Oct3 SLC22A3 556 / 551 Liver
Skeletal Muscle Placenta Heart Plasma Membrane Monoamine Transporter
PMAT/Pmat SLC29A4 530 / 528 Brain
Skeletal Muscle Multidrug and toxin
extrusion protein 1
MATE1/Mate1 SLC47A1 570 / 566 Liver Kidney Multidrug and toxin
extrusion protein 2
MATE2-K /Mate2
SLC47A2 602 / 573 Kidney High affinity choline
transporter 1 CHT1/Cht1 SLC5A7 580 / 580 Brain Sodium-dependent
Serotonin Transporter
SERT/Sert SLC6A4 630 / 630 Lung Placenta Small Intestine 1.C. CLINICALLY OBSERVED TRANSPORTER-MEDIATED DRUG-DRUG INTERACTIONS (DDIS) WITH METFORMIN
Because metformin does not undergo extensive metabolism, DDIs with metformin are most likely to occur when cation-selective transporter substrates are co-administered with metformin. The first reported interaction of this nature was with the histamine H2-receptor antagonist, cimetidine (Somogyi et al., 1987). Based on prior
12
metformin was decreased by 27% over 24 hours. These interactions of metformin and procainamide were previously attributed to renally expressed OCT2 despite the authors acknowledging that the IC50 value of cimetidine for metformin transport (73 μM) was
considerably higher than estimated Cmax concentrations (2.3–6.8 μM) following a 200 mg
oral dose to patients with normal renal function (Kimura et al., 2005). The authors suggested that the metformin-cimetidine interaction mediated by OCT2 played a more significant role in the elderly and other individuals with renal dysfunction, and elevated cimetidine plasma concentrations in these populations.
With the identification of the MATE1 transporter in 2005, it was demonstrated that cimetidine (10 μM) was a potent inhibitor of MATE1-mediated efflux, decreasing TEA efflux by 45% (Otsuka et al., 2005). Subsequent studies indicated that cimetidine is a good substrate for MATE1 and MATE2-K with Km values of 170 and 120 μM,
respectively (Tanihara et al., 2007). In a separate study, Km values for cimetidine were
reported to be even lower, at 8 and 18 μM for MATE1 and MATE2-K, respectively, clearly indicating that cimetidine interactions with organic cations may in fact be due to inhibition of the MATE transporters (Ohta et al., 2009). In 2009, Tsuda et al. provided convincing in vitro evidence to support this hypothesis when apparent Ki values of
13
low cimetidine concentration reflective of normal plasma concentrations only affected efflux of metformin via MATE1.
Similar to the MATE-mediated cimetidine DDI, the MATE-specific inhibitor, pyrimethamine (Ito et al., 2010) was investigated by co-administration with a microdose (100 μg) or therapeutic dose (250 mg) of metformin in a single crossover study (Kusuhara et al., 2011). Metformin renal clearance was decreased by 23% and 35% with the microdose and therapeutic dose, respectively. At the therapeutic dose, Cmax and AUC
of metformin were significantly increased. Results from this study, as well as the growing body of work with cimetidine suggest that DDIs with metformin and other organic cations that occur at the renal level are most likely due to MATE inhibition. In 2011, the International Transporter Consortium (ITC) published a Nature Review on membrane transporters in drug development which suggested the use of cimetidine to investigate the clinical effects of OCT2 (Giacomini et al., 2010). Because this Transporter White Paper was influential in the preparation of the FDA DDI draft guidance, these DDI studies exemplify the importance of understanding the role of transporters at both apical and basolateral membranes of polarized cells that mediate drug disposition (FDA, 2012).
1.D. MECHANISMS OF INTESTINAL DRUG ABSORPTION
14
known as villi. These features greatly increase the surface area of the intestine, allowing for enhanced nutrient absorption. While the intestine comprises several layers of different cell types, the major barrier between the gut lumen and portal blood circulation is a single layer of polarized enterocytes, otherwise known as the intestinal epithelium. To further increase surface area and absorption, the apical membrane of these columnar-shaped enterocytes feature microvilli.
15
Figure 1.4: Drug transport mechanisms across the intestinal epithelium
transporter substrates to cross the apical and basolateral membranes in the intestine and other organs.
The first transmembrane protein identified in the tight junction was occludin and was originally believed to be responsible for the limited transport of compounds through the paracellular space (Furuse et al., 1993). However, it was later shown by the Tsukita laboratory that another group of four transmembrane domain proteins, the claudin family, was responsible for this functionality (Furuse et al., 1998). To date, more than 20 claudins have been identified and intracellular interactions of these proteins are known to possess different charge selectivities conferred by specific amino acid residues within the extracellular loops of claudins. Although the physiological function of these pores are to regulate ion movement across epithelial and endothelial cell layers, small chemical drugs are able to permeate via this route.
The major mechanisms of drug movement across the intestinal epithelium involve either paracellular or transcellular transport (Figure 1.4) (Borchardt et al., 2006). Paracellular transport is typically
16
Figure 1.5: Intestinal absorption models used in the current study. Adapted from Dufek 2011. concentration gradients formed across apical and basolateral membranes drive drug transport. The transcellular process, however, is energetically unfavorable for hydrophilic compounds, since they must break the hydrogen bonds formed with water molecules in order to cross biological membranes. Nevertheless, transcellular transport is possible for hydrophilic drugs that are substrates for transporters. This carrier-mediated process can involve transporter proteins at both the apical or basolateral membranes of enterocytes to facilitate the movement of drug across membranes.
1.D.2. Methods Used to Study Intestinal Drug Transport Numerous experimental
models exist to study drug transport across intestinal epithelia. A commonly used and well-established cellular model of intestinal transport is the Caco-2 cell monolayer grown in Transwell® plates that features two compartments separated by a
17
that mimics biological lipid bilayers of cellular membranes. Permeability results obtained from PAMPA experiments do not account for active transport mechanisms and therefore represent the passive diffusion component of transcellular transport. Ex vivo models of intestinal absorption utilizing intestinal tissue include everted sac methods and Ussing-type diffusion chambers (Figure 1.5B), while the single pass intestinal perfusion technique is a commonly used in situ method. In vivo techniques such as portal vein cannulation (Figure 1.5C), often used in rodents, enables the direct measurement of drug concentrations in the portal vein before the drug reaches the liver and is subjected to possible hepatic distribution and/or first-pass metabolism (Dufek, 2011).
1.E. METFORMIN ABSORPTION ACROSS THE INTESTINAL EPITHELIUM 1.E.1. Rationale for the Proposed Study
The complex transport processes that govern the intestinal absorption of metformin have not been elucidated to date. Metformin is a small (MW = 129 daltons), highly water-soluble drug, with a logD of -6.14 @ 6.0 (Saitoh et al., 2004). Its pKa of
18
Figure 1.6: Metformin uptake and transport in Caco-2 cell monolayers
Transporter White Paper and the 2012 FDA Draft Guidance on Drug Interaction Studies (Wang et al., 2002; Jonker et al., 2003; Muller et al., 2005; Giacomini et al., 2010; FDA, 2012; Han et al., 2013), the Thakker laboratory has convincingly shown the apical localization of OCT1/Oct1 in human and mouse intestinal tissue, as well as in Caco-2 cell monolayers (Han et al., 2013) using transporter-mediated uptake studies of the OCT1 substrate pentamidine and confocal imaging. These results by Han et al. (2013), combined with examples of other cationic drug transport studies, suggest a lack of polyspecific organic cation transporters on the basolateral membrane of enterocytes. For example, studies in the Thakker laboratory investigating the transport properties of the histamine H2-receptor antagonist ranitidine across the basolateral membrane of Caco-2
cell monolayers have shown saturable basolateral uptake of ranitidine with a Km of 66.9
mM by a mechanism which is not mediated by TEA-sensitive transporters (i.e., OCTs or the carnitine organic cation tranporters (OCTNs) (Lee et al., 2002). Subsequent studies showed that OCT1 is a high affinity transporter of ranitidine with a Km of 70 ± 9 μM
providing further evidence that this transporter is not in the basolateral membrane of Caco-2 cell monolayers (Bourdet et al., 2005).
19
the apical membrane of these cells, whereas basolateral transporters are not involved with poor transport across this membrane (Proctor et al., 2008) (Figure 1.6). In this set of experiments, the apical and basolateral efflux of metformin were evaluated in Caco-2 cells pre-loaded with metformin. Apical efflux was ~7-fold higher than basolateral efflux. The addition of GW918, an inhibitor of P-gp, had no effect on metformin efflux suggesting that the efficient efflux across the apical membrane of Caco-2 cell monolayers is not mediated by this transporter. However, the OCT inhibitor quinidine (200 μM) reduced metformin efflux by ~80% compared to control, while OCT substrates TEA, MPP+, and metformin trans-stimulated efflux. Proctor et al. (2008) also evaluated metformin apical-to-basolateral transport and uptake, and determined that the apparent permeability (Papp) of metformin was comparable to that of the prototypical paracellular
probe, mannitol. A kinetic modeling approach, originally utilized to study ranitidine transport (Bourdet et al., 2006), was applied to data on the transport and apical uptake of metformin over time to estimate the relative contribution of paracellular and transcellular routes of transport. In agreement with the Papp of metformin, this modeling strategy
20
Figure 1.7: Proposed Intestinal Sponge Absorption Mechanism of Metformin. (Proctor et al. 2008)
with the uptake and efflux properties of metformin across the apical and basolateral membranes of Caco-2 cells, prompted the development of the “sponge” intestinal absorption mechanism of metformin, and the central hypothesis of this dissertation project (Figure 1.7), as stated below:
21 1.E.2. Specific Aims
Because this hypothesis was developed in a static, in vitro cell culture model, yet suggested the involvement of changes in drug concentration due to intestinal transit, an in vivo-based approach was used to test this hypothesis. Mouse was chosen as the in vivo model, and as such, characterization of metformin transporters in this species was necessary prior to conducting studies. Therefore, the first aim of this project was to
identify mouse intestinal transporters of metformin and determine their role in metformin uptake and efflux in mouse intestinal tissue. Doing so required the generation of mouse transporter-expressing cell lines to characterize metformin transport by the orthologs of the putative human transporters of metformin. This also enabled the identification of potential metformin transporter inhibitors for use in future in vivo studies.
The second aim of this dissertation work was to demonstrate that the transporters
identified in the first aim play a role in the intestinal absorption of metformin in mice. Various pharmacokinetic studies were conducted to understand the role of drug transporters in the intestinal absorption of metformin, and specifically to demonstrate the involvement of apical transporters in the high intestinal accumulation and absorption of metformin via the paracellular route.
Specific Aim 1: Identify mouse intestinal transporters of metformin and determine their role in metformin uptake and efflux in mouse intestinal tissue.
A. Determine uptake and efflux of metformin in transporter-expressing cell systems. B. Determine the role of transporters in metformin uptake and efflux across mouse
22
Specific Aim 2: Using inhibitors of metformin transporters identified in Aim 1, demonstrate that apical intestinal transporters indirectly enhance metformin absorption via the paracellular route.
A. Determine the portal exposure of metformin in the presence/absence of a pan organic cation transporter inhibitor using a portal vein cannulated mouse model. B. Assess systemic bioavailability of metformin in the presence/absence of
metformin transporter inhibitors, and relate it to portal exposure.
23 REFERENCES
Artursson P and Karlsson J (1991) Correlation between oral drug absorption in humans and apparent drug permeability coefficients in human intestinal epithelial (Caco-2) cells. Biochem Biophys Res Commun 175:880-885.
Bailey CJ (1992) Biguanides and NIDDM. Diabetes Care 15:755-772.
Borchardt RT, Kerns EH, Hagerman MJ, Thakker DR, and Stevens JL (2006) Optimizing the "Drug-Like" Properties of Leads in Drug Discovery. Springer New York, New York, NY.
Bourdet DL, Pollack GM, and Thakker DR (2006) Intestinal absorptive transport of the hydrophilic cation ranitidine: a kinetic modeling approach to elucidate the role of uptake and efflux transporters and paracellular vs. transcellular transport in Caco-2 cells. Pharm Res Caco-23:1178-1187.
Bourdet DL, Pritchard JB, and Thakker DR (2005) Differential substrate and inhibitory activities of ranitidine and famotidine toward human organic cation transporter 1 (hOCT1; SLC22A1), hOCT2 (SLC22A2), and hOCT3 (SLC22A3). J Pharmacol Exp Ther 315:1288-1297.
Bourron O, Daval M, Hainault I, Hajduch E, Servant JM, Gautier JF, Ferre P, and Foufelle F (2009) Biguanides and thiazolidinediones inhibit stimulated lipolysis in human adipocytes through activation of AMP-activated protein kinase. Diabetologia.
Choi YH, Kim SG, and Lee MG (2006) Dose-independent pharmacokinetics of metformin in rats: Hepatic and gastrointestinal first-pass effects. J Pharm Sci 95:2543-2552.
Choi YH and Lee MG (2006) Effects of enzyme inducers and inhibitors on the pharmacokinetics of metformin in rats: involvement of CYP2C11, 2D1 and 3A1/2 for the metabolism of metformin. Br J Pharmacol 149:424-430.
Dufek MB (2011) The Effect of the Dynamic Interplay of P-glycoprotein and Cytochrome P450 3A on the Portal Bioavailability of Dual Substrate, in: Pharmaceutical Sciences, University of North Carolina, Chapel Hill.
Engel K, Zhou M, and Wang J (2004) Identification and characterization of a novel monoamine transporter in the human brain. J Biol Chem 279:50042-50049.
FDA (2012) Drug Interaction Studies - Study Design, Data Analysis, Implications for Dosing, and Labeling Recommendations: Draft Guidance.
24
Furuse M, Sasaki H, Fujimoto K, and Tsukita S (1998) A single gene product, claudin-1 or -2, reconstitutes tight junction strands and recruits occludin in fibroblasts. J Cell Biol 143:391-401.
Giacomini KM, Huang SM, Tweedie DJ, Benet LZ, Brouwer KL, Chu X, Dahlin A, Evers R, Fischer V, Hillgren KM, Hoffmaster KA, Ishikawa T, Keppler D, Kim RB, Lee CA, Niemi M, Polli JW, Sugiyama Y, Swaan PW, Ware JA, Wright SH, Yee SW, Zamek-Gliszczynski MJ, and Zhang L (2010) Membrane transporters in drug development. Nat Rev Drug Discov 9:215-236.
Gong L, Goswami S, Giacomini KM, Altman RB, and Klein TE (2012) Metformin pathways: pharmacokinetics and pharmacodynamics. Pharmacogenet Genomics. Graham GG, Punt J, Arora M, Day RO, Doogue MP, Duong JK, Furlong TJ, Greenfield
JR, Greenup LC, Kirkpatrick CM, Ray JE, Timmins P, and Williams KM (2011) Clinical pharmacokinetics of metformin. Clin Pharmacokinet 50:81-98.
Grundemann D, Gorboulev V, Gambaryan S, Veyhl M, and Koepsell H (1994) Drug excretion mediated by a new prototype of polyspecific transporter. Nature 372:549-552.
Han T, Everett R, Proctor W, Ng C, Costales C, Brouwer KL, and Thakker D (2013) Organic Cation Transporter 1 (OCT1/Oct1) is Localized in the Apical Membrane of Caco-2 Cell Monolayers and Enterocytes. Mol Pharmacol Manuscript
Submitted.
Hemauer SJ, Patrikeeva SL, Nanovskaya TN, Hankins GD, and Ahmed MS (2010) Role of human placental apical membrane transporters in the efflux of glyburide, rosiglitazone, and metformin. Am J Obstet Gynecol 202:383 e381-387.
Hidalgo IJ, Raub TJ, and Borchardt RT (1989) Characterization of the human colon carcinoma cell line (Caco-2) as a model system for intestinal epithelial permeability. Gastroenterology 96:736-749.
Hundal HS, Ramlal T, Reyes R, Leiter LA, and Klip A (1992) Cellular mechanism of metformin action involves glucose transporter translocation from an intracellular pool to the plasma membrane in L6 muscle cells. Endocrinology 131:1165-1173. Ikeda T, Iwata K, and Murakami H (2000) Inhibitory effect of metformin on intestinal
glucose absorption in the perfused rat intestine. Biochem Pharmacol 59:887-890. Ito S, Kusuhara H, Kuroiwa Y, Wu C, Moriyama Y, Inoue K, Kondo T, Yuasa H,
25
Jonker JW, Wagenaar E, Van Eijl S, and Schinkel AH (2003) Deficiency in the organic cation transporters 1 and 2 (Oct1/Oct2 [Slc22a1/Slc22a2]) in mice abolishes renal secretion of organic cations. Mol Cell Biol 23:7902-7908.
Kekuda R, Prasad PD, Wu X, Wang H, Fei YJ, Leibach FH, and Ganapathy V (1998) Cloning and functional characterization of a potential-sensitive, polyspecific organic cation transporter (OCT3) most abundantly expressed in placenta. J Biol Chem 273:15971-15979.
Kim HG, Hien TT, Han EH, Hwang YP, Choi JH, Kang KW, Kwon KI, Kim BH, Kim SK, Song GY, Jeong TC, and Jeong HG (2011) Metformin inhibits P-glycoprotein expression via the NF-kappaB pathway and CRE transcriptional activity through AMPK activation. Br J Pharmacol 162:1096-1108.
Kimura N, Okuda M, and Inui K (2005) Metformin transport by renal basolateral organic cation transporter hOCT2. Pharm Res 22:255-259.
Koepsell H, Lips K, and Volk C (2007) Polyspecific organic cation transporters: structure, function, physiological roles, and biopharmaceutical implications. Pharm Res 24:1227-1251.
Kusuhara H, Ito S, Kumagai Y, Jiang M, Shiroshita T, Moriyama Y, Inoue K, Yuasa H, and Sugiyama Y (2011) Effects of a MATE Protein Inhibitor, Pyrimethamine, on the Renal Elimination of Metformin at Oral Microdose and at Therapeutic Dose in Healthy Subjects. Clin Pharmacol Ther 89:837-844.
Leclerc I, Woltersdorf WW, da Silva Xavier G, Rowe RL, Cross SE, Korbutt GS, Rajotte RV, Smith R, and Rutter GA (2004) Metformin, but not leptin, regulates AMP-activated protein kinase in pancreatic islets: impact on glucose-stimulated insulin secretion. Am J Physiol Endocrinol Metab 286:E1023-1031.
Lee JO, Lee SK, Jung JH, Kim JH, You GY, Kim SJ, Park SH, Uhm KO, and Kim HS (2011) Metformin induces Rab4 through AMPK and modulates GLUT4 translocation in skeletal muscle cells. J Cell Physiol 226:974-981.
Lee K, Ng C, Brouwer KL, and Thakker DR (2002) Secretory transport of ranitidine and famotidine across Caco-2 cell monolayers. J Pharmacol Exp Ther 303:574-580. Masuda S, Terada T, Yonezawa A, Tanihara Y, Kishimoto K, Katsura T, Ogawa O, and
Inui K (2006) Identification and functional characterization of a new human kidney-specific H+/organic cation antiporter, kidney-specific multidrug and toxin extrusion 2. J Am Soc Nephrol 17:2127-2135.
26
Ohta KY, Inoue K, Yasujima T, Ishimaru M, and Yuasa H (2009) Functional characteristics of two human MATE transporters: kinetics of cimetidine transport and profiles of inhibition by various compounds. J Pharm Pharm Sci 12:388-396. Okuda M, Saito H, Urakami Y, Takano M, and Inui K (1996) cDNA cloning and
functional expression of a novel rat kidney organic cation transporter, OCT2. Biochem Biophys Res Commun 224:500-507.
Otsuka M, Matsumoto T, Morimoto R, Arioka S, Omote H, and Moriyama Y (2005) A human transporter protein that mediates the final excretion step for toxic organic cations. Proc Natl Acad Sci U S A 102:17923-17928.
Owen MR, Doran E, and Halestrap AP (2000) Evidence that metformin exerts its anti-diabetic effects through inhibition of complex 1 of the mitochondrial respiratory chain. Biochem J 348 Pt 3:607-614.
Pentikainen PJ, Neuvonen PJ, and Penttila A (1979) Pharmacokinetics of metformin after intravenous and oral administration to man. Eur J Clin Pharmacol 16:195-202. Proctor WR, Bourdet DL, and Thakker DR (2008) Mechanisms underlying saturable
intestinal absorption of metformin. Drug Metab Dispos 36:1650-1658.
Saitoh R, Sugano K, Takata N, Tachibana T, Higashida A, Nabuchi Y, and Aso Y (2004) Correction of permeability with pore radius of tight junctions in Caco-2 monolayers improves the prediction of the dose fraction of hydrophilic drugs absorbed by humans. Pharm Res 21:749-755.
Schneeberger EE and Lynch RD (2004) The tight junction: a multifunctional complex. Am J Physiol Cell Physiol 286:C1213-1228.
Somogyi A, McLean A, and Heinzow B (1983) Cimetidine-procainamide pharmacokinetic interaction in man: evidence of competition for tubular secretion of basic drugs. Eur J Clin Pharmacol 25:339-345.
Somogyi A, Stockley C, Keal J, Rolan P, and Bochner F (1987) Reduction of metformin renal tubular secretion by cimetidine in man. Br J Clin Pharmacol 23:545-551. Song NN, Li QS, and Liu CX (2006) Intestinal permeability of metformin using
single-pass intestinal perfusion in rats. World J Gastroenterol 12:4064-4070.
Tanihara Y, Masuda S, Sato T, Katsura T, Ogawa O, and Inui K (2007) Substrate specificity of MATE1 and MATE2-K, human multidrug and toxin extrusions/H(+)-organic cation antiporters. Biochem Pharmacol 74:359-371.
27
Wang DS, Jonker JW, Kato Y, Kusuhara H, Schinkel AH, and Sugiyama Y (2002) Involvement of organic cation transporter 1 in hepatic and intestinal distribution of metformin. J Pharmacol Exp Ther 302:510-515.
Wilcock C and Bailey CJ (1991) Reconsideration of inhibitory effect of metformin on intestinal glucose absorption. J Pharm Pharmacol 43:120-121.
Wu X, Kekuda R, Huang W, Fei YJ, Leibach FH, Chen J, Conway SJ, and Ganapathy V (1998) Identity of the organic cation transporter OCT3 as the extraneuronal monoamine transporter (uptake2) and evidence for the expression of the transporter in the brain. J Biol Chem 273:32776-32786.
Xia L, Engel K, Zhou M, and Wang J (2007) Membrane localization and pH-dependent transport of a newly cloned organic cation transporter (PMAT) in kidney cells. Am J Physiol Renal Physiol 292:F682-690.
Zhou G, Myers R, Li Y, Chen Y, Shen X, Fenyk-Melody J, Wu M, Ventre J, Doebber T, Fujii N, Musi N, Hirshman MF, Goodyear LJ, and Moller DE (2001) Role of AMP-activated protein kinase in mechanism of metformin action. J Clin Invest 108:1167-1174.
Zhou M, Duan H, Engel K, Xia L, and Wang J (2010) Adenosine Transport by Plasma Membrane Monoamine Transporter (PMAT): Re-investigation and Comparison with Organic Cations. Drug Metab Dispos.
Zhou M, Xia L, and Wang J (2007) Metformin transport by a newly cloned proton-stimulated organic cation transporter (plasma membrane monoamine transporter) expressed in human intestine. Drug Metab Dispos 35:1956-1962.
Chapter 2
CHARACTERIZATION OF CATION-SELECTIVE TRANSPORTERS OF METFORMIN IN THE MOUSE SMALL INTESTINE
2.A. OVERVIEW
The high bioavailability of the orally administered anti-diabetic drug metformin, despite its hydrophilic nature and positive charge at all physiological pH values, suggests the involvement of intestinal drug transporters. Because the mouse is a commonly used preclinical model for investigating metformin disposition and pharmacology, the goal of this study was to characterize the intestinal mouse orthologs of human putative metformin transporters, and evaluate their potential role in metformin uptake from the gut lumen. Gene expression studies of polyspecific organic cation transporters, namely organic cation transporter (Oct) 1-3, plasma membrane monoamine transporter (Pmat), and multidrug and toxin extrusion (Mate) 1 and 2, in the mouse small intestine showed that mOct1 and mMate1 were highly expressed in the intestinal mucosa. Stable cell lines expressing mOct1-3, mPmat, and mMate1 were generated to characterize metformin uptake kinetics and inhibitory potencies of a panel of transporter inhibitors toward metformin uptake. Metformin was found to be a substrate for all five transporters, with Km values similar to those of their respective human orthologs. However, IC50 values of
29
30 2.B. INTRODUCTION
The biguanide, metformin, is the first-line therapy for the management of type 2 diabetes. In addition to its widespread use as an anti-hyperglycemic agent, it has been increasingly prescribed off-label to treat other diseases such as polycystic ovarian syndrome (Palomba et al., 2009), gestational diabetes (Wensel, 2009), and is currently being evaluated for its anti-cancer effects (Alimova et al., 2009; Jiralerspong et al., 2009). While this drug has been used in clinic for decades worldwide for increasingly varied indications, its mechanism of action and disposition are still under active investigation (Sakar et al., 2010; Kusuhara et al., 2011; Lee et al., 2011).
Physicochemical properties of metformin (Figure 2.1), namely a pKa of 12.4 and
31
(Kimura et al., 2005; Zhou et al., 2007; Nies et al., 2009; Proctor, 2010; Ito et al., 2012; Han, 2013) in single transporter-transfected cell lines.
32 2.C. METHODS
Materials
The CHO-K1 cell line was obtained from the American Type Culture Collection (Manassas, VA, USA). Ham’s F-12 Nutrient mixture, penicillin-streptomycin-amphotericin B solution (100X), and geneticin were obtained from Life Technologies (Grand Island, NY, USA). Fetal bovine serum (FBS) was obtained from Atlanta Biologicals (Lawrenceville, GA, USA), and Hank’s balanced salt solution (HBSS) with calcium and magnesium was purchased from Cellgro (Manassas, VA, USA). Metformin, quinidine, 1-methyl-4-phenyl pyridinium (MPP+), tetraethylammonium (TEA), desipramine, corticosterone, mitoxantrone, pyrimethamine, and D-(+) glucose were purchased from Sigma-Aldrich (St. Louis, MO, USA). [14C]Metformin (107 mCi/mmol) was purchased from Moravek Biochemicals and Radiochemicals (Brea, CA, USA). Cell Culture and Generation of Stable Cell Lines
CHO-K1 cells (ATCC® CCL-61) were transfected with plasmids containing full-length mOct1, mOct2, mPmat (Origene, Rockville, MD, USA), mOct3, mMate1a or mMate2 (Open Biosystems/Thermo Scientific, Waltham, MA, USA) cDNAs by Lonza (Walkersville, MD, USA) nucleofection according to the manufacturer’s optimized protocol for this cell line (Cell Line Nucleofector Kit T: high efficiency program (U-023)). Co-transfection or subcloning into pcDNA3.1(+) (Invitrogen, Carlsbad, CA, USA) was performed for plasmids lacking appropriate selectable markers or promoters.
婚婜婢婲婴存孺孼宂宖官忆忠忢忪忾怀愄愪愬愲慂慄
桖桘概榮榰榶槆槈沢泄泆泌泠波涮淄淆淌淘淚潎潰潲
33
10% FBS, 100 units/ml penicillin, 100 µg/ml streptomycin, and 0.25 µg/ml amphotericin B. Culture media for transfected cell lines were supplemented with 0.25 mg/ml geneticin. All cells were grown at 37ºC in a humidified atmosphere with 5% CO2.
Quantitative Real Time-PCR (qRT-PCR)
Total RNA was extracted from transfected cell lines or mouse intestinal mucosa from male C57BL/6J (Jackson Laboratories, Bar Harbor, ME, USA) using TRIzol reagent (Invitrogen, Carlsbad, CA, USA), and purified using the RNeasy Plus kit (Qiagen, Valencia, CA, USA) with slight modification. cDNA was reverse transcribed by FirstStrand Synthesis supermix kit (Invitrogen, Carlsbad, CA, USA) using equal amounts of total RNA for each sample. Relative mRNA levels of cation-selective transporters in mouse small intestine were determined using Taqman® assays validated for each individual transporter utilizing an Applied Biosystems 7300 RT-PCR system. Data were normalized to the 18s rRNA eukaryotic housekeeping gene by the 2-ΔΔCT
method.
In vitro Uptake Studies in CHO Cell Lines
Transfected and control cells were seeded into 24-well plates at a density of 100,000 cells/cm2. Growth medium was changed on alternate days and the day prior to experimentation. Uptake experiments were conducted 5–7 days post-seeding. Cells were pre-incubated with transport buffer (HBSS with 10 mM HEPES and 25 mM glucose, pH 7.2) for 30 minutes at 37ºC. Assays were initiated by replacing the pre-incubation buffer with transport buffer containing varying concentrations of [14C]metformin (0.1 μCi/ml) in
34
mMate1 kinetic parameters, the extracellular pH (of transport buffer) was adjusted to pH 8.0 to increase [14C]metformin uptake. Cells were washed 3X with 4ºC transport buffer, and lysed in 500 µl of 0.1 N NaOH/0.1% SDS for 4 h with shaking. Cellular accumulation of [14C]metformin was determined by liquid scintillation spectrometry. Protein concentration was measured by the BCA protein assay (Pierce Chemical, Rockford, IL, USA) with bovine serum albumin as a standard.
Metformin Transport and Uptake Studies in Mouse Intestinal Tissue
35 Data Analyses
For kinetic studies, uptake of [14C] metformin was evaluated in transporter-transfected cell lines. Nonspecific cell-associated radioactivity was determined by measuring drug uptake in parental cell lines. These values were subtracted from data obtained from transporter-transfected cells to obtain the kinetic parameters Km and Vmax
(Michaelis constant and maximal uptake velocity, respectively) by modeling metformin concentration-dependent uptake data in Winnonlin 5.3 (Pharsight, Mountain View, CA, USA) using equation 1.
Equation 1:
where V is the uptake rate in the presence of varying concentrations of metformin, S. Inhibitory potency (IC50) was determined for each inhibitor by fitting equation 2
to the uptake data,
Equation 2:
1
where V is the uptake rate in the presence of the inhibitor, I, Vo is the rate in the absence
of the inhibitor, IC50 is the inhibitor concentration required for 50% inhibition, and n is
the Hill Coefficient.
36 2.D. RESULTS
Expression of Mouse Cation-Selective Transporters in the Intestine of C57BL/6J Mice
The expression of cation-selective transporters in mouse small intestine is shown in Figure 2.2. mOct1 and notably, mMate1 were the most highly expressed genes in all regions of the small intestine, followed by mOct3, mMate2, and mPmat, while mOct2 was poorly detected. A trend showing highest gene expression in the proximal jejunum for all transporters was observed, except for mOct3 and mPmat which showed highest expression in the ileum.
Metformin Substrate Activity for Mouse Organic Cation Transporters
Metformin is a known substrate for human OCT1, 2, and 3, MATE1 and -2, as well as PMAT (Wang et al., 2002; Kimura et al., 2005; Masuda et al., 2006; Zhou et al., 2007; Sato et al., 2008; Proctor, 2010). To assess if the mouse orthologs of these human transporters show similar or different substrate activity for metformin, single transporter-expressing CHO cell lines (i.e., mOct1-3, mPmat, and mMate1) were generated. Following confirmation of mouse transporter gene expression by qRT-PCR analysis, functional activity of the expressed transporters was determined by uptake assays of probe substrates (e.g., TEA). Attempts to reproduce previously reported (Hiasa et al., 2007) functional uptake of probe substrates by mMate2 transfected cell lines were unsuccessful, and thus metformin uptake kinetics for mMate2 was not evaluated in the present study.
37
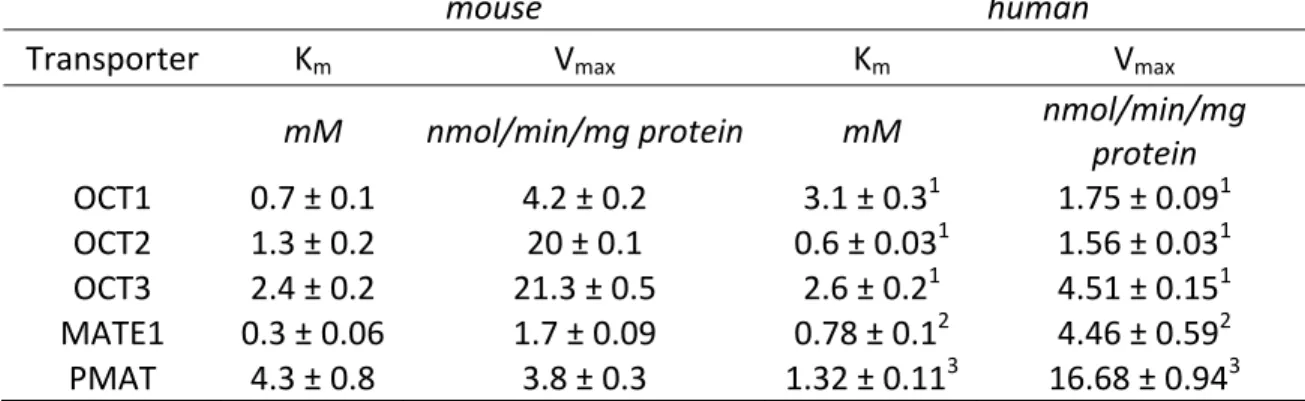
of 5 minutes (within the linear range for uptake) was selected for all subsequent studies with transporter-transfected cell lines, except for studies with mOct2-expressing CHO cells where a shorter time of 30 seconds was required. Metformin uptake in transporter-transfected cell lines compared to parental cells was 3–20-fold higher, confirming substrate activity of metformin for the mouse orthologs of human metformin transporters (Figure 2.3A). Concentration-dependent uptake of metformin was saturable in all transporter-transfected cell lines (Figure 2.3B). Estimates of the Michaelis constant, Km,
ranged from 0.3 mM for mMate1 to 4.3 for mPmat (Table 2.1), indicating that the affinity of metformin for each transporter was in the following rank order: mMate1 > mOct1 > mOct2 > mOct3 > mPmat.
In Vitro Chemical Inhibition of Metformin Uptake
To identify transporter-selective chemical inhibitors, the inhibitory potencies toward the cellular uptake of metformin were evaluated for a panel of known chemical inhibitors of human metformin transporters (Figure 2.1). The prototypical cation-selective transporter inhibitor, MPP+, inhibited metformin uptake via mOct1-3 and mMate1 with IC50 values <25 μM and ~180 μM for mPmat, whereas quinidine was a
weaker pan inhibitior with IC50 values between 120 – 760 μM for mOct2, mOct3,
mPmat, and mMate1; IC50 for mOct1 was 29 μM. Additionally, since previous studies in
the Thakker laboratory demonstrated that specific concentrations of mitoxantrone (25
38
for mOct1 than with OCT1, with an IC50 >20-fold higher (Table 2.2), while
corticosterone (30 µM) inhibited both mOct2 and mOct3 by approximately 80%. A low concentration of desipramine (10 µM) was shown to be a strong inhibitor of mOct1, decreasing metformin uptake by 85% (Figure 2.4). Pyrimethamine, a selective inhibitor of human and mouse MATE transporters (Ito et al., 2010; Kusuhara et al., 2011), strongly inhibited mMate 1 at 1µM, while only weakly inhibiting mOct2 (~30%). Desipramine, at a higher concentration of 1 mM, inhibited >80% of metformin uptake by all five mouse transporters investigated. IC50 values of the inhibitors for each transporter are reported in
Table 2.2.
Metformin Uptake in Mouse Intestinal Tissue
39 2.E. DISCUSSION
Results in the present study provide the first direct evidence that transport of the anti-diabetic drug, metformin, across the apical membrane of mouse intestine is mediated by polyspecific organic cation transporters. Because metformin is not subjected to metabolism or significant protein binding, functionally active transporters in key cellular membranes dictate its overall disposition and pharmacology. The major transporters of metformin that facilitate its uptake into organs such as liver and kidney from the systemic blood circulation in humans are the OCTs, with OCT1 and OCT2 predominantly expressed in the liver and kidney, respectively, and OCT3 having a broader tissue expression (Gorboulev et al., 1997; Wu et al., 2000; Motohashi et al., 2002). The MATE transporters are believed to play a substantial role in the excretion of cations from the kidney (MATE2) and liver (MATE1) into the urine and bile, respectively. PMAT is also highly expressed in the brain and central nervous system (Engel et al., 2004; Dahlin et al., 2007), although its role in metformin disposition remains unclear. While studies have been conducted to determine the major metformin transporters in elimination organs such as the liver and kidney, a lack of information on the membrane localization of these transporters in the intestine limits our current understanding of metformin oral absorption.
40
41
In addition to investigating the expression profile of metformin transporters in mouse intestine, an understanding of metformin uptake kinetics is beneficial for studying and predicting its overall disposition. Although metformin kinetics have been characterized for all major human metformin transporters (Kimura et al., 2005; Tanihara et al., 2007; Zhou et al., 2007; Nies et al., 2009; Han, 2013) and some mouse transporters (Ito et al., 2012; Toyama et al., 2012), to our knowledge, metformin kinetics for mouse Oct3 and Pmat have not been reported. The Km of metformin for each transporter,
determined in single transporter-expressing CHO cells, is critical for assessing and understanding differences between metformin disposition in humans and the preclinical mouse model that is extensively used for investigating metformin PK and PD. The Km
values of metformin for all mouse transporters investigated were within a similar range to those previously reported in the literature (± 4-fold) for the human orthologs (Nies 2011) (Table 2.1). It is interesting to note that metformin has a higher affinity for mOct1 compared to mOct2 (0.7 versus 1.3 mM, respectively), which is not consistent with its affinity for the human orthologs of these two transporters (3.1 vs 0.6 mM, respectively) (Kimura et al., 2005). This observation in mouse corroborates with recent data from transporter-transfected HEK293 cell lines where Km values of metformin were 1.8, 2.9,
42
between mMate2 and MATE2 is limited (45% by BLAST analysis), whether metformin is transported efficiently by the mouse ortholog of MATE2 remains to be determined.
To address the lack of information from in vivo and ex vivo uptake studies to support intestinal transporter expression data, potential chemical inhibitors of mouse metformin transporters were evaluated using singly-transfected transporter cell lines. MPP+, a well-established pan inhibitor of human cation transporters, was found to be a potent inhibitor of metformin uptake by a majority of the transporters investigated in this study (Table 2.2A). However, quinidine, another commonly used pan cation-selective transporter inhibitor, showed a lower potency for inhibition of metformin uptake by most mouse metformin transporters compared to their corresponding human orthologs (Table 2.2B), with IC50 values >100 µM. Ito et al. (2010) demonstrated that pyrimethamine was
a strong inhibitor of mMate1-mediated TEA uptake with an IC50 of 145 nM, while IC50
values of mOct1-2 were in the micromolar range. Results presented in the current study also support the previous finding that pyrimethamine is a potent inhibitor of mMate1 but does not significantly inhibit mOct3 or mPmat at nanomolar concentrations. Desipramine (1 mM) was identified as a general inhibitor of the five mouse transporters of metformin. Understanding the extent of inhibition by a chemical inhibitor at specific concentrations in combination with transporter expression patterns and levels in different organs will allow us to evaluate the contributions of individual transporters in specific organs to the disposition of cationic drugs.
43
Thakker laboratory demonstrate that OCT1 is also localized in the apical membrane in Caco-2 cells, and mouse and human intestinal tissues. However, functional uptake data confirming that transporters mediate the intestinal absorption of metformin are lacking in the literature. The inhibition of metformin apical uptake into mouse intestinal tissue by desipramine (Figure 2.5) provides the first direct evidence for the involvement of cation-selective transporters in metformin uptake from the gut lumen in the mouse. However, uptake inhibition of metformin by desipramine was only 40%, which was less than expected. This suggests the possibility of other transporters of metformin in mouse small intestine which are not sensitive to desipramine. Alternatively, interactions of metformin with secreted proteins found in the extracellular matrix such as mucins, which are negatively charged due to extensive glycosylation, or non-specific cell surface binding (Han, 2013) may overestimate the transporter-mediated uptake of metformin. However, additional studies with selective transporter inhibitors and/or knockout animals are required to identify the major metformin transporters and determine their relative contributions to the intestinal absorption of metformin.
44
45 2.F. TABLES AND FIGURES
Table 2.1. Uptake kinetic parameters of mouse cation-selective transporters for metformin
mouse human
Transporter Km Vmax Km Vmax
mM nmol/min/mg protein mM nmol/min/mg
protein
OCT1 0.7 ± 0.1 4.2 ± 0.2 3.1 ± 0.31 1.75 ± 0.091
OCT2 1.3 ± 0.2 20 ± 0.1 0.6 ± 0.031 1.56 ± 0.031
OCT3 2.4 ± 0.2 21.3 ± 0.5 2.6 ± 0.21 4.51 ± 0.151
MATE1 0.3 ± 0.06 1.7 ± 0.09 0.78 ± 0.12 4.46 ± 0.592
PMAT 4.3 ± 0.8 3.8 ± 0.3 1.32 ± 0.113 16.68 ± 0.943
46
Table 2.2. Inhibitory potencies of organic cations for mouse and human transporters
A) Inhibitory potencies of organic cations for mouse transporters expressed in CHO cell lines
Inhibitor mOct1 IC50 mOct2 IC50 mOct3 IC50 mMate1 IC50 mPmat IC50
µM µM µM µM µM MPP+ 9.0 ± 1.4 3.1 ± 1.2 23 ± 1.1 175.9 ± 1.2 17 ± 1.8
Quinidine 29 ± 1.2 190 ± 1.3 120 ± 1.3 760 ± 2.1 260 ± 1.6 Corticosterone 72 ± 1.3 2.3 ± 1.3 3.1 ± 1.2 >300 >300 Desipramine 1.2 ± 1.1 11 ± 1.3 84.3 ± 1.1 282.4 ± 1.4 39.3 ± 1.3 Mitoxantrone 67.1 ± 1.1 260 ± 1.2 345 ± 1.2 168 ± 1.3 >1000 Pyrimethamine 3.6 ± 1.2 3.0 ± 1.4 5.4 ± 1.3 0.087 ± 1.3 43.5 B) Inhibitory potencies of organic cations for human transporters; data taken from Nies
2011, Engel 2005, and Han 2013. Values in ( ) indicates Km values, N.A. = not
available.
Inhibitor OCT1 IC50 OCT2 IC50 OCT3 IC50 MATE1 IC50 PMAT IC50
µM µM µM µM µM
MPP+ 15 - 32 2.4 - 54 (47 - 83) (100) (33)
Quinidine 5.4 - 114 7.1 - 446 14 - 124 29 25.3 Corticosterone 7 - 22 5.4 -34 0.12 - 0.29 >20 450.5
Desipramine 5.4 - 57 16 14 56 32.6
Mitoxantrone 3 135 174 N.A. N.A.
47
A) E)
B) F)
C) G)
D)
Figure 2.1. Structure of metformin and chemical inhibitors of metformin transporters. A) Metformin; B) Quindine; C) Desipramine; D) Corticosterone; E) Mitoxantrone; F) Pyrimethamine; G) MPP+
NH3 N
H N
48
Figure 2.2. Cation-selective transporter gene expression in the small intestine of C57BL/6J mice. Intestinal expression of mOct1–3, mPmat, and mMate1 in the duodenum, proximal jejunum, and ileum of mouse small intestine. Data are expressed as levels relative to the lowest detected transporter, mOct2.
Duodenum Proximal Jejunum Ileum
0.1 1 10 100 1000
10000 Oct1
Oct2 Oct3 Pmat Mate1 Mate2
R
e
la
ti
ve E
x
p
ressi
o
49
A) B)
Figure 2.3. Kinetics of metformin uptake by mOct1–3, mMate1, and mPmat. A) CHO cells stably transfected with mOct1, mOct2, mOct3, mMate1, or mPmat were incubated with [14C]metformin (50 µM) at 37ºC for the indicated time. B) Uptake of [14C]metformin (indicated concentrations) was determined in the transfected or untransfected cells. Nonspecific cell-associated radioactivity was determined by
0 1 2 3 4 5 6 7 8 9 10
0 250 500 750 1000 mOct1-CHO Control Time (min) UP TAKE (p m o l/ m g pr ot e in)
0.0 0.5 1.0 1.5 2.0 2.5 3.0
0 200 400 600 800 1000 1200 1400 1600 mOct2-CHO Control Time (min) UP T A KE (p m o l/ m g pr ot e in)
0 1 2 3 4 5 6 7 8 9 10
0 500 1000 1500 2000 mOct3-CHO Control Time (min) UP TAKE (p m o l/ m g p rot e in)
0 1 2 3 4 5 6 7 8 9 10
0 100 200 300 400 500 600 mMate1-CHO Control Time (min) UPTAKE (p m o l/ mg pr ot e in )
0 1 2 3 4 5 6 7 8 9 10
0 50 100 150 200 250 mPmat-CHO Control Time (min) UP TAKE (p mol /mg pr ot ei n)
0 5 10 15 20 0 2000 4000 6000 Concentration (mM) UP T A K E (p mo l/ m in/mg pr o te in )
0 3 6 9 12 15 0 5000 10000 15000 20000 Concentration (mM) UP T A K E (p m o l/ m in /m g pr ot e in)
0 5 10 15 20 0 5000 10000 15000 20000 25000 Concentration (mM) UP T AKE (p mo l/ m in/ mg p ro te in)
0 2 4 6 8 10 0
500 1000 1500 2000
Concentration (mM)
UP T AKE (p m o l/ m in /m g pr ot e in)
50
51
Figure 2.4. Inhibition of mOct1-, mOct2-, mOct3-, mMate1-, or mPmat-mediated [14C]metformin (50 µM) uptake by cationic inhibitors of these transporters in the respective mouse transporter-expressing CHO cell lines. Data represent mean ± S.D. of experiments conducted in triplicate.
-2 -1 0 1 2 3
0 20 40 60 80 100 120 mOct1 mMate1 mPmat mOct3 mOct2
log[Corticosterone] (M)
U p take (% Con trol)
-2 -1 0 1 2 3 0 20 40 60 80 100 120 mOct1 mMate1 mPmat mOct3 mOct2
log[Desipramine] (M)
U p take (% C o ntr o l)
-2 -1 0 1 2 3 0 20 40 60 80 100 120 mOct1 mMate1 mPmat mOct3 mOct2
log[MPP+] (M)
Up ta k e (% Co nt ro l)
-2 -1 0 1 2 3 0 20 40 60 80 100 120 mOct1 mMate1 mPmat mOct3 mOct2
log[Quinidine] (M)
U p take (% Con trol)
-2 -1 0 1 2
0 20 40 60 80 100 120 mOct1 mMate1 mPmat mOct3 mOct2
log[Pyrimethamine] (M)
Up ta k e (% Co nt ro l)
-2 -1 0 1 2 3 0 20 40 60 80 100 120 mOct1 mMate1 mPmat mOct3 mOct2
log[Mitoxantrone] (M)