DEVELOPMENT OF A MICROFLUIDIC CAPILLARY ELECTROPHORESIS-MASS SPECTROMETRY PLATFORM FOR THE CHARACTERIZATION OF BIOTHERAPEUTIC
PROTEINS
Erin Anne Redman
A dissertation submitted to the faculty at the University of North Carolina at Chapel Hill in partial fulfillment of the requirements for the degree of Doctor of Philosophy in the Department
of Chemistry.
Chapel Hill 2016
iii ABSTRACT
Erin Anne Redman: Development of a Microfluidic Capillary Electrophoresis-Mass Spectrometry Platform for the Characterization of Biotherapeutic Proteins
(Under the direction of J. Michael Ramsey)
This work describes the development of a mass spectrometry (MS) compatible microfluidic capillary electrophoresis (CE) analysis platform capable of characterizing large biomolecules. Initial efforts focused on developing a method for performing highly efficient CE separations of intact proteins with on-line MS analysis. Surface coating technology was
optimized for the analysis of intact proteins. The ability to reproducibly generate uniform surface coatings for CE separations of biomolecules was paramount to achieving efficient separations of these large molecules. The effectiveness of the intact protein coating was demonstrated by analyzing whole blood lysate. The microfluidic CE-MS method proved to be a simple and rapid way to assess hemoglobin glycation and the results compared well with a commercially available technique used to measure glycated hemoglobin. Further application of this technology involved characterizing monoclonal antibody (mAb) based biotherapeutics at the intact level. The size and complexity of these molecules makes them difficult to analyze at the intact level. It was
iv
v
TABLE OF CONTENTS
LIST OF ABBREVIATIONS ... xi
LIST OF FIGURES ... xiv
LIST OF TABLES ... xviii
CHAPTER 1: INTRODUCTION ... 1
1.1 Project History and Motivation ... 1
1.2 Theory of Capillary Zone Electrophoresis ... 2
1.2.1 Separation mechanism ... 2
1.2.2 Performance of CE as a separation technique... 4
1.3 Microfluidic platforms for electrophoretic separations ... 7
1.3.1 Microfluidic CE-ESI device design ... 7
1.3.2 Injection strategies for microfluidic CE-MS... 10
1.4 Surface Coatings for CE-MS. ... 12
1.4.1 Coating technology for microfluidic CE-MS ... 13
1.5 Protein Biotherapeutics ... 16
1.6 Summary ... 18
1.7 Figures and Tables ... 19
vi
CHAPTER 2: ANALYSIS OF HEMOGLOBIN GLYCATION USING MICROFLUIDIC
CAPILLARY ELECTROPHORESIS-MASS SPECTROMETRY ... 35
2.1 Introduction ... 35
2.2 Experimental ... 37
2.2.1 Materials and Reagents ... 37
2.2.2 Sample Preparation ... 37
2.2.3 CE-ESI-MS Device Preparation and Operation ... 38
2.2.4 Data Analysis ... 38
2.3 Results and Discussion ... 39
2.3.1 Analysis of whole blood lysate ... 39
2.3.2 Measurement of HbA1c Levels ... 41
2.3.3 Human Serum Albumin Glycation ... 43
2.3.4 Integration with Portable Mass Spectrometer ... 45
2.4 Conclusions ... 46
2.5 Figures and Tables ... 48
REFERENCES ... 55
CHAPTER 3: DEVELOPMENT OF AN INTEGRATED MICROFLUIDIC CE-MS PLATFORM FOR THE SEPARATION AND CHARACTERIATION OF INTACT MONOCLONAL ANTIBODY VARIANTS ... 58
3.1 Introduction ... 58
3.2 Experimental ... 61
3.2.1 Materials and Reagents ... 61
vii
3.2.3 CE-ESI-MS Device Preparation and Operation ... 62
3.2.4 Data Analysis ... 62
3.3 Results and Discussion ... 63
3.3.1 Optimization of Background Electrolytes for mAb Analysis ... 63
3.3.2 Separation of Intact mAb Charge Variants ... 66
3.4 Conclusions ... 74
3.5 Figures and Tables ... 77
REFERENCES ... 87
CHAPTER 4: CHARACTERIZATION OF INTACT ANTIBODY DRUG CONJUGATE VARIANTS USING MICROFLUIDIC CE-MS ... 90
4.1 Introduction ... 90
4.2 Experimental ... 92
4.2.1 Materials and Reagents ... 92
4.2.2 Sample Preparation ... 92
4.2.3 CE-ESI-MS Device Preparation and Operation ... 93
4.2.4 Data Analysis ... 93
4.3 Results and Discussion ... 93
4.3.1 Separation of Intact Lysine Linked ADC Charge Variants ... 93
4.3.2 Analysis of T-DM1 ... 98
4.3.3 Separation of Intact Cysteine Linked ADCs ... 99
viii
4.5 Figures and Tables ... 105
REFERENCES ... 117
CHAPTER 5: MIDDLE-UP APPROACHES TO BIOTHERAPEUTIC MONOCLONAL ANTIBODY CHARACTERIZATION VIA MICROFLUIDIC CE-MS ... 120
5.1 Introduction ... 120
5.2 Experimental ... 122
5.2.1 Materials and Reagents ... 122
5.2.2 Sample Preparation ... 122
5.2.3 CE-ESI-MS Device Preparation and Operation ... 123
5.2.4 Data Analysis ... 124
5.3 Results and Discussion ... 124
5.3.1 Analysis of Infliximab via Papain Digestion ... 124
5.3.2 Analysis of mAb-D via Papain Digestion ... 126
5.4 Reduction and Alkylation of mAbs. ... 128
5.4.1 Analysis of a Reduced and Alkylated mAb-B. ... 129
5.4.2 Analysis of Reduced and Alkylated mAb-D. ... 131
5.4.3 Analysis of Reduced and Alkylated ADC. ... 132
5.4.4 Analysis of Reduced and Alkylated ADC-C. ... 134
5.5 Conclusions ... 135
5.6 Figures and Tables ... 138
ix
CHAPTER 6: EVALUATION OF TRANSIENT ISOTACHOPHORESIS INTEGRATED WITH MICROFLUIDIC CAPILLARY ELECTROPHORESIS-MASS SPECTROMETRY FOR
BOTTOM-UP PROTEIN MAPPING ... 154
6.1 Introduction ... 154
6.2 Experimental ... 157
6.2.1 Materials and Reagents. ... 157
6.2.2 Lys-C Digestion of mAbs. ... 158
6.2.3 Device Preparation and Operation. ... 158
6.2.4 Data Analysis. ... 159
6.3 Results and Discussion ... 160
6.3.1 Comparison between gated EK and HD injection. ... 160
6.3.2 Utilizing tITP as a concentration enhancement technique for microfluidic CE-MS 161 6.3.3 Evaluation of microfluidic CE-MS for mapping an IgG-2 mAb ... 164
6.4 Conclusions ... 165
6.5 Figures and Tables ... 167
REFERENCES ... 180
CHAPTER 7: CONCLUSIONS AND FUTURE DIRECTIONS ... 182
7.1 Summary of Work ... 182
7.2 Future Directions ... 185
7.2.1 Further characterization and optimization of intact mAb separations ... 185
7.2.2 Analysis of other biotherapeutic proteins ... 187
x
7.2.4 Integration with miniaturized MS ... 188
7.3 Figures and Tables ... 190
REFERENCES ... 193
APPENDIX 1: DEVICE FABRICATION ... 194
APPENDIX 2: COATING PRODECURES FOR CE-ESI DEVICES... 196
Amiopropylsilane coating ... 196
PEGylation of APS coating for protein applications ... 196
APPENDIX 3: CE-MS DEVICE OPERATION ... 199
Voltage and Pressure Control ... 199
Operation of Infusion Devices ... 199
Electrokinetic Injection ... 200
Hydrodynamic Injection ... 200
Figures and Tables ... 202
APPENDIX 4: INSTRUMENT SETTINGS FOR INTACT ANTIBODY ANALYSIS ... 204
Waters LCT-Premier ... 204
Waters Synapt G2... 206
Thermo Exactive Plus EMR ... 207
Figures and Tables ... 209
xi
LIST OF ABBREVIATIONS
ADC Antibody Drug Conjugate
APDIPES 3-(aminopropyl)di-isopropyl-ethoxysilane
APS Aminopropylsilane
APTES 3-aminopropyltriethoxysilane
BGE Background Electrolyte
CE Capillary Electrophoresis
CGE Capillary Gel Electrophoresis
CVD Chemical Vapor Deposition
CZE Capillary Zone Electrophoresis
D Molecular Diffusion Coefficient
Da Dalton
Dapp Apparent Diffusion Coefficient
DAR Drug-to-Antibody Ratio
Δ Efficiency Coefficient
DTT Dithiothreitol
EACA ε-amino-caproic acid
EDTA ethylenediaminetetraacetic acid
EI Extracted Ion
EK Electrokinetic
EOF Electroosmotic Flow
ESI Electrospray Ionization
xii
Fab Antigen Binding Fraction
Fc Crystallizable Fraction
FWHH Full Width at Half Height
G Galactose
GlcNAc N-acetylhexosamine
HSA Human Serum Albumin
Hb Hemoglobin
HbA1c Glycated Hemoglobin
HC Antibody Heavy Chain
HCP Host Cell Protein
HD Hydrodynamic
HDX Hydrogen Deuterium Exchange
HIC Hydrophobic Interaction Chromatography
HPLC High Performance Liquid Chromatography
IAM Iodoacetamide
iCE Imaging Capillary Electrophoresis
IEF Isoelectric Focusing
IEX Ion Exchange Chromatography
IgG γ-immunoglobulins
IMS Ion Mobility Spectroscopy
K Lysine (single letter amino acid code)
LC Antibody Light Chain
xiii
M Mannose
m/z Mass to Charge Ratio
mAb Monoclonal Antibody
MALDI Matrix Assisted Laser Desorption Ionization
MS Mass Spectrometry
N Number of Theoretical Plates
nc Peak Capacity
NHS n-hydroxysuccinimide
NHS-PEG450 methyl-terminated polyethylene glycol n-hydroxy succinimide ester
PEG Polyethylene Glycol
PTM Post Translational Modification
RPLC Reverse Phase Liquid Chromatography
Rs Resolution
SPE Solid Phase Extraction
TCEP tris(2-carboxyethyl)phosphine
TETA triethylenetetramine
tITP Transient Isotachophoresis
µapp Apparent Electrophoretic Mobility µEOF Magnitude of Electroosmotic Flow
µEP Electrophoretic Mobility
v linear velocity
σs2 Spatial Variance
xiv
LIST OF FIGURES
Figure 1.1: Schematic of a basic capillary electrophoresis experimental set-up………...19
Figure 1.2: Diagram of the electric double layer formed at the wall of the capillary………20
Figure 1.3: Diagram of the microfluidic CE device with integrated ESI………..21
Figure 1.4: Photographs of microfluidic CE-ESI devices……….22
Figure 1.5: Injections schemes used in the Ramsey lab for microfluidic CE-MS analysis……...23
Figure 1.6: Separation of standard peptides using an APS surface coating………...24
Figure 1.7: Reaction scheme for applying PEG reagents to microfluidic CE-ESI devices……...25
Figure 1.8: Comparison between intact protein separations performed with an APS coated and an APS-PEG450 coated microfluidic CE-ESI device………..……...………26
Figure 1.9: Diagram of an IgG mAb……….….27
Figure 1.10: Common N-linked glycan structures encountered with IgG based mAbs…………29
Figure 2.1: Microfluidic CE-MS separation of whole blood lysate from a patient with a 5.6% HbA1c……..………48
Figure 2.2: Extracted ion electropherograms and mass spectra for glycated and non-glycated Hb subunits………..………...………...49
Figure 2.3: Whole blood sample spiked with HbA1c standard……….50
Figure 2.4: Correlation plot between clinical HbA1c levels and glycated α-Hb and β-Hb measured by microfluidic CE-MS………..………...……….…51
Figure 2.5: Deconvoluted mass spectra for human serum albumin………...52
Figure 2.6: Photograph of the miniature MS prototype system……….53
xv
Figure 3.1: Infusion of Infliximab in 50% Acetonitrile 0.1% Formic Acid………..77
Figure 3.2: Infliximab infusions using 10% 2-propanol 0.1% Formic Acid, 10% Acetonitrile 0.1% Formic Acid, and 10% Methanol 0.2% Acetic Acid………..………78
Figure 3.3: Infliximab infused with increasing levels of methanol in the background electrolyte………..………..79
Figure 3.4: Separation of 2 mg/mL Infliximab using 10% methanol 0.2% acetic acid and a 23 cm APS coated device………...…...………...……….80
Figure 3.5: Separation of intact Infliximab charge variants using a 23-cm APS-PEG450 coated device at approximately 600 V/cm…………..………81
Figure 3.6: Separation of 1mg/mL Infliximab at varying 2-propanol contents………...82
Figure 3.7: Direct infusion of Infliximab compared to overlaid spectra of the 0K-2K variants generated from the separation in Figure 2a………....……….….83
Figure 3.8: Separation of 1 mg/mL mAb-A using a 23-cm APS-PEG450 coated device at approximately 600 V/cm………...………...84
Figure 3.9: Microfluidic CE-MS characterization of mAb-B ………85
Figure 4.1: Intact charge variant separation of ADC-B………...105
Figure 4.2: Overlaid deconvoluted mass spectra for DAR species 0-4 generated from the electropherogram shown in Figure 4.1………...………...………106
Figure 4.3: Intact charge variant analysis of ADC-B and ADC-B spiked with mAb-A……….107
Figure 4.4: Plot of peak areas with respect to ADC-B concentration……….108
Figure 4.5: Comparison of infusion-MS and intact CE-ESI-MS analysis………...109
Figure 4.6: Degradation of the ADC drug load………...110
Figure 4.7: Intact microfluidic CE-MS analysis of T-DM1………111
Figure 4.8: Intact analysis of mAb-C. ……….112
xvi
Figure 4.10: Raw and deconvoluted mass spectra for the ADC-C fragment………..114 Figure 4.11: Analysis of ADC-C filtrate after filtering with a 100 kDa MWCO filter………...115
Figure 5.1: mAb fragments generated using chemical and enzymatic sample processing for middle-up and middle-down analysis...……….…..………..138 Figure 5.2: Electropherogram showing the separation of 5 mg/mL Infliximab papain digestion in
10% 2-propanol 0.2% acetic acid using a 23 cm APS-PEG450 coated device..…...139 Figure 5.3: Deconvolution of the mass spectra associated with the Fc fragments separated in the
CE domain…………..………...140 Figure 5.4: Intact charge variant separation of mAb-D via microfluidic CE-MS………...141 Figure 5.5: Analysis of papain digested mAb-D……….142
Figure 5.6: Extracted ion electropherograms for the most abundant Fab glycoforms that differ in the degree of glycan sialylation………...………...………...143 Figure 5.7: Comparison between the raw mass spectra for the most abundant Fc fragment, Fab-2
fragment, and unidentified fragments that migrate between the two………...144 Figure 5.8: Microfluidic CE-MS analysis of reduced and alkylated mAb-B……..………..145 Figure 5.9: Microfluidic CE-MS analysis of mAb-D………..146 Figure 5.10: Electropherogram resulting from microfluidic CE-MS analysis of reduced and
alkylated ADC-B………...……...……….…………147 Figure 5.11: Microfluidic CE-MS analysis of reduced and alkylated ADC-C………148 Figure 6.1: Bottom-up mapping workflow involving peptide separation with MS/MS analysis
and data processing…….……..………...………..167 Figure 6.2: Cartoon illustration of tITP………...168 Figure 6.3: Plot of the ratio of amino acid peak areas from separations using gated EK injection
and HD injection versus migration time………..………..169 Figure 6.4: Microfluidic CE-MS analysis of high conductivity samples using gated EK injection
and HD injection………..………..170 Figure 6.5: Microfluidic CE-MS analysis of a MassPrep phosphorylase b tryptic digest using
xvii
Figure 6.6: Relationship between peak capacity, sequence coverage, and injection volume for analysis of the MassPrep phosphorylase b digestion using gated EK injection..…..172 Figure 6.7: Microfluidic CE-MS analysis of peptide standards using HD injection and tITP…173
Figure 6.8: Plot of the FWHH versus injection volume for three of the peptides in the standard mixture………..……….174 Figure 6.9: Relationship between peak capacity, sequence coverage, and injection volume for analysis of the MassPrep phosphorylase b digestion using HD injection with tITP...175 Figure 6.10: Analysis of MassPrep phosphorylase b using HD injections with tITP…………..176 Figure 6.11: Microfluidic CE-MS analysis of a Lys-C digestion of a biotherapeutic mAb……177 Figure 7.1: Analysis of a mAb at various stages of production and purification………...………190
Figure 7.2: Intact charge variant separations via microfluidic CE-MS using a device with a 23 cm separation channel and a device with a 35 cm separation channel……..…………..191 Figure 7.3: Microfluidic CE-MS analysis of a ~20 kDa biotherapeutic glycoprotein………….192
Figure A2.1: Photograph of the in-house built coating apparatus………...198 Figure A3.1: Photograph of a microfluidic CE-ESI device positioned in front of the Waters
LCT-Premier inlet………..……….202 Figure A3.2: Channel schematic for infusion-ESI devices………..202
Figure A3.3: Volumetric flow rate versus applied pressure for performing hydrodynamic fluid manipulation on microfluidic CE-MS devices………...…...………202 Figure A4.1: Ion optics of the LCT-Premier.………..209
Figure A4.2: Ion optics of the Waters Synapt G2………210 Figure A4.3: Comparison between the LCT-Premier and Synapt G2 for intact mAb analysis..211 Figure A4.4: Ion optics of the Exactive Plus………...212
xviii
LIST OF TABLES
Table 1.1: Protein modifications commonly encountered with intact protein analysis………….28 Table 3.1: Glycans and glycoforms of mAb-A identified through cleaved glycan analysis and
intact microfluidic CE-MS separation………..……….…..86 Table 4.1: Migration times and apparent mobilities for DAR species………116 Table 4.2: Area percent of DAR species generated via microfluidic CE-MS, infusion-MS, and
iCE………..………...116 Table 5.1: Peak migration times and electrophoretic mobilities associated with LC/HC species of mAb-B………..………..148 Table 5.2: Peak migration times and electrophoretic mobilities associated with LC/HC species of
mAb-B………..………..148 Table 5.3: Assigned glycoforms of the mAb-B HC………..………148
Table 5.4: Peak migration times and electrophoretic mobilities associated with LC/HC species of mAb-B………..………..148 Table 6.1: Voltages applied to perform gated EK injections………...178
1
1 CHAPTER 1: INTRODUCTION
1.1Project History and Motivation
In the early 1990s, Professor Ramsey’s group at Oak Ridge National Lab was one of the pioneering labs developing microfluidic capillary electrophoresis (CE) technology. Efforts to interface this separation technology with mass spectrometry (MS) carried over to the University of North Carolina in 2004. The success of this was dependent on creating a reliable device design for interfacing with mass spectrometry and then developing surface chemistry to optimize separation performance. The basic device design used for the work presented here was developed in the late 2000s and was shown to effectively couple the CE separation with electrospray
ionization (ESI) and mass spectrometry.1 With a successful CE-ESI chip design in place, research efforts shifted to creating stable surface chemistries to optimize the performance of the CE separation. A gas phase surface treatment strategy depositing a cationic coating on the device channels resulted in separation efficiencies that approached the theoretical limit of CE
separations.2 Subsequent functionalization of this cationic surface with polyethylene glycol chains generates the ability to affect the separation resolution by tuning the electroosmotic flow. Much of my work focused on further developing one of these polyethylene glycol surface coatings to perform CE separations of intact proteins.
2
modifications (PTMs) that occur in a biological system. Often the modifications do not result in a drastic change in net charge or mass so separating the different protein variants is quite
challenging. Many commonly used analytical techniques are not well suited to this type of analysis, or do not always generate sufficient selectivity and specificity. While reversed-phase liquid chromatography is regularly employed for a wide range of applications, when used for intact protein analysis it suffers from poor reproducibility, carry over, and poor peak shape. Extreme measures such as high column temperatures, high pressures, and harsh solvents can improve the analysis, but can be detrimental to the proteins.3–5 This limits its effectiveness as a technique for separating large biomolecules. CE is particularly well suited for this because its separation mechanism is based partly on analyte charge, does not rely on a stationary phase, and can generate very high quality separations. Further integration of this separation technique with mass spectrometry through electrospray ionization represents an incredibly powerful platform for analyzing biomolecules. The following sections outline the principles of CE, the motivation for using microfluidic technology to interface CE with mass spectrometry, and its utility in
analyzing biological samples.
1.2Theory of Capillary Zone Electrophoresis
1.2.1 Separation mechanism
3
this technique is the generation of thermal gradients in the solution due to Joule heating. This significantly limits the separation performance by causing band broadening. A solution to this problem was not realized until the 1980s when zone electrophoresis was performed in a narrow-bore glass capillary which proved to dissipate heat more effectively.7–9 Higher voltages could be used to increase the separation performance and capillary zone electrophoresis (CZE) was
demonstrated as an impactful analytical technique. Since then CZE has become an important tool in industrial labs as well as research labs.
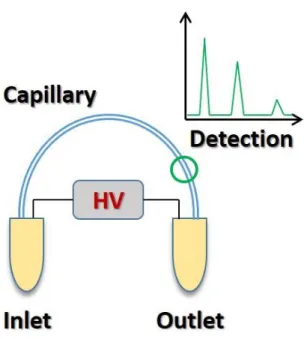
The basic experimental set-up for CZE can be very simple and is often amenable to customization in labs. As illustrated in Figure 1.1, the technique utilizes a capillary that connects inlet and outlet reservoirs containing a buffer solution, a voltage source, and a mode of detection. When a potential is applied to the reservoirs an electric field is generated within the capillary. Once sample is injected, analyte ions separate according to their electrophoretic mobility. The electrophoretic mobility (µEP) of an analyte is a function of the charge on the molecule and its hydrodynamic radius, and is described by the following equation6,10,11:
𝜇𝐸𝑃 = 𝑞
6𝜋𝜂𝑎 (1.1)
where q is the charge on the molecule, η is the viscosity of the buffer, and a is the hydrodynamic radius of the molecule. Thus, the separation mechanism is based on the charge of the analytes in addition to their conformation in solution.
4
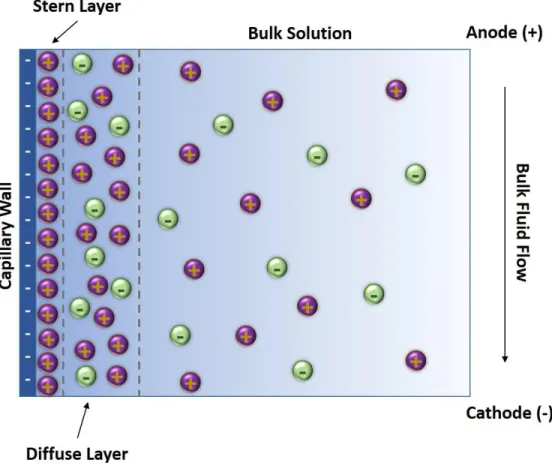
relatively static Stern layer. A second layer of mobile cations forms above the Stern layer creating a positive charge density that dissipates exponentially into the bulk solution. This is termed the diffuse layer, and together the Stern layer and diffuse layer are referred to as the double layer.6,10,11 When a potential is applied as indicated in Figure 1.2, cations in the diffuse layer will migrate toward the cathode. This mass migration of ions generates bulk fluid flow in the capillary that is called electroosmotic flow (EOF). The movement of analytes during the separation is a function of not only the magnitude of their µEP, but also the magnitude of the EOF (µEOF). This is represented as apparent mobility (µapp) and defined as6,7,10:
µ𝑎𝑝𝑝 = µ𝐸𝑃+ µEOF (1.2)
Because it affects how analytes migrate during analysis, the EOF magnitude can have significant effects on the CE separation. Thus, characterizing and optimizing EOF is an important factor during CE method development.
1.2.2 Performance of CE as a separation technique
5
determined from a peak in a separation based on the migration time (t) and the variance of the peak:
𝑁 = 𝑡 2
𝜎𝑡2 (1.3)
where σt2 is the temporal variance of the band.6,13,14
According to CE theory, analyte diffusion is the only source of band broadening for a theoretically optimal CE separation.8,9,12 Therefore, CE should be able to produce very narrow analyte bands and, as a result, very high efficiency separations. According to the Einstein-Smoluchowski equation,6,11 band broadening in a diffusion limited CE separation can be described as:
𝜎𝑠2 = 2𝐷𝑡 (1.4)
where σs2 is the spatial variance of the analyte band, D is the molecular diffusion coefficient, and t is the migration time of the analyte. An apparent diffusion coefficient (Dapp) can be calculated
from a peak in a CE separation. After measuring the FWHH of the peak, Equation 1.5 is used to calculate the temporal variance:
𝜎𝑡2 = (𝐹𝑊𝐻𝐻
6
where FWHH is the width of the peak at half its height and σt2is temporal variance. The
migration time, velocity, and temporal variance are then used to determined Dapp according to
Equation 1.6:
where t is the migration time and v is the linear velocity of the analyte. The ratio of Dappto D can
be a useful metric for evaluating CE performance which has been defined as Δ:2
∆=𝐷𝑎𝑝𝑝
𝐷 (1.7)
As compared to using N, the Δ value is more indicative of the actual CE separation performance relative to the theoretical optimum as it is independent of variable experimental parameters, such as capillary length, applied voltage, and analyte mobility. For a theoretically optimal CE
separation, Dapp is equal to the molecular diffusion coefficient of the analyte and the Δ value
equals 1. Any additional band broadening in the separation would result in a Dapp value greater
than the molecular diffusion coefficient and a Δ value >1.11,15,16 Some of these sources of band broadening include injection broadening, areas of dead volume, analyte adsorption to the capillary wall, and poorly applied surface coatings.
Δ can be related back to N through the following relationship:
𝑁𝑜𝑝𝑡𝑖𝑚𝑎𝑙 = ∆𝑁𝑜𝑏𝑠𝑒𝑟𝑣𝑒𝑑 (1.8)
𝐷𝑎𝑝𝑝 = 𝜎𝑡 2𝑣2
7
Thus, the optimal separation efficiency is decreased by a factor of 1/Δ when excess band broadening is present in the CE system. The following outlines the solutions developed to minimize sources of band broadening and achieve near diffusion limited CE separations.
1.3Microfluidic platforms for electrophoretic separations
The first demonstrations of zone electrophoresis separations in microfluidic channels occurred little more than 10 years after Jorgenson, et al. first demonstrated CZE, and was referred to as “capillary electrophoresis on a chip.”15–22 As with capillaries, the reduced
dimensions of the microfluidic channels effectively dissipated heat resulting from Joule heating and devices could be operated at higher field strengths to improve separation efficiency.17,19,23 The devices were fabricated from planar silicon or glass substrates and described as micro-total analysis systems because they incorporated several functions into the device design including injection, separation, and detection.16–18,22,24 This ability to incorporate multiple functional elements into the device design is a notable benefit of using a microfluidic platform.
1.3.1 Microfluidic CE-ESI device design
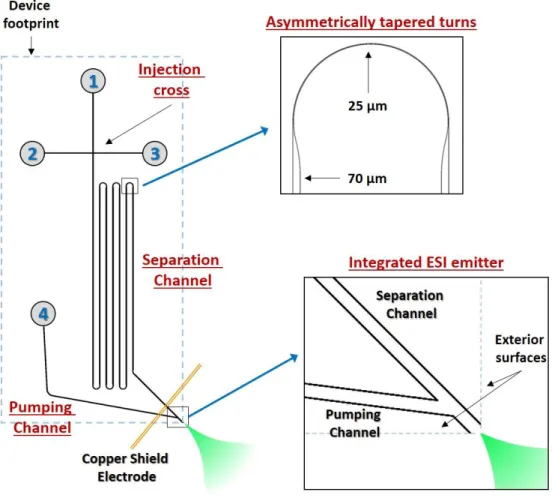
8
separation channel, and an integrated ESI emitter. These elements have all been optimized to minimize on-column and extra-column band broadening.
The functional element for performing sample handling takes the form of a simple injection cross. This is a very common strategy used in microfluidics and has been proven effective in performing rapid, reproducible injections of narrow sample bands.1,20,23 The speed of the injection is a key factor in preserving separation efficiency. For instance, capillary
electrophoresis systems usually rely on physically moving the inlet of the capillary in and out of vials containing buffer and sample. This can result in band broadening because the injected sample plug has time to broaden in the capillary via longitudinal diffusion before voltage is re-applied for the separation. However, with this microfluidic system the time between injection and separation is significantly smaller because fluid is being manipulated directly on the device. This minimizes distortion of the injection plug and band broadening due to injection.
The length of the separation channel in Figure 1.3 from the injection cross to the ESI emitter is 23 cm. To maintain a small footprint, the channel takes six turns before reaching the ESI emitter. The small radius of curvature of these turns can lead to additional band broadening from geometric dispersion of the analyte bands. This is sometimes referred to as the racetrack effect. Briefly, molecules closer to the internal radius of curvature travel around the curve faster than those closer to the exterior radius of curvature. To compensate for this, the turns are
9
This channel serves to establish bulk fluid flow for sustaining ESI. Additionally, reservoir 4 contains the terminating electrode to complete the electric circuit for the CZE separation.
Perhaps the greatest benefit of the microfluidic platform is the ability to directly integrate the ESI emitter into the device design. Integrating CZE separations with ESI-MS is not
straightforward. The interface must supply the necessary potential to generate a field strength for the separation while also satisfying conditions for effective ESI. Most importantly it must
maintain the efficiency of the separation. Fulfilling the first two criteria involves establishing electrical contact with the liquid in the capillary. Since the capillary itself is not conductive, the electrical connection must be made with some other conductive medium. This could be a metal fitting or an electrolyte solution. With inner diameters typically on the order of ≤100 µm making these connections is not trivial. The total column volume could easily be less than 10 µL and, therefore, any connection to the capillary must be extremely precise to avoid introducing significant dead volume. Strategies for interfacing capillary zone electrophoresis to ESI-MS have utilized sheath flow interfaces,26–28 metal coated ESI emitters,29–31 liquid junctions,32 and porous tip emitters.33 However many of these suffer from poor stability and short lifetimes, or result in extra column band broadening from areas of dead-volume in the interface or dilution with the sheath liquid. There are many examples in the literature of using microfluidic CE devices with ESI needles or pulled capillary emitter tips glued to the channel terminus.34–37 While functional, these approaches do not necessarily solve the issues encountered with capillary interfaces and also complicate device fabrication.
10
ESI can either be generated through an electroosmotic pump or by simply applying a head pressure to the pumping reservoir. When voltage is applied to the chip, this channel terminus is held at a potential that can be optimized for establishing ESI. Experimentally we have found this potential to be optimal at approximately 3.5 kV. A photograph of ESI generated off the corner of a microfluidic CE-ESI device is provided in Figure 1.4b. Initial characterization of the integrated ESI interface determined that it performs comparably in terms of signal intensity and stability to a commercial nanospray emitter powered by a syringe pump.1 Because the channels are
seamlessly interconnected in the microfluidic platform, the only dead volume associated with this interface is the space between the intersection of the separation and pumping channels and the exterior surface of the device. This channel segment is typically ≤100 µm in length, which equates to a 70 pL or less area of dead volume. This is less than 0.05% of the total column volume and does not significantly contribute to band broadening. Thus the seamless incorporation of multiple functional elements in the device design through unique channel
architectures resulted in the development of a highly efficient microfluidic CE-ESI-MS interface.
1.3.2 Injection strategies for microfluidic CE-MS
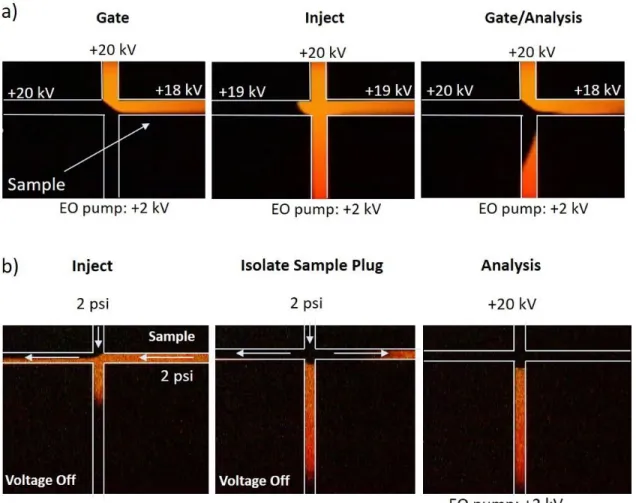
11
electrokinetic injections and hydrodynamic flow based injections. Both strategies are utilized in the work described in this document and will be briefly discussed here.
Electrokinetic injections (EK) are performed through electrical manipulation of ions in the sample and back ground electrolyte (BGE). As depicted in Figure 1.5a, when voltage is applied, ions in the sample migrate from the top reservoir and are diverted to waste to form the gate. Analyte ions are injected by balancing the potentials of the side arms, directing the ions into the separation channel. A sample plug is formed by switching the electric potentials back to the gated position and the analyte ions then separate via zone electrophoresis. The amount injected can be varied by simply adjusting the duration for which the voltages remain in the “inject” configuration. This injection strategy has the benefit of being able to be performed very rapidly. Distortion of the sample plug is minimized so very high separation efficiencies can be achieved. One of the limitations of the gated EK injection is that it is biased based on the electrophoretic mobility of the analyte ions. For analytes that have very similar mobilities, this bias may not be significant enough to affect the analysis, but it becomes more pronounced with more
heterogeneous samples whose analytes span a wide range of mobilities, such as tryptic digests of proteins or small molecule metabolites. Another limitation of the gated EK injection is the limited ability to utilize concentration enhancement techniques. Without this capability, CE-MS analysis can suffer from poor sensitivity due to the small amounts of sample injected.
12
applied to perform the CZE separation. The amount injected is controlled by increasing the duration of the loading step or increasing the pressure used for injection. Because the sample plug is delivered through hydrodynamic flow there is no electrophoretic mobility based bias. Another significant advantage of HD injections is that they make online sample concentration techniques feasible, such as transient isotachophoresis (tITP).
1.4Surface Coatings for CE-MS.
Surface coatings are extremely important for CE analysis to prevent analyte adsorption and control the EOF. An issue affecting separation efficiency of CE is adsorption of
biomolecules to the channel wall through electrostatic and hydrophobic interactions. A common approach to assuage this is to use a surface coating.52–55 For CE-MS analysis of biomolecules these coatings are often neutral polymers or cationic in nature to prevent analyte adsorption through electrostatic repulsion. Polybrene, polyethyleneimine, polyacrylamide, cellulose, dextran, poly(vinyl alcohol), and silane based coatings have been reported in the literature for use with CE-MS.55–63 However, when compared with theoretical separation performance for CE, it can be determined that most separations presented in the literature could be improved several fold.2 For instance, a polyacrylamide based coating was recently reported.62 Δ values were calculated from the electropherograms and the average Δ was found to be 5.5. This indicates that there is significant band broadening in the CE system. If surface coatings are not applied
13
1.4.1 Coating technology for microfluidic CE-MS
Around 2010 the Ramsey group began experimenting with applying surface coatings for CE-MS in the gas phase. A method was developed based on previously published work64 to deposit cationic aminopropylsilanes (APS) on the microfluidic channel surfaces via chemical vapor deposition (CVD). This technique proved to produce highly uniform, dense coatings. APS coatings using trifunctional aminopropyltriethoxysilane (APTES) and monofunctional 3-aminopropyldiisopropylethoxysilane (APDIPES) have generated near diffusion limited separations of fluorescent dyes with Δ values of 1.2 and 1.09 for APTES and APDIPES,
respectively.2 Analyses of peptide and protein standards using an APDIPES coating indicate that the APS surface prevents adsorption of biomolecules and maintains separation efficiency. Figure 1.6 shows the separation of bradykinin, methionine-enkephalin, thymopentin, and angiotensin II, four peptides commonly used to characterize the performance of our devices. The average Δ value for the peptides is 1.4 with an average efficiency of 6.8x10⁵ plates, and according to Equation 1.8 theoretically this could be further improved to 9.5x10⁵ plates. In comparison, most CE separations reported in the literature using coatings generate efficiencies below 200,000 plates for small molecules and in the tens of thousands for intact proteins.54,56 Thus, the gas phase APS coating generates superior CE performance for biomolecules.
A characteristic of these coatings is that there is a high level of EOF. This reduces
14
𝑅𝑠 = 0.177(𝜇𝐸𝑃1− 𝜇𝐸𝑃2)√ 𝑉
𝐷̅(𝜇̅𝐸𝑃+ 𝜇𝐸𝑂𝐹) (1.9)
where µEP1,2are the electrophoretic mobilities of the analyte ions, 𝜇̅𝐸𝑃is the average
electrophoretic mobility, µEOF is the EOF magnitude, 𝐷̅ is the average diffusion coefficient of the
analytes and V is the applied voltage for separation. Based on this equation, Rs is maximized
when the product µEP and µEOF is 0. However, this results in impractical migration times. An
alternative approach is to suppress the EOF. The EOF magnitude can be affected by several factors including buffer ionic strength and pH, or through the use of buffer additives, such as surfactants. However, with CE-MS many of these approaches cannot be utilized due to the need to maintain MS compatibility.
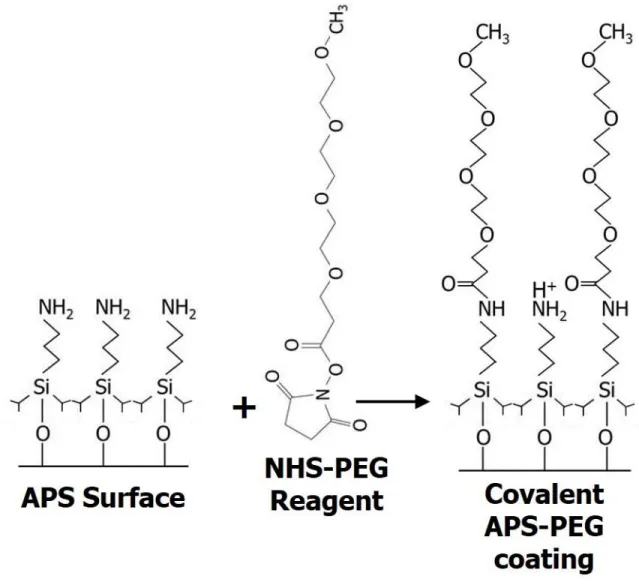
In the Ramsey lab, the approach to reduce the EOF in the separation channel is to use surface chemistry rather than modifying the separation buffer so that it can remain simple and MS compatible. A novel modification to the APS coating has been developed to achieve EOF reduction. The APS coatings are reacted with polyethyleneglycol (PEG) chains as illustrated in Figure 1.7. The PEG chains are available in various lengths and terminate with an
N-hydroxysuccinimide (NHS) ester that reacts spontaneously with the primary amine of the APS coating, forming an amide bond between the APS and PEG chain. Previous work determined that the degree of EOF suppression is dependent on the length of the PEG chain used; the longer the chain, the lower the EOF (unpublished data).65
15
maximize the Rs between similar species. Using this strategy, the APS-PEG combination that
resulted in the highest degree of EOF reduction was chosen to be optimized for intact protein separations. The EOF reduction was characterized through microfluidic CE separations of fluorescent dyes using laser induced fluorescence (LIF) detection and chips without integrated ESI and 3 cm long separation channels. The APS-PEG450 coating was been found to reduce the EOF from approximately 9.5x10⁻⁴ cm2/Vs to 0.8x10⁻⁴ cm2/Vs. However, this coating scheme had not yet been successfully applied to microfluidic CE-ESI devices with longer separation
channels. A modified coating procedure was developed that has successfully been used to coat microfluidic CE-ESI devices with separation channel lengths of up to 46 cm. The optimized coating procedure can be found in Appendix 2.
Figure 1.8 compares the separation of a five protein mixture (carbonic anhydrase I, hemoglobin, human serum albumin, cytochrome c, and lysozyme) using the APS and the optimized APS-PEG450 coating for intact protein separations. It should be noted that due to the EOF suppression, the APS-PEG450 separations were performed in reverse polarity in order to direct cations into the separation channel. As such, the migration times of the proteins are
reversed compared to the separations performed with the APS coating. As theorized, suppressing the EOF increased the separation resolution by enhancing differences in apparent analyte
mobility. From the separations in Figure 1.8a and b, a significant improvement in resolution can be seen between neighboring peaks. The APS-PEG450 device generated a resolution of 2.9
16
unresolved charge variants detected in peak 2. Overall, the APS-PEG450 coating resulted in fast, highly efficient separations of intact proteins with improved resolution as compared to
APDIPES. Additionally, as will be discussed later in the text, this low EOF coating has proven useful for a variety of analyte molecules ranging in size from large intact proteins to small metabolites.
1.5Protein Biotherapeutics
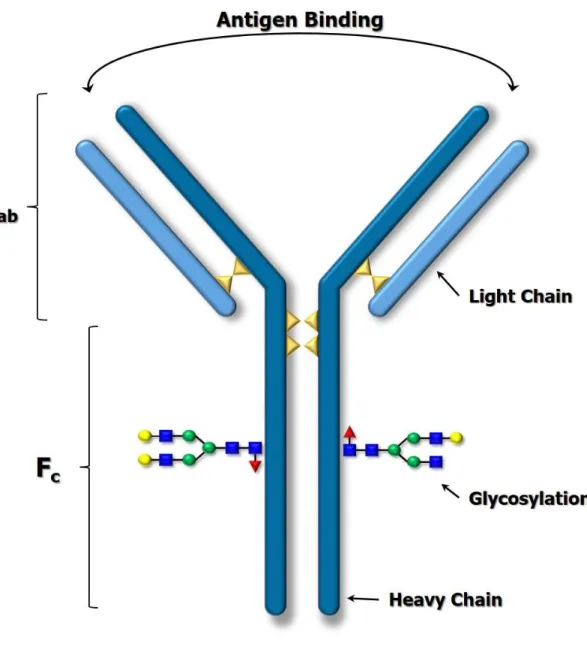
Monoclonal antibody (mAb) based biotherapeutics are the specific targets for developing an analysis platform capable of performing high efficiency intact protein separations with on-line MS analysis. There are several analytical techniques available for separating intact mAb variants, but most are not MS compatible which makes identification of the variants difficult. In order to be used as a therapeutic agent the mAb must be rigorously characterized in order to ensure safety, efficacy, and potency. Post translational modifications can introduce a significant amount of heterogeneity in the final product, and it is likely that mixtures of multiple modifications will co-exist in finished products that may ultimately increase upon storage or degradation.66–69 Consequently, it is critical to characterize mAbs at multiple levels (amino acid sequence to intact structure) to ensure clinically significant bioactivity, drug effectiveness, and quality.
17
classified into four groups (IgG1-4) based on alterations in the Fc domain that typically manifest as differences in the pattern of disulfide linkages.67,70,73 IgGs 1, 2 and 4 are commonly used as biotherapeutics.
Throughout cell culture production, purification, and storage, variations in the mAb structure can result from modifications at the primary and secondary structure level.72,74 Such modifications may include disulfide bond scrambling, glycosylation, deamidation, pyroglutamate formation, C-terminal lysine truncation, oxidation, and amino acid
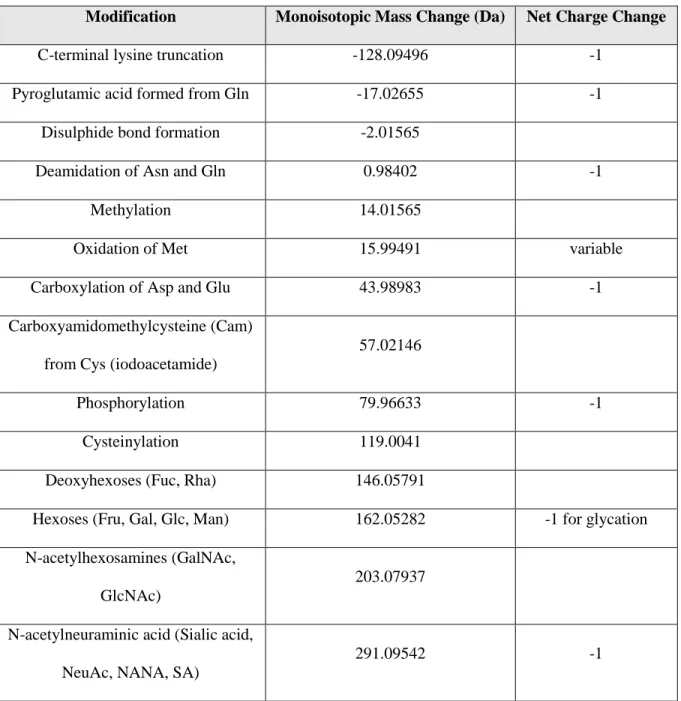
substitutions/misincorporations, in addition to others. These can potentially impact the immunogenic properties of the mAb. Table 1.1 lists several of the common post translational modifications discussed in this document along with characteristic mass shifts and the effect on the net charge of the biomolecule at acidic pH. mAbs have not only charge heterogeneity, but also a significant amount of mass heterogeneity due to glycosylation. Glycosylation is an expected modification of antibodies that can significantly impact their immunogenic properties. A majority of IgG molecules will be glycosylated at a highly conserved site in the Fc domain. Glycosylation in the Fab domain is possible, but is less common.70,75 These structures are often represented with colored shapes and letter abbreviations to more easily visualize and discuss the glycans. Figure 1.10 provides block diagrams as well as the abbreviations for some common glycan structures used throughout this document. IgG glycans are typically biantennary structures with a core fucose (F) residue and branches made up of mannose (M) and
18
1.6Summary
19
1.7Figures and Tables
20
21
22
23
24
Figure 1.6: Separation of standard peptides using an APS surface coating. An average Δ value of 1.4 was achieved with an average efficiency of 680,000 theoretical plates. Fluorescein (*), Methionine enkephalin (1), Bradykinin (2), Angiotensin II (3), Thymopentin (4)
25
26
Figure 1.8: Comparison between intact protein separations performed with a) an APS coated microfluidic CE-ESI device and b) an APS-PEG450 coated microfluidic CE-ESI device. Note that the polarity of the separation is reversed for the APS-PEG450 coated devices so the migration order of the proteins is also reversed. The protein mixture contained carbonic anhydrase I (1), β-hemoglobin (2), α-β-hemoglobin (3), human serum albumin (4) cytochrome c (5) and lysozyme (6). c) Comparison between the most abundant charge state in the mass spectra for the
27
28
Table 1.1: Protein modifications commonly encountered with intact protein analysis
Modification Monoisotopic Mass Change (Da) Net Charge Change
C-terminal lysine truncation -128.09496 -1
Pyroglutamic acid formed from Gln -17.02655 -1
Disulphide bond formation -2.01565
Deamidation of Asn and Gln 0.98402 -1
Methylation 14.01565
Oxidation of Met 15.99491 variable
Carboxylation of Asp and Glu 43.98983 -1
Carboxyamidomethylcysteine (Cam)
from Cys (iodoacetamide)
57.02146
Phosphorylation 79.96633 -1
Cysteinylation 119.0041
Deoxyhexoses (Fuc, Rha) 146.05791
Hexoses (Fru, Gal, Glc, Man) 162.05282 -1 for glycation
N-acetylhexosamines (GalNAc,
GlcNAc)
203.07937
N-acetylneuraminic acid (Sialic acid,
NeuAc, NANA, SA)
29
30
REFERENCES
(1) Mellors, J. S.; Gorbounov, V.; Ramsey, R. S.; Ramsey, J. M. Anal. Chem.2008, 80 (18), 6881–6887.
(2) Batz, N. G.; Mellors, J. S.; Alarie, J. P.; Ramsey, J. M. Anal. Chem.2014, 86, 3493–3500. (3) Vlasak, J.; Ionescu, R. MAbs2011, 3 (3), 253–263.
(4) Fekete, S.; Guillarme, D. LC-GC Eur.2012, 25 (10), 540–550.
(5) Fekete, S.; Guillarme, D.; Sandra, P.; Sandra, K. Anal. Chem.2016, 88 (1), 480–507. (6) Landers, J. P. Handbook of Capillary Electrophoresis, 2nd ed.; CRC Press: New York,
NY, 1997.
(7) Jorgenson, J. W.; Lukacs, K. D. Anal. Chem.1981, 53 (8), 1298–1302. (8) Jorgenson, J. W.; Lukacs, K. D. Clin. Chem.1981, 27 (9), 1551–1553.
(9) Jorgenson, J. W.; Lukacs, K. D. Science (80-. ).1983, 222 (4621), 266–272.
(10) Altria, K. D. Capillary Electrophoresis Guidebook; Altria, K. D., Ed.; Humana Press: Totowa, NJ, 1996.
(11) Li, S. F. Y. Capillary Electrophoresis: principles, practice and applications; Elsevier Science: Amsterdam, 1993.
(12) Giddings, J. C. Sep. Sci.1969, 4 (3), 181–189.
(13) Guiochon, G.; Felinger, A.; Shirazi, D. G.; Katti, A. M. Fundamentals of preparative and nonlinear chromatography, 2nd ed.; Elsevier: San Diego, CA, 2006.
(14) Felinger, A.; Cavazzini, A. Liquid Chromatography; Elsevier, 2013.
(15) Jacobson, S. C.; Koutny, L. B.; Hergenroder, R.; Moore, A. W.; Ramsey, J. M. Anal. Chem.1994, 66 (20), 3472–3476.
(16) Seiler, K.; Harrison, D. J.; Manz, A. Anal. Chem.1993, 65 (10), 1481–1488.
(17) Manz, A.; Harrison, D. J.; Verpoorte, E. M. J.; Fettinger, J. C.; Paulus, A.; Lüdi, H.; Widmer, H. M. J. Chromatogr. A1992, 593 (1-2), 253–258.
31 1926–1932.
(19) Jacobson, S. C.; Hergenroder, R.; Koutny, L. B.; Ramsey, J. M. Anal. Chem.1994, 66, 1114–1118.
(20) Jacobson, S. C.; Hergenroder, R.; Koutny, L. B.; Warmack, R. J.; Ramsey, J. M. Anal. Chem.1994, 66, 1107–1113.
(21) Jacobson, S. C.; Hergenruder, R.; Moore, A. W.; Ramsey, J. M. Anal. Chem.1994, 66
(23), 4127–4132.
(22) Kutter, J. P.; Fintschenko, Y. Separation Methods in Microanalytical Systems; Taylor and Francis Group, LLC: Boca Raton, FL, 2006.
(23) Culbertson, C. T.; Jacobson, S. C.; Ramsey, J. M. Anal. Chem.2000, 72 (23), 5814–5819.
(24) Harrison, D. J.; Seiler, K.; Manz, A.; Zhonghui Fan. In Technical Digest IEEE Solid-State Sensor and Actuator Workshop; IEEE, 1992; Vol. 64, pp 110–113.
(25) Culbertson, C. T.; Jacobson, S. C.; Ramsey, J. M. Anal. Chem.1998, 70, 3781–3789. (26) Kirby, D. P.; Thorne, J. M.; Götzinger, W. K.; Karger, B. L. Anal. Chem.1996, 68 (24),
4451–4457.
(27) Wojcik, R.; Dada, O. O.; Sadilek, M.; Dovichi, N. J. Rapid Commun. Mass Spectrom. 2010, 24 (17), 2554–2560.
(28) Liu, C. C.; Zhang, J.; Dovichi, N. J. Rapid Commun. Mass Spectrom.2005, 19 (2), 187– 192.
(29) Valaskovic, G. A.; Kelleher, N. L.; McLafferty, F. W. Science (80-. ).1996, 273 (5279), 1199–1202.
(30) Smith, R. D.; Olivares, J. A.; Nguyen, N. T.; Udseth, H. R. Anal. Chem.1988, 60 (5), 436–441.
(31) Olivares, J. A.; Nguyen, N. T.; Yonker, C. R.; Smith, R. D. Anal. Chem.1987, 59 (8), 1230–1232.
(32) Foret, F.; Zhou, H.; Gangl, E.; Karger, B. L. Electrophoresis2000, 21 (7), 1363–1371. (33) CAO, P.; MOINI, M. J. Am. Soc. Mass Spectrom.1997, 8 (5), 561–564.
(34) Zhang, B.; Liu, H.; Karger, B. L.; Foret, F. Anal. Chem.1999, 71 (15), 3258–3264. (35) Lazar, I. M.; Ramsey, R. S.; Sundberg, S.; Ramsey, J. M. Anal. Chem.1999, 71 (17),
3627–3631.
32
A2000, 892 (1-2), 195–201.
(37) Lazar, I. M.; Ramsey, R. S.; Ramsey, J. M. Anal. Chem.2001, 73 (8), 1733–1739. (38) Ramsey, R. S.; Ramsey, J. M. Anal. Chem.1997, 69 (13), 2617.
(39) Alarie, J. P.; Jacobson, S. C.; Ramsey, J. M. Electrophoresis2001, 22 (2), 312–317.
(40) Alarie, J. P.; Jacobson, S. C.; Culbertson, C. T.; Ramsey, J. M. Electrophoresis2000, 21
(1), 100–106.
(41) Fu, L.-M.; Yang, R.-J.; Lee, G.-B. Anal. Chem.2003, 75 (8), 1905–1910.
(42) Fu, L.-M.; Yang, R.-J.; Lee, G.-B.; Pan, Y.-J. Electrophoresis2003, 24 (17), 3026–3032. (43) Backofen, U.; Matysik, F.-M.; Lunte, C. E. Anal. Chem.2002, 74 (16), 4054–4059. (44) Gai, H.; Yu, L.; Dai, Z.; Ma, Y.; Lin, B. Electrophoresis2004, 25 (12), 1888–1894.
(45) Luo, Y.; Wu, D.; Zeng, S.; Gai, H.; Long, Z.; Shen, Z.; Dai, Z.; Qin, J.; Lin, B. Anal. Chem.2006, 78 (17), 6074–6080.
(46) Gong, M.; Wehmeyer, K. R.; Stalcup, A. M.; Limbach, P. A.; Heineman, W. R.
Electrophoresis2007, 28 (10), 1564–1571.
(47) Bai, X.; Lee, H. J.; Rossier, J. S.; Reymond, F.; Schafer, H.; Wossner, M.; Girault, H. H.
Lab Chip2002, 2 (1), 45–49.
(48) Chen, C.-C.; Yen, S.-F.; Makamba, H.; Li, C.-W.; Tsai, M.-L.; Chen, S.-H. Anal. Chem. 2007, 79 (1), 195–201.
(49) Dossi, N.; Toniolo, R.; Susmel, S.; Pizzariello, A.; Bontempelli, G. Electrophoresis2010,
31 (15), 2541–2547.
(50) Fu, L.-M.; Yang, R.-J.; Lee, G.-B.; Liu, H.-H. Anal. Chem.2002, 74 (19), 5084–5091. (51) Karlinsey, J. M. Anal. Chim. Acta2012, 725, 1–13.
(52) Haselberg, R.; de Jong, G. J.; Somsen, G. W. J. Chromatogr. A2007, 1159 (1-2), 81–109. (53) Sassi, A. P.; Andel, F.; Bitter, H.-M. L.; Brown, M. P. S.; Chapman, R. G.; Espiritu, J.;
33
(54) Herrero, M.; Bernal, J.; Velasco, D.; Elvira, C.; Cifuentes, A. J. Chromatogr. A2010,
1217 (48), 7586–7592.
(55) Haselberg, R.; de Jong, G. J.; Somsen, G. W. Electrophoresis2013, 34 (1), 99–112.
(56) Huhn, C.; Ramautar, R.; Wuhrer, M.; Somsen, G. W. Anal. Bioanal. Chem.2010, 396 (1), 297–314.
(57) Hardenborg, E.; Zuberovic, A.; Ullsten, S.; Söderberg, L.; Heldin, E.; Markides, K. E. J. Chromatogr. A2003, 1003 (1-2), 217–221.
(58) Ullsten, S.; Zuberovic, A.; Wetterhall, M.; Hardenborg, E.; Markides, K. E.; Bergquist, J.
Electrophoresis2004, 25 (13), 2090–2099.
(59) Martma, K.; Lindenburg, P. W.; Habicht, K. L.; Vulla, K.; Resik, K.; Kuut, G.; Shimmo, R. J. Chromatogr. A2013, 1317, 193–198.
(60) Pattky, M.; Huhn, C. Anal. Bioanal. Chem.2013, 405 (1), 225–237.
(61) Zhang, Y. W.; Zhao, M. Z.; Liu, J. X.; Zhou, Y. L.; Zhang, X. X. J. Sep. Sci.2015, 38 (3), 475–482.
(62) Zhu, G.; Sun, L.; Dovichi, N. J. Talanta2016, 146, 839–843.
(63) Acunha, T.; Simó, C.; Ibáñez, C.; Gallardo, A.; Cifuentes, A. J. Chromatogr. A2016,
1428, 326–335.
(64) Zhang, F.; Sautter, K.; Larsen, A. M.; Findley, D. a; Davis, R. C.; Samha, H.; Linford, M. R. Langmuir2010, 26 (18), 14648–14654.
(65) Batz, N. G. Development and Application of Surface Coatings for Microchip Capillary Electrophoresis-Electrospray Ionization-Mass Spectrometry Analysis of Biological Analytes, University of North Carolina at Chapel Hill, 2014.
(66) Liu, H.; Gaza-bulseco, G.; Faldu, D.; Chumsae, C.; Sun, J. J. Pharm. Sci.2008, 97, 2426– 2447.
(67) Zhang, H.; Cui, W.; Gross, M. L. FEBS Lett.2014, 588 (2), 308–317.
(68) Chelius, D.; Jing, K.; Lueras, A.; Rehder, D. S.; Dillon, T. M.; Vizel, A.; Rajan, R. S.; Li, T.; Treuheit, M. J.; Bondarenko, P. V. Anal. Chem.2006, 78 (7), 2370–2376.
(69) Jones, L. M.; Zhang, H.; Cui, W.; Kumar, S.; Sperry, J. B.; Carroll, J. A.; Gross, M. L. J. Am. Soc. Mass Spectrom.2013, 24 (6), 835–845.
(70) Fekete, S.; Gassner, A.-L.; Rudaz, S.; Schappler, J.; Guillarme, D. TrAC Trends Anal. Chem.2013, 42, 74–83.
34
(72) Arnold, J. N.; Wormald, M. R.; Sim, R. B.; Rudd, P. M.; Dwek, R. A. Annu. Rev. Immunol.2007, 25, 21–50.
(73) Liu, H.; May, K. MAbs2012, 4 (1), 17–23.
(74) Zhang, Z.; Pan, H.; Chen, X. Mass Spectrom. Rev.2009, 28, 147–176.
35
2 CHAPTER 2: ANALYSIS OF HEMOGLOBIN GLYCATION USING MICROFLUIDIC CAPILLARY ELECTROPHORESIS-MASS SPECTROMETRY
2.1 Introduction
Glycated hemoglobin (HbA1c) is characterized by the nonenzymatic addition of a glucose moiety to an amino group in the protein structure.1–4 This modification to hemoglobin (Hb) is more prevalent when blood glucose levels are elevated; as is often the case with diabetes. Due to the lifetime of human erythrocytes (~120 days) HbA1c levels can be used as an indicator of long-term glycemic control in diabetic patients and have become essential to the management of this condition.1,5 A wide variety of methods are available for measuring HbA1c in the clinical setting. Current analysis techniques are typically based on either separation methods or
immunoassays with optical detection, such as ion exchange high performance liquid chromatography (HPLC), boronate affinity HPLC, or immunoturbidimetry.1,5,6
Several studies have been performed evaluating mass spectrometry as an alternative method for assessing Hb glycation.4,7,8 Because a discrete mass is generated for all hemoglobin species introduced into the mass spectrometer, it was theorized that this approach may be less susceptible to common interferences, such as genetic variants and modifications to amino acid side chains under conditions of uremia, aspirin therapy, or improper sample handling.6,9–11 Both matrix assisted laser desorption ionization mass spectrometry (MALDI)-MS12–14 and
36
These studies established mass spectrometry as a potential method for assessing Hb glycation, but the technique has not been adopted clinically due to the high cost of instrumentation and the need for specially trained technicians. These limitations are, however, becoming less significant over time due to the development of small, low cost, and simple to operate mass spectrometers which have the potential to make mass spectrometry more accessible to the clinical lab.21–25
One of the limitations of directly introducing complex mixtures into a mass spectrometer is the high resolving power required to adequately characterize analyte ions in the mass domain. A strategy to simplify the sample mixture before ESI-MS analysis is to use an in-line separation technique. The separation techniques that are currently used in clinics are not compatible with ESI-MS due to the high ionic strength buffers needed for the analysis. However, capillary electrophoresis (CE) has been demonstrated as an MS-compatible alternative to ion exchange HPLC for the separation of protein variants differing in net charge. Previously, CE-MS has been used to analyze proteins from human erythrocytes without enzymatic digestion including
hemoglobin, carbonic anhydrase, and blood protein complexes.26–29 While α-Hb and β-Hbwere resolved from each other, resolution between glycated forms of Hb was not achieved in the CE domain and glycation was not evaluated.
Performing CE on a microfluidic platform offers several advantages over a capillary format because multiple functional elements can be integrated in the design, providing a means to perform sample handling, separation, and direct coupling of the CE separation to MS analysis with minimal added dead volume.30–32 This results in rapid, highly efficient separations.32
37
CE-MS. The analysis is performed under denaturing conditions with minimal sample preparation required and is complete in less than 3 minutes. The method is tested by analyzing whole blood samples with known HbA1c levels and assessing the correlation between the microfluidic CE-MS method and the clinical technique.
2.2 Experimental
2.2.1 Materials and Reagents
Deionized water was generated with a Nanopure Diamond water purifier (Barnstead International, Dubuque, IA). Optima LC/MS grade acetonitrile and acetic acid (99% purity) were obtained from Fisher Scientific (Fairlawn, NJ). The silane coating reagent 3-(aminopropyl)di-isopropyl-ethoxysilane (APDIPES) was purchased from Gelest (Morrisville, PA) and the methyl-terminated polyethylene glycol n-hydroxy succinimide ester (NHS-PEG450) was purchased from Nanocs Inc. (Boston, MA). Trichloro-(1H,1H,2H,2H-perfluorooctyl)-silane was purchased from Sigma-Aldrich (St. Louis, MO). Myoglobin, lysozyme, human serum albumin, human
hemoglobin, and human carbonic anhydrase I were obtained from Sigma-Aldrich (St. Louis, MO). HbA1c standard was purchased from BBI Solutions (Cardiff, UK). De-identified blood samples were obtained from McLendon Clinical Laboratories (University of North Carolina, USA).
2.2.2 Sample Preparation
38
until analysis by microfluidic CE-MS. To prepare samples for microfluidic CE-MS analysis, 10 µL of whole blood was diluted to 1 mL with a 50% acetonitrile 3% acetic acid 47% water solution resulting in a 100x dilution of the blood sample. An aliquot of the 100x blood dilution stock was diluted an addition 10x with the same solution to achieve a final dilution level of 1000x. The sample was then filtered using a Costar Spin-X 0.45 µm nylon centrifugal filter before loading 100 µL into the reservoir of the microfluidic device. It should be noted that a much smaller volume of blood could be used, provided that a final 1000x dilution is achieved.
2.2.3 CE-ESI-MS Device Preparation and Operation
The APS-PEG450 surface coating described in the introduction was used for this analysis and applied according to the procedures in Appendix 2. Bulk fluid flow for sustaining ESI was supplied via electroosmotic pumping.
An aqueous solution of 50/50 acetonitrile/water with 3% acetic acid was used for all analyses. CE-ESI devices were operated by applying and controlling voltages as described in Appendix 3. For this analysis +20kV and +1.5kV were applied to reservoirs 1 and 4,
respectively, which resulted in a field strength of approximately 685 V/cm. A pressure based injection scheme was used for sample manipulation and injection. The samples were injected for 3 seconds at 2 psi, which corresponds to an injection volume of ~0.5 nL.
2.2.4 Data Analysis
39
spectrum was generated for each species by averaging mass scans across the width of the peak at its base. Deconvolution of the resulting mass spectra was performed based on maximum entropy analysis using the MaxEnt1 deconvolution algorithm in the MassLynx software as described previously.33,35–37 The deconvoluted masses were used to identify the protein species. Extracted ion (EI) electropherograms were generated by selecting the two most abundant charge state m/z values with a 1.0 Da selection window. Peak areas in the EI electropherograms were generated through integration in the MassLynx software.
2.3 Results and Discussion
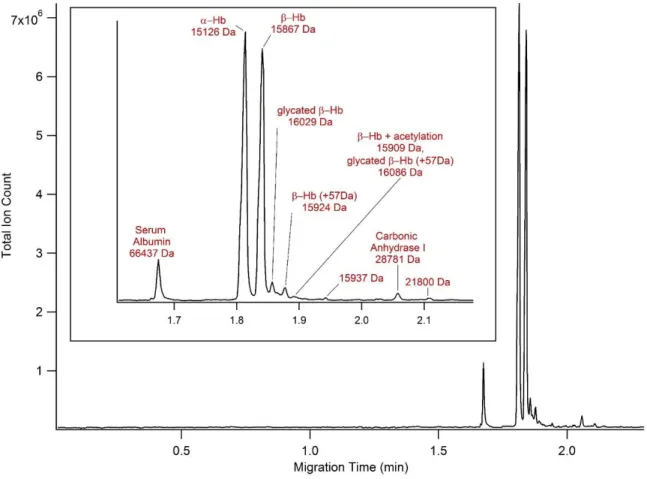
2.3.1 Analysis of whole blood lysate
To assess the application of the APS-PEG450 coated devices to more complex biological matrices, whole blood lysate was analyzed as a representative real-world sample. Microfluidic CE-MS analysis of whole blood lysate samples achieved significantly better separation
40
sequences: 15126.4 Da and 15867.2 Da, respectively.20 Whole blood contains a wide range of protein concentrations and while this method was optimized for Hb analysis, several blood proteins of lower abundance were detected, such as carbonic anhydrase I. Not all minor species were identified and unidentified proteins are labeled by mass only. To achieve better signal for minor blood components additional sample preparation is needed, such as protein concentration or hemoglobin and albumin depletion.
In addition to the main Hb subunit peaks, modified forms of the subunits are detected during analysis. These peaks have lower electrophoretic mobilities than the unmodified subunits, indicating that the modifications to the protein induce a decrease in net charge. Upon
deconvolution, the first variant peak was found to have a mass of 16029 Da. This corresponds to the mass of glycated β-Hb where a sugar moiety is non-enzymatically attached to the globin structure at a primary amine. Although this modification only induces a decrease in net charge of 1, glycated β-Hb is easily separated from the unmodified β-Hb with a resolution of 1.0. As seen in Figure 2.2, generating an extracted ion electropherogram reveals that there is an additional isomer of glycated β-Hb that is not fully resolved from the β-Hb peak. Studies have shown that glycation of the β-Hb subunit occurs preferentially at the N-terminal valine, but can also occur on other amino acid side chains.3,13,17 Due to the relative abundances of the species it was
hypothesized that the more abundant, slower migrating peak is due to glycation at the N-terminal valine (β-HbV1), and the faster migrating, minor peak is due to glycation at a different residue on the β-Hb subunit. To confirm this, a HbA1c standard was spiked into a blood sample
41
detectable in the mass spectrum of the unmodified subunit at 15288 Da, but is not resolved as a separate peak (Figure 2.2c). Although the species is of low abundance, as seen in Figure 2.2a the glycated α-Hb is separated from the unmodified subunit with a resolution of 0.4. Current
methods for measuring HbA1c using optical detection do not provide specific information about glycation on the α-Hb. However, with the microfluidic CE-MS method, information about glycation on both subunits is simultaneously generated without additional analysis steps. Other modifications of β-Hb were observed in addition to glycation. Protein species of masses 15924 Da, 15909 Da and 16086 Da are detected as minor peaks of lower electrophoretic mobility. The 15924 Da and 16086 Da species correspond to a 57 Da increase to the mass of unmodified and glycated β-Hb as designated in Figure 2.1. According to literature, a +57 Da mass shift can be indicative of the addition of a glyoxal moiety to the protein structure. The 15909 Da species was identified as acetylated β-Hb by a +42 Da mass shift. Glyoxal is a reactive oxoaldehyde that will modify proteins, typically at lysine and arginine residues, and has been found to be at increased levels in diabetic patients.4,12,38–40 The reaction of glycated proteins with glyoxal and similar compounds forms advanced glycation end products and advanced oxidation protein products, which have been linked to the development of complications such as
nephropathy, retinopathy, neuropathy, and cardiovascular disease.38,41
2.3.2 Measurement of HbA1c Levels
42
simultaneously. This is information that is not necessarily obtained using methods where the tetramer structure is preserved or the technique is targeted to a specific glycation site.1,5 To calculate the glycated Hb levels from the microfluidic CE-MS data, extracted ion
electropherograms were generated for α-Hb, glycated α-Hb, β-Hb, and glycated β-Hb. The areas of the peaks were used to calculate the %glycated subunit according to Equations 2.1 and 2.2 below where A indicates the area of the peak corresponding to the subscript ID. The peak area of beta hemoglobin glycated at the N-terminal valine was used to calculate the %glycated β-HbV1.
glycated αHb % = Aglycated αHb
AαHb+ Aglycated αHb × 100 (2.10)
glycated βHbV1% = Aglycated βHbV1
AβHb+ Aglycated βHbV1 + Aglycated βHb isomer× 100 (2.11)
A correlation plot was generated for the clinically derived %HbA1c values and %glycated subunit values derived using the microfluidic CE-MS method and a linear correlation was
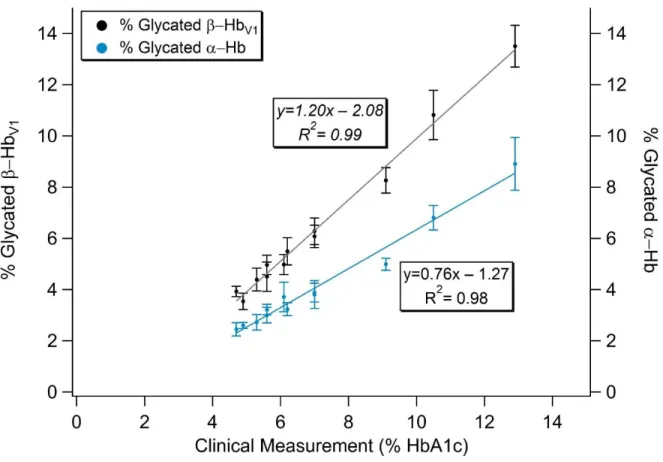
obtained. As illustrated in Figure 2.4, for %glycated β-Hb a slope of 1.20 and an R2 value of 0.99 was seen. The amount of %glycated α-Hb also increased linearly as %HbA1c increased, but was consistently lower.
43
approach the only sample processing required is dilution and filtration. Additionally, the separation prior to MS analysis simplifies the sample entering the mass spectrometer. This alleviates some of the resolving requirements of the instrument making it an option to use a mass spectrometer with limited resolving capabilities for this analysis.
Hemoglobin variants, such as HbAS, HbAC, HbAE, and HbAD, are known to interfere with HbA1c measurements.1,6 These variants are characterized by single point mutations in the amino acid backbone of the β-Hb subunit, and in the case of variants C, E, and D can alter the net charge of the subunit by +1 or +2, and the mass by 1 Da. Separation techniques or mass spectrometry alone may struggle to detect the presence of these variants. Elevated levels of these variants can be misinterpreted as HbA1c peaks with separation techniques that rely on optical detection6, and 1 Da differences are challenging to resolve by mass spectrometry without an MS instrument with high resolving power. However, uniting these two approaches via microfluidic CE-MS provides two means of identification for detecting the presence of the Hb variants: changes in electrophoretic mobility due to charge differences and mass shifts due to structural modifications. Thus, it is possible that the microfluidic CE-MS method could be optimized so that the common Hb variants do not interfere with the measurement of glycated Hb. Additional experiments are needed to assess this using blood containing these Hb variants.
2.3.3 Human Serum Albumin Glycation
As seen in Figure 2.1, human serum albumin (HSA) was clearly detected during the same analysis used to quantify Hb glycation. Glycated albumin has also been found to be an
44
sensitivity of the mass spectrometer used for this analysis made it difficult to identify glycated albumin from the separations optimized for Hb glycation analysis, glycated albumin can be assessed using the same method by simply increasing the injection volume. This overloads the Hb peaks causing broadening and loss of resolution, but the HSA signal nearly triples in
intensity. Thus, both HSA and Hb glycation can be easily assessed by performing back-to-back injections of the sample using injection volumes optimized for each biomarker. To demonstrate this, the patient samples 2, 4, 8, and 12 were reanalyzed with the injection volume increased from 3 seconds to 9 seconds. The spectra associated with the albumin peaks were deconvoluted and are provided in Figure 2.5. Although the glycated forms of albumin are not resolved as separate species, they can still be detected by a mass shift of 162 Da in the deconvoluted
spectrum. Glycated albumin species are detected in patient samples 8 and 12, and at trace levels for patient sample 4. Interestingly, the greatest amount of albumin glycation was not seen in the sample with the highest levels of glycated Hb. Since albumin glycation provides more