LAND-USE CHANGE AND TIDAL CREEK SEDIMENTATION IN COASTAL WATERSHEDS OF NORTH CAROLINA
Charles Dawson Deaton
A thesis submitted to the faculty at the University of North Carolina at Chapel Hill in partial fulfillment of the requirements for the degree of Master of Science in the Department of Marine
Sciences.
Chapel Hill 2018
Approved by:
ii © 2018
iii ABSTRACT
Charles Dawson Deaton: Land-use change and tidal creek sedimentation in coastal watersheds of North Carolina
(Under the direction of Antonio B. Rodriguez)
iv
ACKNOWLEDGEMENTS
Many thanks to Tony, Brent, and Joel for their feedback and assistance throughout this project, and to Molly Bost and Rich Mahoney for their continuous assistance in the field and lab, without which this project would not have been possible. I would also like to thank Anna Atencio, Carson Miller, Naomi Becker, Ivonne Guzman, Rachel Quindlen, Jill Arriola, and Alex Smith for providing help throughout the project with various tasks in the field and lab.
Funding for this project was provided by the Coastal Recreational Fishing License grant program of the North Carolina Department of Environmental Quality, Division of Marine
v
TABLE OF CONTENTS
LIST OF FIGURES ... vi
LIST OF TABLES ... vii
LIST OF ABBREVIATIONS ... viii
CHAPTER 1: LAND-USE CHANGE AND TIDAL CREEK SEDIMENTATION IN COASTAL WATERSHEDS OF NORTH CAROLINA ... 1
Introduction ... 1
Study area ... 4
Methods ... 5
Coring and analysis ... 5
Land use classification ... 6
Results and interpretations ... 7
210Pb-derived sedimentation rates ... 7
Land use and geography ... 11
Discussion ... 17
Conclusions ... 20
APPENDIX A: LAND USE RECLASSIFICATION SCHEME ... 21
APPENDIX B: LAND-USE CHANGE WITH CRS SEDIMENTATION RATES ... 22
APPENDIX C: 2010 LAND USE DATA ... 30
vi
LIST OF FIGURES
Figure 1 – Study site map ... 5
Figure 2 – Excess 210Pb vs. depth profiles ... 8
Figure 3 – Watershed land use, 2010 ... 13
vii
LIST OF TABLES
viii
LIST OF ABBREVIATIONS
CCAP Coastal Change Analysis Program CFCS Constant Flux-Constant Sedimentation CRS Constant Rate of Supply
MAR Mass Accumulation Rate
NC North Carolina
1
CHAPTER 1: LAND-USE CHANGE AND TIDAL CREEK SEDIMENTATION IN COASTAL WATERSHEDS OF NORTH CAROLINA
Introduction
Tidal creeks are common features along the estuarine shorelines of the US Atlantic and Gulf coasts. The term “tidal creek” has previously been used to describe a wide range of systems, including wetland channels and tidal freshwater tributary creeks (Mallin and Lewitus, 2004). For this study, we define tidal creeks as systems which perennially drain low-gradient coastal watersheds that are typically between 1 and 50 km2, are tidal their entire length, and discharge into larger estuaries or lagoons. Typically, tidal creeks are composed of an upper reach, in which the narrow main channel is constricted by salt marshes, and an open-water lower reach, characterized by fringing and island marshes, oyster reefs, tidal flats, and/or seagrass beds. Tidal creeks are distinguishable from wetland channels (which lack a terrestrial watershed), coastal lagoons (which have direct connection to the ocean and lack a fluvial morphology), and drowned river-mouth estuaries (which have large watersheds and extensive non-tidal freshwater reaches).
Tidal creeks can contain a number of important habitats, including marshes, oyster reefs, seagrass beds, tidal flats, and subtidal bare sediment. These ecosystems provide
valuable services, such as nursery habitat for fishes, carbon sequestration, erosion control, and protection from storm damage (Barbier et al. 2011, Grabowski et al. 2012). Tidal creeks function similarly to the larger downstream estuaries into which they merge, and because of their small size and location at the gateway of the terrestrial-marine transition, they may serve as
2
In the centuries following European settlement of North America in the early 18th century, tidal creeks have experienced changes in geometry and hydrology, including channel dredging, infilling and ditching of wetlands, and construction of beam bridges. Additionally, watershed modifications such as agricultural ditching and urban stormwater drainage have altered natural watershed boundaries. In some cases, watershed modifications allow interbasin transfers during high-water events. As with most of the lower Atlantic coastal plain, these watersheds were historically dominated by upland forests and palustrine wetlands (Henry et al. 1995), but today coastal watersheds sustain a wide range of human land uses, including agriculture, silviculture, and residential/commercial development. Development especially has expanded following the rapid increase in population of coastal-shoreline counties across the US, which added 125 persons per square mile between 1970 and 2010. In 2010 the population density in coastal-shoreline counties was 446 persons per square mile, compared to only 105 persons per square mile for the US as a whole (NOAA National Ocean Service, 2013).
Land-use modification has been demonstrated to have impacts on sedimentation regimes in larger watersheds and estuarine systems. Previous work established relationships between forest-clearing and increased sediment delivery in larger estuaries, such as Plum Island Estuary, MA (Kirwan et al. 2011) and the Newport River Estuary, NC (Mattheus et al. 2009). Changes in sediment delivery can have disproportionately large effects, causing estuarine habitat transitions, such as between tidal flats and marshes (e.g. Kirwan et al. 2011; Gunnell et al. 2013; Couvillion et al. 2017), or seagrass beds and bare sediment (e.g. Carr et al. 2010). Such habitat transitions alter the ecological services and impact the human usability of estuarine ecosystems, making sedimentation a concern for managers.
3
Fisheries (NCDMF), placing restrictions on fishing, including banning trawl nets, long haul seines, swipe nets, and dredges, to protect juvenile fishes using the creeks as nursery habitat (NCAC 2007). Further, NCDMF designated sedimentation as one of its four priority habitat issues, specifically noting a need to understand the impacts of sedimentation on the function of PNAs, including tidal creeks (NCDEQ, 2016). Previous studies have documented the impacts of coastal watershed land-use change on fish abundance (Meyer 2011) and water column quality in tidal creeks (e.g. Mallin et al. 2000, Ensign and Mallin 2001, Sanger et al. 2013), but did not address benthic sedimentation. Darrow et al. (2017) made estimates of sedimentation rates in tidal creeks in Grand Bay, MS/AL, but did not investigate changes in sedimentation, and did not attempt to link those rates to land use. Corbett et al. (2017) determined sedimentation rates in three tidal creeks in eastern NC (including Oyster Creek, one of this study’s sites) and noted changes in sedimentation rates in some cores but did not have long-term quantitative land-use change data to compare to their observed changes in sedimentation rates. Corbett et al. (2017) did note that sedimentation rates in their sites generally outpaced the local rate of relative sea-level rise (RSLR), indicating creek infilling, albeit at a rate likely too slow to be noticeable by boaters, fishermen and landowners.
4 Study Area
We selected 12 creeks from across eastern North Carolina (Figure 1), representing a gradient of land use. Six creeks (Oyster, Tusk, Sleepy, Ward, Ware, and Gales) are located in Carteret County, and the other six (Futch, Pages, Howe, Bradley, Hewlett’s, and Whiskey) are located in New Hanover County. Watersheds in Carteret County are generally more rural, with large proportions of agriculture and forest, while watersheds in New Hanover County are generally more urban and suburban, as most of them are in or adjacent to the city of
Wilmington. The creeks near Wilmington have been previously included in studies of land-use change and water quality (e.g. Mallin et al. 2000, Sanger et al. 2013). The creeks included in this study represent 12 out of at least 40 creeks across the 150 km our study area spans. From south to north, local rates of RSLR increase from 2.27 +/- 0.35 mm yr-1 in Wilmington, NC, to 3.00 +/- 0.36 mm yr-1 at Beaufort, NC, and to 4.15 +/- 1.21 mm yr-1, north of our study area at Oregon Inlet, NC (NOAA Tides and Currents stations 8658120, 8656483, and 8652587,
5
Figure 1. Site map. Tidal creek watersheds are outlined in blue over aerial imagery. Left: New Hanover County creeks. Upper right: Carteret County creeks. Bottom right: location of New Hanover and Carteret Counties within North Carolina.
Methods
Coring and analysis
Cores were collected in each creek where channels widened at the transition between the upper and lower reaches. This location was chosen with the expectation that sediments sourced from the watershed would settle onto the creekbed at a higher rate than landward and seaward locations in response to increased flow divergence and a drop in flow velocity as the channel abruptly widens. Therefore, we would expect that these cores would represent
maximum long-term sedimentation rates in the creekbeds. Corbett et al. (2017) took three cores along the central axis of nearby tidal creeks and noted that sedimentation rates were lowest near where our cores were taken and generally higher in the two more seaward cores,
6
the summer of 2016, and extruded in 1-cm sections. As in Croswell et al. (2017), each section was freeze-dried, crushed, split into fine and coarse components using a 63-micron sieve, and weighed. The fine components of each section were subsampled, and 210Pb was determined via isotope-dilution alpha spectrometry, measured by the granddaughter isotope 210Po, which occurs in secular equilibrium with 210Pb.
210Pb is a radioactive isotope in the 238U decay series with a half-life of 22.3 years. When measured by alpha spectrometry, it is detectable to 5-6 half-lives, or approximately 120 years, making it an ideal tracer for multi-decadal timescales. 210Pb is produced in the
atmosphere and in situ by decay of 222Rn, and atmospheric 210Pb is removed by rainfall and introduced to land or water, where it readily adsorbs to sediments. Sediment burial cuts off the atmospheric source, and buried concentrations decay exponentially toward the concentration supported by in-situ production. Thus, using the known half-life, the age of buried sediments can be determined by fitting an exponential curve to measured excess 210Pb concentrations over depth (Goldberg 1963).
Sedimentation rates were constructed from excess 210Pb concentrations for all creeks using a Constant Flux-Constant Sedimentation (CFCS), and a Constant Rate of Supply (CRS) model where appropriate. The CFCS model provides a single sedimentation rate for the entire core or a discrete subsection, and the CRS model is used to determine changes in
sedimentation rate at each sampling interval (Sanchez-Cabeza and Ruiz-Fernández, 2012).
Land use classification
Watersheds for the creeks in Carteret County were delineated by hand in ESRI ArcGIS using digital elevation models (DEMs) from lidar collected in 2014 (NOAA OCM, 2014).
7
as the difference in the highest and lowest 10% of elevation points in the DEMs. Land-use change from 1959 to 1993 was hand-digitized in ESRI ArcGIS from georeferenced aerial imagery from the USGS Aerial Photo Single Frames records collection and National High Altitude Photography (NHAP) program. Land-use was classified as one of forest, cleared forest, agriculture, developed, or water/intertidal. Land-use change from 1996-2010 was obtained from the Coastal Change Analysis Program (CCAP: NOAA, 2016) and reclassified to match the same categories used for the 1959-1993 imagery (reclassification table provided in Appendix A). The earliest reclassified CCAP data displayed little difference from the immediately
preceding manually-digitized land-use classes, and in instances where there was an apparent significant (>5%) change in land use from 1993 to 1996, aerial photographs from 1993 and 1996 were compared to ensure that the change did in fact occur. No major deviations were noted in comparisons, indicating that these two datasets are indeed comparable.
Results and interpretations
210
Pb-derived sedimentation rates
8
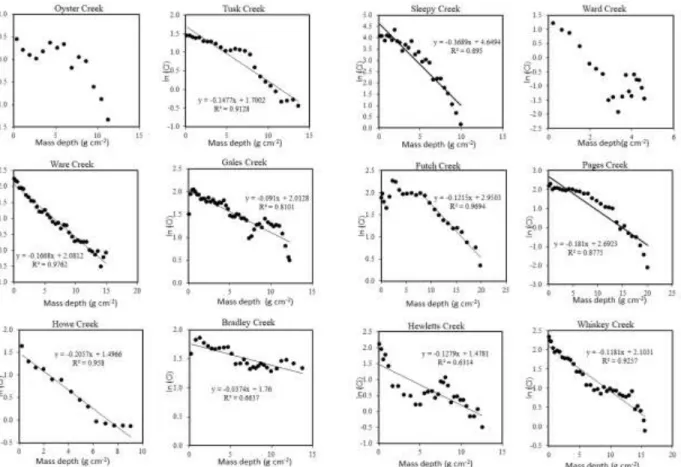
Figure 2. Log-excess 210Pb vs. mass depth profiles for each creek. For all creeks except Oyster and Ward, the fit of the whole-core CFCS model is also plotted; sedimentation rates calculated from the CFCS model are presented in Table 1. Creeks are arranged left to right, geographically from northeast to
9 Creek
Name
Whole-Core CFCS MAR (g cm-2 yr-1)
Whole-Core CFCS SAR (cm yr-1)
Upper CFCS MAR (g cm-2 yr-1)
Lower CFCS MAR (g cm-2 yr-1)
Upper CFCS SAR (cm yr-1)
Lower CFCS SAR (cm yr-1)
Break Year
Tusk 0.21 0.37 0.45 0.16 0.90 0.25 1998.9
Sleepy 0.08 0.20 0.15 0.05 0.44 0.10 1975.8
Ware 0.19 0.43 -- -- -- -- --
Gales 0.34 1.23 0.33 0.11 1.27 0.31 1989.0
Futch 0.26 0.28 -- -- -- -- --
Pages 0.17 0.23 0.35 0.09 0.50 0.12 1977.1
Howe 0.15 0.22 -- -- -- -- --
Bradley 0.83 1.80 -- -- -- -- --
Hewletts 0.24 0.57 0.08 0.21 0.15 0.59 1942.6
Whiskey 0.26 0.53 0.19 0.36 0.47 0.70 1985.8
Table 1. Sedimentation rates by creek, arranged geographically from northeast to southwest along the coast. Mass accumulation rates (MAR) and sediment accumulation rates (SAR) as determined by the whole-core CFCS model, and by the two-segment CFCS model where appropriate. The ‘Break Year’ column indicates the year at which the lower (older) CFCS rate ended and the upper (more recent) CFCS rate began. ‘--’ indicates that the two-segment CFCS model was deemed inappropriate for that core.
10
event, either of which would create a misleading profile using the CRS model. The CFCS model provides a rate of 0.28 cm yr-1 for Futch Creek, excluding the upper 12 cm, and a rate of 1.8 cm yr-1 for Bradley Creek.
In the Ward creek core, the total recovered inventory (approximately 0.2 dpm cm-2 yr-1) was less than one fourth of what was expected based on atmospheric deposition alone (0.8 dpm cm-2 yr-1: Benninger and Wells, 1993), indicating significant erosion of the creekbed sediments. Below 10 cm, dry bulk density was low (0.1-0.2 g cm-3) and grassy debris was observed in the core, which we interpret as the remains of a seagrass bed. This indicates that the creek was once vegetated and likely became net-erosional after the loss of vegetation. While this may have been linked to land-use change, such as agricultural runoff contributing to eutrophication (Kemp et al. 2005) or initial European deforestation and “cut-out-and-get-out” forestry through the 1930s (Phillips, 1997), the lack of a complete 210Pb inventory precludes establishing a definitive temporal relationship. As the watershed with the most total agricultural area and one of only two (along with Ware) with a large proportion of agricultural area (Figure 3), the lack of sedimentation rates from this core prevents us from drawing conclusions about the impacts of agriculture in tidal creek watersheds.
Similar to Ward Creek, the total recovered inventory from Oyster Creek (approximately 0.4 dpm cm-2 yr-1) was less than one half of what was expected based on atmospheric
deposition alone (0.8 dpm cm-2 yr-1), indicating significant erosion of the creekbed sediments in this core also. Data from three cores in Oyster Creek, as reported by Corbett et al. (2017), present total 210Pb inventories in line with expected inventories, further supporting that sedimentation rates obtained from our core would not be representative of Oyster Creek. Accordingly, Ward and Oyster Creeks have been removed from all analyses.
11
rate, while the CRS model indicates an increase followed by a decrease for both cores (changing in the mid-1990s and mid-1980s, respectively: Figure 4g-h). Given that the two-segment CFCS model, as presented here, only provides for one change in sedimentation rate, it is likely that the change is weighted by the upper (more recent) sections of the core, and that the increase-then-decrease pattern suggested by the CRS model is accurate. Ware and Howe, which did not vary enough on excess 210Pb-depth plots to warrant using a two-segment CFCS model, display minor variation but no major changes in CRS-modelled sedimentation rate.
In sedimentation rates obtained from the CRS model, the upper sections of most cores appear to show a rapid increase in SAR but a constant or decreasing MAR (e.g. the upper 7 cm of Ware Creek: Figure 4c). This apparent increase in SAR likely does not represent an actual increase in sediment delivery. SAR is calculated by dividing MAR by the dry bulk density of each section, and as the top few centimeters of each creek are poorly consolidated with high porosity, they have a lower dry bulk density than deeper sections. As organic matter degrades and more inorganic sediment is deposited on the creekbed over time, these poorly consolidated sediments will autocompact to a density similar to lower sections and will ultimately be
preserved as a lower SAR. Accordingly, MAR likely more accurately reflects the trajectory of sedimentation rates than SAR in the upper 5-10 cm of the CRS profiles.
Land-use and geography
12 Creek
Name
Watershed Area (km2)
Mean top 10% elevation (m WGS84) Mean bottom 10% elevation (m WGS84) Watershed Relief (m) Average Watershed Slope (percent rise)
Oyster 11.76 1.82 -0.48 2.3 3.59
Tusk 1.88 2.13 -0.54 2.7 3.68
Sleepy 5.38 2.96 -0.76 3.7 3.32
Ward 14.96 2.47 0.03 2.4 3.19
Ware 1.54 2.35 -0.14 2.5 3.23
Gales 7.78 10.27 0.79 9.5 4.51
Futch 15.44 13.24 1.36 11.9 4.96
Pages 20.35 14.45 -0.14 14.6 5.10
Howe 14.24 13.09 -0.37 13.5 5.25
Bradley 18.67 12.57 0.08 12.5 4.36
Hewletts 30.23 15.25 0.18 15.1 4.33
Whiskey 8.49 10.39 1.65 8.7 4.93
13 A
B
16
Figure 4. CRS-modelled sedimentation rates 1950-2017 and land use as a percent of watershed land area. A: Tusk Creek. B: Sleepy Creek. C: Ware Creek. D: Gales Creek. E: Pages Creek. F: Howe Creek. G: Hewletts Creek. H: Whiskey Creek. A through D are located in Carteret County; E through H are located in New Hanover County. (i) and (ii) denote sediment accumulation rate (SAR) and mass accumulation rate (MAR), respectively. Full-size figures are provided in Appendix C.
The watersheds in Carteret County are generally rural in 2010 (Figure 3), with land use largely consisting of agriculture and forested areas (of which much is used for silviculture), with developed areas making up small proportions of the watersheds. Except for Ware Creek, the Carteret County watersheds had large areas logged during the survey period, and Ward and Ware Creeks have agricultural areas making up 30% and 40% of their watersheds, respectively, which is twice the proportion of all the other creeks. While developed area generally increased through time in Carteret County watersheds, total changes were small (5-15 percent area of individual watersheds) in comparison to forest clearing (20-30 percent area), and were also small compared to the changes in developed area in New Hanover County (up to 70 percent area). Major instances of deforestation occurred between 1975 and 1982 and in the mid-to-late-90s. In Gales Creek (Figure 4d), there are two peaks in sedimentation rate that occur around the same time as these forest clearings, but in Sleepy (Figure 4b) and Tusk Creeks (Figure 4a), no such peaks, or shifts in sedimentation rate, are observed. Ware Creek (Figure 4c), which did not experience sudden large shifts in land use, also does not display sudden changes in
sedimentation rates. The Carteret County watersheds generally have lower slopes, except for Gales Creek (which drains part of the Suffolk Scarp), and are smaller in drainage area than the New Hanover County watersheds, except for Oyster and Ward creeks (Table 2).
By contrast, the watersheds in New Hanover County are generally urban/suburban in 2010, with developed areas making up a majority of the southern four watersheds, and
17
planned subdivisions, though golf courses are also common, and some commercial areas were constructed along major roads. Development increased continuously in all of these watersheds, and sedimentation rates have also generally increased through time in Pages Creek (Figure 4e: through 2017), Hewletts Creek (Figure 4g: through the mid-1990s), and Whiskey Creek (Figure 4h: through the mid-1980s), although sedimentation rates decline in Hewletts and Whiskey Creek after those maxima, despite constant or increasing levels of development. Sedimentation rates in Howe Creek display no apparent relationship to land-use change, despite having experienced the most rapid increase in development (nearly 50% of the watershed area between 1982 and 1996). The New Hanover County watersheds, which drain across two paleoshorelines, have higher slopes than the Carteret County watersheds, and are generally larger in drainage area.
Discussion
Whole-core CFCS models (Table 1 and Figure 2) indicate that only Sleepy Creek (0.20 cm yr-1) is gaining elevation at a rate less than local relative sea-level rise, while Howe (0.22 cm yr-1) and Pages (0.23 cm yr-1) are within error of the RLSR rate, measured at nearby
Wilmington, NC, and the remaining seven creeks exceed RSLR rates. Also including two-segment CFCS and CRS models, all creeks except Howe have SARs exceeding RSLR in recent years (post-2000), indicating that these tidal creeks are infilling and becoming shallower. Shallowing of Bradley and Gales Creeks, which have whole-core CFCS sedimentation rates of 1.8 and 1.2 cm yr-1, respectively, would be very easily noticeable to boaters visiting the creeks repeatedly over a period of years, and may indicate that portions of those creeks that are currently subtidal may soon become intertidal mud flats or be colonized by salt marsh vegetation.
18
between changes in land-use and sediment delivery, establishing a predictive time-series relationship is not feasible with our study design. However, given that in three of four CRS-modelled cores from New Hanover County, sedimentation rates experience notable increases through time in tandem with large increases in developed land area, in some cases approaching 70% of the watershed, we can reasonably conclude that increased developed area in coastal watersheds does lead to higher sedimentation rates in tidal creeks.
The CRS sedimentation profiles in Hewletts and Whiskey Creeks initially increase through time, mirroring development, then plateau and begin decreasing. The more recent decrease in sediment-accumulation rates may indicate that the creekbeds have gained enough elevation to reduce channel cross-sectional area, which would increase bed shear stresses and limit further infilling (Friedrichs, 1995), although the recent sedimentation rates are still in excess of RSLR. This may be an indicator that tidal prism in the creeks is decreasing when marshes in the creeks accrete faster than RSLR, which would decrease bed shear stress and allow
increased sediment deposition (D’Alpaos et al. 2006); however, this would require a knowledge of sedimentation rates from the adjacent marshes to conclude definitively.
Deforestation is less clearly reflected in sediment accumulation rates in tidal creeks. Changes in sedimentation in Gales Creek appear to roughly align with the dates of forest clearing, indicating that forest clearing may cause pulses of sediment deposition. However, we do not observe immediate shifts in response to silviculture operations that occur in Sleepy or Tusk Creeks. Sedimentation rates in these two creeks do increase through time, possibly in relation to repeated forest clearing, although the magnitude of the response is much less than Mattheus et al. (2009) observed in the nearby Newport River.
land-19
use change in the watershed is translated into a change in sedimentation rate at the core location. Accordingly, the larger-area, higher-slope, and sandier Gales Creek and the New Hanover County watersheds (with the exception Howe Creek) may be above such a threshold, allowing land-use change to be reflected in sedimentation rates. This may explain why
deforestation is linked to increased sedimentation in Gales Creek, but not in the smaller, flatter watersheds of Sleepy and Tusk Creeks.
Distinct event peaks area notably missing from CRS-modelled sedimentation profiles. Only Gales and Hewletts display rapid increases and decreases in sedimentation rate over a short time span, but even those peaks are spread out over several centimeters, representing 5-10 years, rather than sediment deposited over one year or less, as might be expected of the sudden denudation of a large area within the watershed. This may be due to any or a
20
scales. These concepts demonstrate a potential for a brief increase in sediment deposition to later be eroded, exported out of the tidal creek system, and not reflected in long-term
accumulation rates.
Conclusions
In our 50-year analysis of land-use change and sedimentation in tidal creeks across eastern North Carolina, we have demonstrated that most creeks are infilling at a rate greater than RSLR, and development and deforestation may result in increases in creekbed
21
APPENDIX A. LAND USE RECLASSIFICATION SCHEME
Mapped land use classification NOAA CCAP LULC classification
Developed Developed, Open Space
Developed, Low Intensity Developed, Medium Intensity Developed, High Intensity
Forest Deciduous Forest
Evergreen Forest Mixed Forest
Palustrine Forested Wetland Estuarine Forested Wetland
Cleared Forest Scrub/Shrub
Palustrine Scrub/Shrub Wetland Palustrine Emergent Wetland Barren Land
Agriculture Cultivated Crops
Pasture/Hay
Grassland/Herbaceous
Water/Intertidal Open Water
22
30
APPENDIX C: 2010 LAND USE DATA
Land use area in 2010 (square meters)
Creek Water/Intertidal Developed Cleared Forest Forest Agriculture
Oyster 2817000 117900 6395400 1973700 465300
Tusk 228600 99900 378900 926100 250200
Sleepy 667800 275400 1027800 2521800 888300
Ward 2205900 298800 3682800 3430800 5342400
Ware 170100 97200 219600 337500 726300
Gales 319500 1462500 1362600 3921300 716400
Futch 722700 5015700 3689100 4736700 1273500
Pages 1835100 8909100 3141900 5397300 1056600
Howe 1404000 9912600 1197000 1580400 136800
Bradley 1347300 11157300 1879200 3870000 401400
Hewletts 2368800 19017900 3017700 5253300 531000
Whiskey 382500 5859000 964800 1174500 103500
Land use area in 2010 (% of total watershed area)
Creek Water/Intertidal Developed Cleared Forest Forest Agriculture
Oyster 24% 1% 54% 17% 4%
Tusk 12% 5% 20% 49% 13%
Sleepy 12% 5% 19% 47% 17%
Ward 15% 2% 25% 23% 36%
Ware 11% 6% 14% 22% 47%
Gales 4% 19% 18% 50% 9%
Futch 5% 32% 24% 31% 8%
Pages 9% 44% 15% 27% 5%
Howe 10% 70% 8% 11% 1%
Bradley 7% 60% 10% 21% 2%
Hewletts 8% 63% 10% 17% 2%
31 REFERENCES
Barbier, E.B., Hacker, S.D., Kennedy, C., Koch, E.W., Stier, A. C., and Silliman, B.R., 2011, The value of estuarine and coastal ecosystem services: Ecological Monographs, v. 81, no. 2, p. 169–193, doi: 10.1890/10-1510.1.
Benninger, L. K. and Wells, J. T., 1993, Sources of sediment to the Neuse River estuary, North Carolina: Marine Chemistry, v. 43, no. 1-4, p. 137-156, doi:10.1016/0304-4203(93)90221-9 Carr, J., D’Odorico, P., McGlathery, K., and Wiberg, P., 2010, Stability and bistability of seagrass ecosystems in shallow coastal lagoons: Role of feedbacks with sediment
resuspension and light attenuation: Journal of Geophysical Research: Biogeosciences, v. 115, no. 3, p. 1–14, doi: 10.1029/2009JG001103.
Crosswell, J.R., Anderson, I.C., Stanhope, J.W., Van Dam, B., Brush, M.J., Ensign, S., Piehler, M.F., McKee, B., Bost, M., and Paerl, H.W., 2017, Carbon budget of a shallow, lagoonal estuary: Transformations and source-sink dynamics along the river-estuary-ocean continuum: Limnology and Oceanography, v. 62, p. S29–S45, doi: 10.1002/lno.10631.
Corbett, D.R., Walsh, J.P., and Zhao, Y., 2017, Impacts of Land-Use Change on Sedimentation in Tidal Creeks of North Carolina, USA: Journal of Geography and Earth Sciences, v. 5, no. 1, p. 1–25, doi: 10.15640/jges.v5n1a1.
Couvillion, B.R., Beck, H., Schoolmaster, D., and Fischer, M., 2017, Land Area Change in Coastal Louisiana (1932 to 2016) Scientific Investigations Map 3381, doi: 10.3133/sim3381. D’Alpaos, A., Lanzoni, S., Mudd, S.M., and Fagherazzi, S., 2006, Modeling the influence of hydroperiod and vegetation on the cross-sectional formation of tidal channels: Estuarine, Coastal and Shelf Science, v. 69, p. 311–324, doi: 10.1016/j.ecss.2006.05.002.
Darrow, E.S., Carmichael, R.H., Calci, K.R., and Burkhardt, W., 2017, Land-use related
changes to sedimentary organic matter in tidal creeks of the northern Gulf of Mexico: Limnology and Oceanography, v. 62, no. 2, p. 686–705, doi: 10.1002/lno.10453.
Ensign, S.H., and Mallin, M.A., 2001, Stream water quality changes following timber harvest in a coastal plain swamp forest: Water Research, v. 35, no. 14, p. 3381–3390.
Friedrichs, C.T., 1995, Stability Shear Stress and Equilibrium Cross-Sectional Geometry of Sheltered Tidal Channels: Journal of Coastal Research, v. 11, no. 4, p. 1062–1074.
Goldberg, E.D., 1963, Geochronology with lead-210, in Proceedings of the Symposium on Radioactive Dating, International Atomic Energy Agency, Vienna, p. 121–131.
Gunnell, J.R., Rodriguez, A.B., and McKee, B.A., 2013, How a marsh is built from the bottom up: Geology, v. 41, p. 859–862, doi: 10.1130/G34582.1.
Henry, James A., Mossa, Joann, and Pirkle, E. C., 1995, Natural Landscapes of the United States, 5th ed., Kendall/Hunt Publishing Company, 400p.
32
W.D., et al., 2005, Eutrophication of Chesapeake Bay: Historical trends and ecological interactions: Marine Ecology Progress Series, v. 303, p. 1–29, doi: 10.3354/meps303001. Kirwan, M.L., Murray, A.B., Donnelly, J.P., and Corbett, D.R., 2011, Rapid wetland expansion during European settlement and its implication for marsh survival under modern sediment delivery rates: Geology, v. 39, no. 5, p. 507–510, doi: 10.1130/G31789.1.
Mallin, M.A., and Lewitus, A.J., 2004, The importance of tidal creek ecosystems: Journal of Experimental Marine Biology and Ecology, v. 298, no. 2, p. 145–149, doi: 10.1016/S0022-0981(03)00356-3.
Mattheus, C.R., Rodriguez, A.B., and McKee, B.A., 2009, Direct connectivity between upstream and downstream promotes rapid response of lower coastal-plain rivers to land-use change: Geophysical Research Letters, v. 36, p. 1–6, doi: 10.1029/2009GL039995.
McKee, B.A., Nittrouer, C.A., and DeMaster, D.J., 1983, Concepts of sediment deposition and accumulation applied to the continental shelf near the mouth of the Yangtze River: Geology, v. 11, p. 631-633.
Meyer, G.F.R., 2011, Doctoral Dissertation: Effects of land use change on juvenile fishes, blue crab, and brown shrimp abundance in estuarine nursery habitats of North Carolina: East Carolina University, 203 p.
New Hanover County, 2015, Open Geospatial Data Portal: Watersheds,
http://geo.nhcgov.com/gis/rest/services/Layers/Watersheds/MapServer/0, accessed June 2016. NOAA (National Oceanic and Atmospheric Administration) National Ocean Service, 2013, National Coastal Population Report, 20p. Available at:
http://oceanservice.noaa.gov/facts/coastal-population-report.pdf.
NOAA OCM (National Oceanic and Atmospheric Administration, Office for Coastal Management), 2016, Coastal Change Analysis Program (C-CAP) Regional Land Cover, www.coast.noaa.gov/ccapftp: accessed December 2017.
NOAA OCM (National Oceanic and Atmospheric Administration, Office for Coastal Management), 2014, North Carolina Floodplain Mapping Program,
https://coast.noaa.gov/dataviewer/#/lidar/search/where:ID=4954: accessed December 2017. NCAC (North Carolina Administrative Code), 2007, rule 15A NCAC 03N.0101. Available at:
http://reports.oah.state.nc.us/ncac/title%2015a%20-
%20environmental%20quality/chapter%2003%20-%20marine%20fisheries/subchapter%20n/subchapter%20n%20rules.pdf.
NCDEQ (North Carolina Department of of Environmental Quality), 2016, North Carolina coastal habitat protection plan, Division of Marine Fisheries, Morehead City, NC, 33p.
33
Sanchez-Cabeza, J.A., and Ruiz-Fernández, A.C., 2012, 210Pb sediment radiochronology: An integrated formulation and classification of dating models: Geochimica et Cosmochimica Acta, v. 82, p. 183–200, doi: 10.1016/j.gca.2010.12.024.
Sanger, D., Blair, A., DiDonato, G., Washburn, T., Jones, S., Riekerk, G., Wirth, E., Stewart, J., White, D., Vandiver, L., and Holland, A.F., 2013, Impacts of Coastal Development on the Ecology of Tidal Creek Ecosystems of the US Southeast Including Consequences to Humans: Estuaries and Coasts, v. 38, no. 1, p. 49–66, doi: 10.1007/s12237-013-9635-y.