CHALLENGES TO MALARIA CONTROL IN THE DEMOCRATIC REPUBLIC OF CONGO AND BEYOND
Mark M. Janko
A dissertation submitted to the faculty of the University of North Carolina at Chapel Hill in partial fulfillment of the requirements for the degree of Doctor of Philosophy in the Department of Geography.
Chapel Hill 2017
ABSTRACT
Mark M. Janko: Challenges to Malaria Control in the Democratic Republic of Congo and Beyond (Under the direction of Michael Emch)
Roughly 40% of the world’s population lives in areas where they are at risk of malaria infection. In the last 15 years, the global health community has made considerable progress in reducing transmission. Despite this progress, a number of challenges to further reductions remain. This dissertation addresses three such challenges.
First, I focus on the ecology that serves as a backdrop to transmission, and focus on the role agriculture may play. In doing so, I attempt to understand how agriculture affects both mosquito behavior, as well as malaria risk in under-5 children in the Democratic Republic of Congo (DRC), a country with one of the world’s highest malaria burdens. My findings from this work suggest that increasing exposure to agriculture is associated with increased indoor biting amongAnopheles gambiaemosquitoes, which may be the mechanism driving the observed association between agriculture and increased malaria risk.
Second, I turn to address insecticide resistance, which may undermine the contributions that bed nets have in reducing transmission. One challenge in monitoring insecticide resistance is the difficulty in obtaining representative samples of mosquitoes. I make some progress in overcoming this limitation using population-based survey data collected from 2009-2016 in 21 countries across sub-Saharan Africa, and find that the effects of bed nets treated with different insecticides vary considerably, and that certain countries need to transition away from using certain insecticides.
Finally, I attempt to understand how malaria spreads. To do so, I leverage genetic data on the
Plasmodium falciaprummalaria parasite from 28 neutral microsatellite markers drawn from
ACKNOWLEDGEMENTS
TABLE OF CONTENTS
LIST OF TABLES . . . ix
LIST OF FIGURES . . . x
LIST OF ABBREVIATIONS . . . xi
CHAPTER 1: INTRODUCTION . . . 1
1.1 Malaria . . . 2
1.1.1 The Disease . . . 2
1.1.2 The Disease Burden and Malaria Control . . . 2
1.1.3 Challenges to Malaria Control . . . 5
1.2 Population Health/Medical Geography . . . 8
1.2.1 Introduction . . . 8
1.2.2 Triangle of Human Ecology . . . 11
1.2.3 Linking Meade, Space, Place, and Spatially Varying Coefficients. . . 13
1.2.4 Spatially Modeling the Effects of Temperature and Precipitation on Malaria Risk . . . 15
1.2.5 Discussion . . . 18
CHAPTER 2: AGRICULTURE AND MALARIA RISK IN UNDER-5 CHILDREN . . . 19
2.1 Methods . . . 20
2.1.1 Study Population . . . 20
2.1.2 Exposure to Agriculture. . . 21
2.1.3 Population, Behavioral, and Environmental Confounders . . . 22
2.1.4 Entomological Monitoring Data . . . 23
2.2 Results . . . 25
2.2.1 Effects of Agriculture on Mosquito Behavior . . . 25
2.2.2 Effects of Agriculture on Malaria Risk . . . 27
2.3 Discussion . . . 30
2.4 From Agriculture to ITN effectivness. . . 33
CHAPTER 3: BED NET EFFECTIVENESS BY INSECTICIDE IN UNDER-5 CHIL-DREN ACROSS SUB-SAHARAN AFRICA . . . 34
3.1 Introduction. . . 34
3.2 Methods . . . 37
3.2.1 Study Design and Data Sources . . . 37
3.2.2 Outcome and Exposure Measures . . . 37
3.2.3 Potential Confounders . . . 37
3.2.4 Statistical Methods . . . 38
3.3 Results . . . 38
3.4 Discussion . . . 45
3.5 From Human Interventions to Human Movement . . . 47
CHAPTER 4: EXPLORING SUBPOPULATION STRUCTURE AND GENE FLOW OF MALARIA PARASITES . . . 48
4.1 Introduction. . . 48
4.2 Methods . . . 49
4.2.1 Study Population . . . 49
4.2.2 Microsatellite Analysis . . . 50
4.2.3 Population Genetic Analyses . . . 50
4.3 Results . . . 52
4.4 Discussion . . . 59
CHAPTER 5: CONCLUSION . . . 60
5.1 Summary of Aims 1-3 . . . 60
APPENDIX I: DERIVATION OF FULL CONDITIONALS FOR AIM 1 . . . 65
6.1 Introduction. . . 65
6.1.1 Motivation for Probit model . . . 65
6.2 Model Structure . . . 67
6.2.1 Model for a single individual . . . 67
6.2.2 Model for individuals within one location . . . 67
6.2.3 Model for all individuals in all locations . . . 68
6.3 Prior Distributions . . . 69
6.3.1 Prior distribution forβ. . . 69
6.3.2 Prior distribution forvec(θ), φ,H. . . 70
6.4 Full Conditional Distributions for all Model Parameters . . . 71
6.4.1 Full Conditional for Latent Variables Y . . . 71
6.4.2 Full Conditional forβ . . . 72
6.4.3 Full Conditional forvec(θ) . . . 73
6.4.4 Full Conditional forH. . . 75
6.4.5 Full Conditional forφ . . . 77
6.4.6 Posterior Predictive Distribution for Intercept/Slope Processes . . . 77
APPENDIX II: SUPPLEMENTARY MATERIALS FOR AIM 1 . . . 80
LIST OF TABLES
Table 2.1 Proportion of eachAnophelesspecies by HLC collection period . . . 25 Table 2.2 Results of hierarchical probit models assessing the effect of agriculture
on indoor biting behavior amongAnophelesmosquitoes in DRC . . . 27 Table 2.3 Descriptive statistics for variables included in hierarchical models . . . 28 Table 2.4 Results for final hierarchical probit regression model on agriculture and
malaria risk . . . 29 Table 3.5 Results from stratified logistic regression models . . . 41 Table 7.6 Fit statistics for hierarchical probit regression models on agriculture and
LIST OF FIGURES
Figure 1.1 Malaria life cycle in human and mosquito . . . 3
Figure 1.2 Plasmodium falciparumendemicity in 2010 . . . 4
Figure 1.3 Triangle of Human Ecology . . . 13
Figure 1.4 Results from spatially varying coefficient regression model . . . 17
Figure 2.5 Study Flow Diagram . . . 21
Figure 2.6 Anophelessurveillence sites and background malaria prevalence . . . 24
Figure 2.7 Relative abundance ofAnophelesmosquitoes by HLC by site . . . 26
Figure 2.8 Hypothetical changes in malaria risk due to agriculture among children under 5 in DRC . . . 30
Figure 3.9 Frequency plot of surveys included in the study . . . 39
Figure 3.10 Proportion of nets treated with different insecticides by country and year . . . 40
Figure 3.11 Odds of malaria infection by insecticide use from each country’s most recent survey . . . 42
Figure 3.12 Odds of malaria infection by insecticide use . . . 44
Figure 4.13 DRC Provinces, major cities, and river network . . . 52
Figure 4.14 Spatial coverage of MIPs panel . . . 54
Figure 4.15 Pairwise plots of first 3 PCA axes . . . 55
Figure 4.16 PCA Outliers. . . 56
Figure 4.17 Evidence from Bayesian Mixture Model . . . 56
Figure 4.18 Mantel test of isolation by distance . . . 57
Figure 4.19 GST-based tests of population structure between urban centers and surrounding regions . . . 57
Figure 4.20 GST-based tests of population structure between increasingly discon-nected regions . . . 58
Figure 7.21 Spatial process from the ‘spatial random intercept’ model . . . 81
LIST OF ABBREVIATIONS
CDC Centers for Disease Control and Prevention DAG Directed Acyclic Graph
DBS Dried Blood Spot
DHS Demographic and Health Survey DRC Democratic Republic of the Congo
FAO Food and Agricultural Organization of the United Nations IBD Isolation-by-Distance
ITN Insecticide-treated net
LLIN Long-lasting Insecticide-treated net MCMC Markov Chain Monte Carlo
MIP Molecular Inversion Probes MIS Malaria Indicator Survey PCA Principal Component Analysis RDT Rapid Diagnostic Test
UI Uncertainty Interval
WHO World Health Organization
CHAPTER 1: INTRODUCTION
Bad air is not good
Malaria means bad air
Therefore it’s not good
1.1 Malaria
1.1.1
The Disease
Malaria is a curable and preventable disease caused by an infection with one of five species of the
Plasmodium parasite known to infect humans: P. falciparum, P. vivax, P. ovale, P. malariae, and P.
knowlesi. The first two of these species are the most prevalent worldwide, but in Sub-Saharan Africa,
Plasmodium falciparum is the predominant species. Worldwide, P. falciparumis also the deadliest.
Following initial infection, and before any symptoms first appear, there is an incubation period that varies from 7 to 30 days, withP. falciparuminfections tending to have shorter incubation times, andP. malariae
longer times. Subsequent clinical symptoms in cases of uncomplicated malaria include fever, sweats, nausea and vomiting, chills, headaches, body aches, and general malaise (CDC, 2015). In more severe cases, such as those cases that go untreated or misdiagnosed, malaria infection may spread to the brain (causing cerebral malaria), lead to kidney failure or other major organ disease, severe anemia, respiratory distress, and death (CDC, 2015). Importantly, clinical symptoms may never emerge in an individual, meaning that infections can also be asymptomatic.
A malaria infection (of any species) is the result of a complex transmission cycle. At the most basic level, malaria is transmitted by an infectious bite from any one of 30-40 species of (female)
Anophelesmosquito. Upon inoculation into a human host, the parasites multiply and grow, first in liver
cells and then in red blood cells, eventually destroying these red blood cells and releasing merozoites (“offspring” parasites) that continue invading other red blood cells. During this blood stage of infection, gametocytes—the sexual stage of the parasite life cycle—circulate in the blood and are taken up by an
Anophelesmosquito during a blood meal. Over the course of the next 10-18 days, these gametocytes
develop into sporozoites through a series of intermediary steps, and then eventually enter the mosquito’s salivary glands, where a further blood meal by the mosquito can transmit these sporozoites to another human, continuing the chain of transmission. Figure 1.1 below shows this life cycle in detail.
1.1.2
The Disease Burden and Malaria Control
Figure 1.1: Malaria life cycle in human and mosquito
Source: CDC
burden (cases) in 2015 are in sub-Saharan Africa, while just five—Nigeria, the Democratic Republic of Congo (DRC), Uganda, Mozambique, and Cote d’Ivoire—accounted for 50% of the total burden (29% Nigeria, 9% DRC, and 4% in Uganda, Mozambique, and Cote d’Ivoire) (WHO et al., 2016). Malaria mortality is similarly concentrated in sub-Saharan Africa, with nine of the ten countries reporting the greatest share of deaths being in the region. Further, of the 429,000 (95% uncertainty interval [UI]
Figure 1.2:Plasmodium falciparumendemicity in 2010
Source: Malaria Atlas Project
95% UI655,000−1,087,000)(WHO et al., 2016). This reduction is largely the result of a renewed commitment to eliminating malaria, starting with the 1998 launch of the Roll Back Malaria campaign, which set out an ambitious goal of halving the malaria burden by 2010 (WHO, 2005) by scaling up interventions with insecticide-treated bed nets (ITNs), indoor residual spraying (IRS), and prompt diagnosis and subsequent treatment using artemisinin-based combination therapies (ACTs).
This set of interventions essentially acts on two fronts. ITNs and IRS work to break the transmission cycle through controlling the vector population with insecticides that either kill a mosquito attempting to bite an individual sleeping under a net, or while resting on a sprayed surface. Additionally, ITNs provide a barrier that both prevents an infected mosquito from transmitting malaria to an uninfected human, or an uninfected mosquito from taking a blood meal from an infected human. Conversely, prompt diagnosis and treatment reduces the parasite population, such that an individual successfully treated will not transmit the parasite to a mosquito, thereby breaking the transmission cycle.
(95% UI5%−14%), respectively (Bhatt et al., 2015). Importantly, this variability does not indicate that one intervention is more effective than another, but may reflect the different times and scales different interventions were deployed. Nevertheless, the impressive reductions in malaria transmission of the last 15 years will depend on the continued success of these interventions. This success, however, is by no means certain.
1.1.3
Challenges to Malaria Control
Despite the dramatic reductions in transmission as a result of large-scale interventions worldwide, a number of challenges may slow or reverse these important gains. In this dissertation, I focus on three.
Aim 1: Agriculture
The first of these challenges is the ecology that serves as the backdrop to transmission. Understanding the ecology of malaria and its vectors is an essential component of successful control (Ferguson et al., 2010). One of the most important factors influencing this ecology is environmental change, and in particular agriculture, which is of concern since over half of global population growth from now until 2050 is expected to occur in Africa, and UN projections suggest the population could double, from 1.2 billion in 2015 to 2.5 billion in 2050, with much of this growth occurring in rural areas (Bongaarts and Casterline, 2013; DESA, 2015; Jayne et al., 2014). Such growth places considerable demand on Africa’s food supply, and governments are considering large-scale agricultural projects to meet this increased need (Jayne et al., 2014; Ijumba and Lindsay, 2001). This is particularly important in the DRC, a country with a high disease burden, and where the Food and Agriculture Organization of the United Nations (FAO) has made agricultural development a top priority (FAO, 2017).
In this study, I make some progress in addressing these limitations by using population-based survey data on under-5 children collected across the DRC, as well as entomological surveillance data collected contemporaneously across six sites representing DRC’s different ecological zones. This aim, then, works to understand possible mechanisms by which exposure to agriculture among both mosquitoes and humans may give rise to increased (or decreased) risk of malaria.
Aim 2: Bed Net Effectiveness
The second challenge addressed in this dissertation relates insecticide resistance, and the ongoing need to monitor the effectiveness of bed nets. Indeed, as noted previously, insecticides play a vital role in bed nets, killing or repelling mosquitoes that come into contact with them, thereby helping to maintain protective efficacy after holes develop in nets through normal wear and tear (Darriet et al., 1984). However, resistance to pyrethroids, the only class of insecticides approved for use in bed nets, has been reported across sub-Saharan Africa (Ranson et al., 2011). Importantly, the epidemiological consequences of increasing levels of insecticide resistance are not clear, with nets failing to protect against malaria in some settings of high insecticide resistance, but dramatically reducing the odds of infection in others (Protopopoff et al., 2007, 2008; Henry et al., 2005).
As with agriculture, however, efforts to understand the potential effect of insecticide resistance have been limited to a small number of study sites, and as such results are not generalizable to the population. Moreover, surveillance efforts are challenged by the inability to representatively sample the vector population, meaning that molecular surveys cannot characterize the prevalence of knock-down resistance in the mosquito population. Molecular markers, however, are not able to detect all forms of resistance, such as behavioral resistance, which occurs when mosquito behavior changes to avoid contact with nets (Ranson et al., 2011; Russell et al., 2011). As a result, much more work is needed in this area. Here too, I make some progress on addressing some of the limitations noted. In this aim, however, I expand the geographic scope beyond the DRC, and investigate the effects of bed nets treated with different insecticides using population-based survey data collected in 21 countries (including DRC) between 2009 and 2016. The rationale for doing so is simple: the burden of disease in Africa is disproportionately high, as are the consequences to malaria control if bed nets lose their efficacy there.
Aim 3: Diffusion
is driven by two processes. Over short distances, malaria spreads by way of mosquitoes that transmit the parasite among a local population. Over longer distances, however, malaria spreads through the movement of people. Understanding human movement and its role in the transmission of vector-borne pathogens has long been of interest in both geography and epidemiology (Prothero, 1977; Meade, 1977; Anderson et al., 1992; Stoddard et al., 2009). That said, understanding such a process poses certain challenges, chief among them the fact that we do not observe population movement in the data most commonly available to the malaria research community. Instead, inferences about population movement, and, more importantly, the spread of malaria, must be inferred from observations on the malaria parasite itself (Carrel et al., 2015; Patel et al., 2014). In this aim, therefore, I use genetic data obtained from malaria parasites infecting 496 children living in 262 communities across the DRC to begin to explore the structure of the parasite population, and hypothetical routes through which it may spread.
The public health rationale for doing so are several-fold, all of them related to informing malaria control. For example, concern is growing worldwide amidst reports of false-negative malaria rapid diagnostic tests (RDT) results—that is, malaria infections that go undetected by RDT. False-negative test results occur in malaria parasites that have deleted the Histidine Rich Protein 2 gene that codes for the target antigen of the most widely-used RDTs. A recent study conducted in the DRC found that approximately 6% of malaria infections in children under 5 years of age harbored this gene deletion, and that the parasite population exhibited considerable spatial and genetic structure (Parr et al., 2016). Importantly, the expansion of this parasite population threatens to undermine a cornerstone of malaria control, since RDTs represent the primary mode of malaria diagnosis, and their use is designed to ensure that only confirmed malaria cases are given antimalarial drugs. Similarly, antimalarial drug resistance has long posed a challenge to malaria control, and was attributed with the rise in prevalence across Africa in the 1980s and 1990s (WHO, 2005). Historically, drug resistant malaria has first arisen in Southeast Asia before spreading to Africa, where it first emerges in the East, followed by the west, suggesting a possible role for Central Africa in the spread (Wongsrichanalai et al., 2002; Taylor et al., 2013). For these reasons, understanding how the parasite population is structured, and exploring the dimensions of human movement and how it contributes to the spread of malaria, can help guide future malaria control efforts in the presence of emerging challenges to control.
1.2 Population Health/Medical Geography
1.2.1
Introduction
map that smooths over noise induced by data features such as small sample sizes within an area. In a public health setting, these models are frequently fit to learn about variability in disease risk over space, with a related aim to identify covariates associated with increased/decreased disease risk (Banerjee et al., 2014; de Ara´ujo et al., 2013; Lawson, 2013). Finally, in the case of point-process data, the central goal is often to identify clustering, for example of disease cases around a point source (Banerjee et al., 2014).
These fields of inquiry are often divided theoretically. For example, Neighborhoods and Health research is generally organized around the principle that place (i.e. context) matters for health (Kearns, 1993), and that particular characteristics of a place (e.g. its composition) influence health outcomes. From a methodological perspective, place is largely defined as membership within a (often geographically-referenced) unit of some sort, be it a school, hospital, county, village, or city. Spatial Epidemiology is also interested in place, but with goals of prediction, smoothing, and clustering, it is the spatial arrangement of these places that tend to be of greater interest. In the broadest sense, then, Neighborhoods and Health tends to focus on estimating the effect a place’s characteristics have on individuals within that place, while spatial epidemiology is concerned with spatial associations between places. Importantly, public health researchers are paying increasing attention to the need to consider both.
Efforts to extend the basic modeling setting above have been done through comparing the two approaches—typically by way of information criteria such as BIC—in an effort to more formally understand contextual and spatial forces underlying health phenomena. Chaix and colleagues, for example, conducted two studies in which hierarchical models implemented aspatially were compared to spatial models on the aggregated data to learn about contextual and residual spatial effects on healthcare utilization and mental health (Chaix et al., 2005a,b). In the study on mental health, the authors also work in a geo-additive modeling framework with a smoothing term for longitude and latitude such that risk can be predicted across the study area, but acknowledge that this framework does not provide inference for the scale and range of the spatial process. Finally, other work is now emerging that identifies contextual (i.e. place) effects on health while also learning about an underlying spatial process. An example of this can be found in the work of Hajat and colleagues, who investigate associations between air pollution and individual and neighborhood level socioeconomic status (Hajat et al., 2013). In that study, the authors write down a hierarchical model to identify the contextual effect of SES on exposure to pollution, but also incorporate spatial correlation in the random effects.
public health, as well as to the advancement of the closely related Neighborhoods and Health and Spatial Epidemiology subfields.
In the following sections, I hope to make progress in this front. In 1.2.2, I briefly outline Meade’s Triangle of Human Ecology, and how it connects to ideas common in Neighborhoods and Health and Spatial Epidemiology. In Section 1.2.3, I then attempt to link Meade’s theoretical framework to the effects of place and space on health. In this section, I pay particular attention to the role of unmeasured confounding, and discuss the theoretical and practical contribution that spatially modeling such confounding has in terms of moving us towards better understanding the processes promoting or preventing health outcomes. In section 1.2.4, I turn to an empirical example, where my focus is to understand the effect of two environmental risk factors on the probability of malaria infection among children under 5 years of age in the DRC. Section 1.2.5.
1.2.2
Triangle of Human Ecology
Meade’s theory owes much of its intellectual origin to the work of Jacques May, who became the “father” of Population Health/Medical geography in the United States with a series of publications throughout the 1950s, beginning in 1950 with “Medical Geography: its methods and objectives,” in which he acknowledged that “today we recognize that disease is a multiple phenomenon which occurs only if various factors coincide in time and space” (May, 1950). He describes the multiple phenomena in terms of causative agents—those agents such asPlasmodiumparasites that actually cause disease—as well as other agents that are necessary for the causative agent to interact with a susceptible human subject, such as theAnophelesmosquito necessary for malaria transmission. While an infectious bite from an
Anophelesmosquito thus represents the causal mechanism by which transmission occurs, he goes on to
note geographical factors relevant for such occurrence. Geographical features are wide ranging, multiple, and disease-specific, though he broadly characterizes those most relevant for human disease as being related in some fashion to heat, light, and humidity.
a central object in population health/medical geographic thought. At the same time, however, May’s thoughts of disease evolved from an initial observation while working as a physician in southeast Asia that his patients both experienced and responded to disease differently than did his patients back in Europe. Following in the French tradition of geography at the time, he began to see disease as being a function of population, environmental, and behavioral traits. In one immediately obvious sense, this work represented the groundwork for what would later be organized into Meade’s theory. Such recognition has further importance in that it points to the need for population health geographers to contribute to understanding underlying diseases processes—i.e. understanding the ‘multiple phenomena’—and not simply describe patterns. Indeed, as John Hunter noted: geographers are not to be “dot mappers,” but have as one of their tasks the need to understand not just pattern, but process (Hunter et al., 1974).
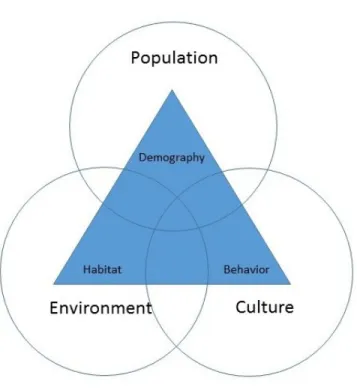
Melinda Meade was a contemporary of Hunter (as well as a former student), and her work built substantially upon his and May’s. In particular, her development of the ‘triangle of human ecology’ is largely a coalescence of both May’s observations of multifactorial determinants of disease and Hunter’s efforts to move the discipline to understand process. For example, in formalizing core dimensions of population health geography, she argues that by considering health as adaptability, this in turn implies that disease is the byproduct of the ways in which humans and their behavior, culture, socioeconomic context and demographic characteristics interact with the environment, be it natural or built. Such a conceptualization leads to the ‘triangle of human ecology’ represented in Figure 1.3 below. In this arrangement, we can see the broader aspects of human, population, and cultural features present, with disease-relevant features from each of these broader categories inside a triangle with differing intersections corresponding to different levels of risk.
Figure 1.3: Triangle of Human Ecology
outcomes (the organizing principal in Neighborhoods and Health), while Meade’s extension of this to consider spatial expression is an intellectual step towards thinking about associations between places (the organizing principal in Spatial Epidemiology). In this sense, then, space and place are integrally linked, implying that efforts to understand both would benefit from being addressed simultaneously.
1.2.3
Linking Meade, Space, Place, and Spatially Varying Coefficients
One reason for this relates to the multiple relevant factors for disease that May describes, and in particular the practical challenge of gathering data on all of them. For example, in the case of malaria or other vector-borne disease, data on the vector is generally not collected, and environmental characteristics such as temperature and precipitation, important to many vector populations, are used in models of disease risk instead. However, the vector population is itself heterogeneous, with, for example, different species ofAnophelesmosquitoes responsible for the transmission of malaria and exhibiting considerable spatial structure. These different species, moreover, have their own habitat preferences, and respond to the same environmental conditions in different ways. Thus, fitting a hierarchical model in which covariate effects are considered invariant over space will not account for any confounding induced by the unobserved and heterogeneous vector population.
geography, with an ongoing need to re-examine the interplay between place and space (Kearns and Joseph, 1993). Thus, even when measurements are made, they almost certainly fail to capture the full dimension of the construct they aim to, and in this case spatially-varying effects may result as well.
While this is certainly a limitation that needs further work by population health scientists and others, I argue here that, even though we cannot perfectly measure characteristics of a place, or even observe them at all, we can still learn about key dimensions of them. Indeed, if we can imagine what component of the hypothesized data generating process is unobserved, such as a vector population, or only partially observed, such as behavior, we can then think through how it might induce a spatially varying coefficient in other parts of the data generating process. Further, we argue that learning about this unobserved process and its structure over space should be afundamentalgoal of Population Health/Medical geography, as it delivers local inferences about place effects on health while simultaneously learning about how these place effects vary over space, thereby integrating both space and place into a rich and flexible modeling framework. To demonstrate this, we turn now to an empirical example. In the tradition of May, who paid particular attention to the importance of the role of heat and water to disease transmission, we take as our example the effects of temperature and precipitation on malaria risk.
1.2.4
Spatially Modeling the Effects of Temperature and Precipitation on Malaria Risk
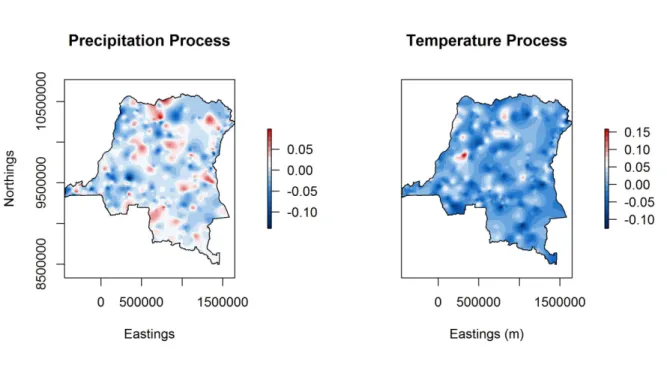
we turn to work in a spatially varying coefficient framework and model the effects of temperature and precipitation on malaria risk in 6,657 under-5 children sampled across 492 communities as part of the 2013-14 Demographic and Health Survey (DHS) administered across the Democratic Republic of Congo.
The details of these data and the model fit will be presented more fully in the next chapter, as well as in Appendix I, where the full conditional distributions for all model parameters are derived. Here, I simply note write down the basic model as follows:
Y =Xβ+Zθ+
Where Y is an6,657×1 vector of binary responses indicating each child’s malaria status, X is a
6,657×3design matrix with an intercept and two covariates: the average temperature (measured in degrees Celcius) during the month of the survey, and total precipitation (in cm) the month prior to the survey.βis a3×1vector of regression coefficients linking covariates to response,Zis a6,657×1,476
random effects design matrix that maps a spatial random effect at locationj, j = 1, . . . ,492to individual i, i= 1, . . . , n. The spatial random effects are thus represented byθ, a1,476×1vector. Finally,is white noise process assumed to follow a standard normal distribution.
We adopt a probit specification and introduce latent normal variables for responseY. Working in a Bayesian setting, we complete the model specification by assigning prior distributions to all unknown parameters in the model. Specifically, we assign a diffuse, zero-centered normal prior for the regression coefficientsβ. We model the spatial random effects as realizations from a zero-centered Gaussian process with separable covariance structure. We assign a low-precision Inverse Wishart prior for the spatial variance-covariance matrix, and use an exponential covariance structure with a uniform prior for the spatial range. We fit the model using MCMC and run the sampler for 120,000 iterations, discarding the first 20,000 as burn in and thinning the Markov chain to collect every tenth posterior sample. Inference for all parameters is thus based on 10,000 posterior draws.
about what may be driving the heterogenetity observed. One possibility is that precipitation measures are considerably noisy, and this may account for some of the variability observed. Beyond concerns over measurement, we may further hypothesize that other factors may contribute to this heterogeneity, such as different land cover types in the DRC. Indeed, as noted, temperature and precipitation are largely used as measures since the vector population is unaccounted for in the model. In particular,An.
gambiaemosquitoes prefer transient pools of sunlit water, such as those created when land is cleared for
agricultural development, thus, regions of higher risk may be explained through understanding the role of agriculture in transmission.
Still other reasons may explain this variability. In the model implemented here, for example, demographic and behavioral covariates are not included in the model, and their inclusion would almost certainly account for some of the spatial variability observed here. Thus, this initial model can be considered the start of a larger model-building effort. For example, additional models would include other covariates and consider different correlation structures to address different hypotheses about the underlying data generating process, with model comparisons proceeding via different measures of fit, such as DIC or out-of-sample based approaches.
1.2.5
Discussion
Ultimately, the message from this introduction is that malaria is a complex disease that exhibits considerable heterogeneity. This heterogeneity arises from multiple sources, including a vector population that is heterogeneous both in its species composition and behavior, which changes as a function of human interventions. Further, human behaviors are themselves heterogeneous, and environmental processes are as well. Thus, efforts attempting to understand a heterogeneous disease process fundamentally need to try to identify and understand the sources of such heterogeneity.
CHAPTER 2: AGRICULTURE AND MALARIA RISK IN UNDER-5 CHILDREN
Understanding the ecology of malaria and its vectors is an essential component of successful control (Ferguson et al., 2010). One of the largest factors influencing this ecology is land use and anthropogenic land use change, such as agricultural development (Patz et al., 2004, 2000). Agriculture is of concern since over half of global population growth from now until 2050 is expected to occur in Africa, and UN projections suggest the population could double, from 1.2 billion in 2015 to 2.5 billion in 2050, with much of this growth occurring in rural areas (Bongaarts and Casterline, 2013; DESA, 2015; Jayne et al., 2014). Such growth places considerable demand on Africa’s food supply, and governments are considering agricultural projects to meet this increased need (FAO, 2017; Boserup, 2005; Jayne et al., 2014; Ijumba and Lindsay, 2001). However, agricultural projects may reverse reductions in malaria transmission over the past decade, since expanding agriculture may produce habitats favored byAnopheles gambiae
mosquitoes, sub-Saharan Africa’s most efficient malaria vector. Specifically,An. gambiaemosquitoes prefer transient sunlit pools of water with little or no surrounding vegetation (Gimnig et al., 2001; Sinka et al., 2010).
on risk (Yang et al., 2008). Thus, given the diversity of vectors and of human ecosystems, much more work in this area is needed.
In this study, we examine the relationship between agriculture, the mosquito population, and malaria risk using a population-based survey of under-5 children living in the Democratic Republic of Congo (DRC), a large, ecologically diverse country containing 47% of Africa’s potential agricultural land, and accounting for 10% of global malaria deaths in 2015 (Jayne et al., 2014; WHO et al., 2016). We also use contemporaneous entomological monitoring data collected over time across the DRC’s ecological zones. Doing so allows us to consider possible mechanisms through which increases in agriculture may lead to a hypothesized increase in malaria risk. Findings from this study can therefore provide insights into a hypothesized but understudied driver of transmission.
2.1 Methods
2.1.1
Study Population
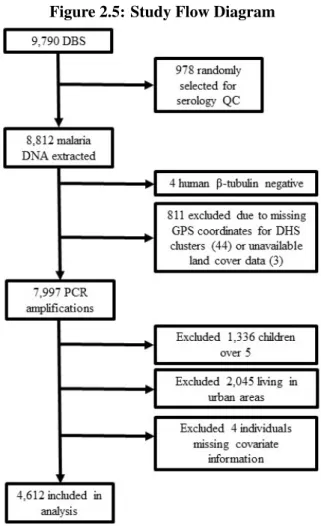
The study population for this analysis consists of rural, under-5 children sampled as part of the 2013-14 DRC Demographic and Health Survey (DHS), a population-based cluster household survey. The sampling methods for the DHS are described elsewhere (Hancioglu and Arnold, 2013). The outcome for this study is each child’s malaria status, as determined by polymerase chain reaction (PCR) analysis of dried blood spots (DBS) according to a previously published protocol (Singh et al., 1999; Taylor et al., 2011). A total of 8,808 DBS from children were available for this study. Spatial information and land cover data were unavailable for 44 and 3 DHS clusters, respectively, reducing the sample to 7,997. The DHS does not provide survey information on over-5 children, and these children were excluded. Finally, we include only children living in rural areas because agriculture in DRC is predominantly rural. This reduced the sample to 4,616 participants in 331 survey clusters, 4,612 of whom had no missing data. Figure 2.1 shows a flow diagram for the study.
project. No corresponding survey data was available for 112 blood spots, leaving 8,700 blood spots for this study. Of these, 7,250 were samples from children under five years of age. These data were then merged to the DHS spatial data, which reduced the sample to 6,661 children under five (owing to the lack of spatial information for 44 survey clusters) with a PCR-confirmed result. Finally, given that interest here is in agriculture, a predominantly rural phenomenon, we include only those children living in rural areas, reducing the sample to 4,616 participants in 331 survey clusters, 4,612 of whom had no missing data on covariates of interest. Figure 2.5 shows a flow diagram for the study.
Figure 2.5: Study Flow Diagram
2.1.2
Exposure to Agriculture
one from the International Geosphere-Biosphere Programme (IGBP), the other from the University of Maryland (UMD). The IGBP measure includes two agricultural land cover classes, while the UMD measure includes one. We consider both classification schemes, and estimate the percent agricultural land cover within ten kilometers of each DHS cluster for each, then average the two to lessen the effect any extreme measures in one classification may have on inference. We chose a radius of ten kilometers since it represents the maximum flight distance of a female, human blood fedAn. gambiaemosquito, representing the maximum extent over which human and mosquito populations interact (Kaufmann and Briegel, 2004).
2.1.3
Population, Behavioral, and Environmental Confounders
Population, behavioral, and environmental confounders are derived from the DHS and satellite remote sensing sources. Data extracted from the DHS include child age, sex, individual and community bed net use, altitude, and household construction materials—which represent both socioeconomic status and paths/barriers to mosquito entry. Individual bed net use was measured as use of a net treated with deltamethrin or alphacypermethrin, permethrin, or other kind of net. We consider net use in this manner owing to high levels of observed insecticide resistance to permethrin and remaining efficacy of deltamethrin and alphacypermethrin (AIRS, 2014; Levitz et al., 2017). Similarly, we calculate community bed net coverage according to the proportion of other respondents in the community sleeping under a deltamethrin- or alphacypermethrin-treated net, since these nets still possess a knockdown effect. Household wall construction was coded as natural (no walls or cane/palm/trunks), rudimentary (e.g. bamboo with mud), finished (cement), or other material according to the DHS. Roof construction was dichotomized as either finished (e.g. metal) or not, owing to small sample sizes in the rudimentary (27) and other (10) categories.
within a ten-kilometer radius of each survey cluster and averaged. Our measures of temperature and precipitation are consistent with other work on malaria in DRC (Messina et al., 2011).
2.1.4
Entomological Monitoring Data
We consider the effect of agriculture on the vector population using entomological surveillance of
An. gambiae s.l.(An. gambiae, hereafter),An. paludis,An. moucheti s.l.(An. moucheti, hereafter), and
An. funestus s.l.(An. funestus, hereafter). In 2013, the Africa Indoor Residual Spraying (AIRS) Project
conducted two rounds of mosquito surveillance (in August and November) across four sites chosen to represent equatorial, tropical, and mountainous ecological regions of the country. In 2014, three more sites were added, yielding seven total sites for 2014 surveillance, which occurred in February, April, and July. One of these sites was in an urban setting (Kinshasa), and was excluded since interest is in rural transmission (AIRS, 2014). Figure 2.6 maps each site together with background malaria prevalence in under-5 children. Mosquito collection occurred both indoors and outdoors using human landing catch (HLC), and we assume those caught indoors were intending to bite, and treat them as indoor biting mosquitoes.
In each site, eight households were chosen and HLC was performed in two of them each night for four nights by two mosquito collectors between 1800 and 0600 hours. One collector performed HLC indoors and the other outdoors. The two collectors switched places hourly to prevent mosquito attraction bias. Collectors were given malaria chemoprophylaxis. Mosquito species identification was done morphologically. Measuring agriculture, temperature, and precipitation around mosquito surveillance sites followed the same protocol as that used for the DHS survey.
2.1.5
Statistical Analyses
Probit regression models implemented in a hierarchical Bayesian setting were used to assess 1) the relationship between agriculture and mosquito indoor biting behavior, and 2) the relationship between agriculture and malaria risk. Three separate models were fit for indoor biting behavior among An.
gambiae,An. paludis, andAn. funestusmosquitoes. Insufficient numbers ofAn. mouchetimosquitoes
Figure 2.6:Anophelessurveillence sites and background malaria prevalence
All models are fit in a Bayesian setting. Continuous covariates (age, agriculture, temperature, precipitation, community bed net coverage) are first centered and scaled, such that regression coefficients represent effects per standard deviation increase in these variables. Regression coefficients are assigned standard normal prior distributions, while spatial structure is modeled using a Gaussian process with exponential covariance, consistent with other spatial models of malaria transmission (Hay and Snow, 2006; Hay et al., 2009). We implement the model using Markov chain Monte Carlo (MCMC) and run the sampler for 120,000 iterations, discarding the first 20,000 as burn in and thinning the Markov chain to collect every 10th posterior sample, such that final inferences are based on 10,000 posterior samples. Performance for models on malaria risk is assessed using Brier scores, area under the ROC curve, and DIC, with final inferences based on the best fitting model. Appendix I derives the full conditional distributions for all model parameters.
2.2 Results
2.2.1
Effects of Agriculture on Mosquito Behavior
An. gambiaeandAn. paludiswere the dominant vectors across all sites and over all time periods,
making up 48% and 51% of 5,713 Anopheles caught by HLC, respectively. An. funestusand An.
mouchetiwere relatively rare across all sites and over all collections. Further, relative abundance between
An. gambiaeandAn. paludisvaries in some sites, with relatively moreAn. gambiaefrom November
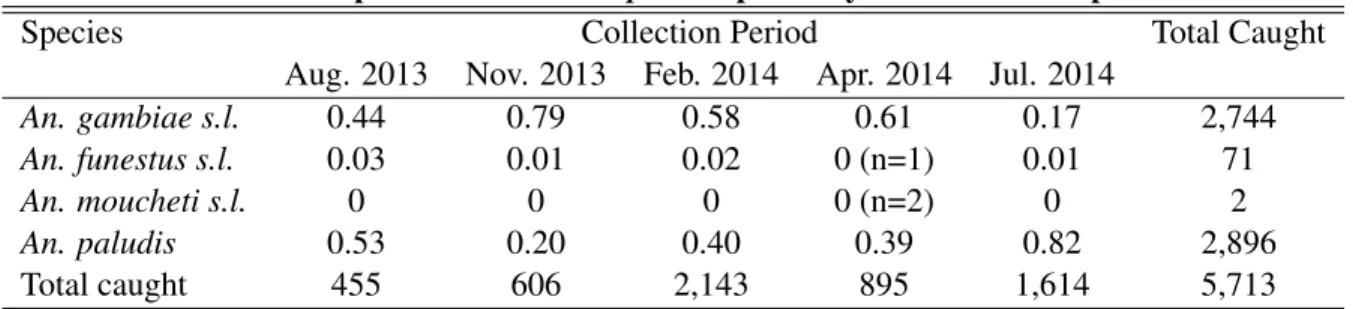
through April, and moreAn. paludisduring July and August. In the Kapolowe site, relative abundance appears unrelated to season, withAn. gambiaeabundance declining over the monitoring periods. Table 2.1 shows the relative abundance of each species caught over time, while Figure 2.3 presents these relative proportions over time at each site.
Table 2.1: Proportion of eachAnophelesspecies by HLC collection period
Species Collection Period Total Caught
Aug. 2013 Nov. 2013 Feb. 2014 Apr. 2014 Jul. 2014
An. gambiae s.l. 0.44 0.79 0.58 0.61 0.17 2,744
An. funestus s.l. 0.03 0.01 0.02 0 (n=1) 0.01 71
An. moucheti s.l. 0 0 0 0 (n=2) 0 2
An. paludis 0.53 0.20 0.40 0.39 0.82 2,896
Figure 2.7: Relative abundance ofAnophelesmosquitoes by HLC by site
Agricultural coverage across all six sites ranged from 3.7% to 25.3% (mean=15%, sd=7%), while total precipitation ranged from 0 to 26.5 centimeters (mean=7.9, sd=94.8). Average temperature ranged from 19 to 26 degrees Celsius (mean=24, sd=2). Results from probit models on indoor biting behavior amongAn. gambiae mosquitoes suggest that increasing exposure to agriculture was associated with increased probability of indoor biting with high posterior probability (estimate:0.22, 95% uncertainty interval [UI]: −0.21−0.68; Pr(estimate> 0) = 0.85), controlling for available confounders. Given a 15% increase in agricultural cover, this estimate is associated with risk differences in indoor biting ranging from0.14(95% UI:−0.19−0.30) to0.27(95% UI:−0.22−0.67), depending on factors such as season (month of surveillance), temperature, and precipitation. Conversely, there was no indoor biting response to agriculture amongAn. paludismosquitoes (estimate:−0.01, 95% UI:−0.12−0.09). Among
An. funestus, increasing agriculture was associated with decreased indoor biting with high posterior
were not present in high abundance in any site. Table 2.2 presents full model results, with parameter estimates and 95% uncertainty intervals for all three species.
Table 2.2: Results of hierarchical probit models assessing the effect of agriculture on indoor biting behavior amongAnophelesmosquitoes in DRC
An. gambiae s.l. An. paludis An. funestus s.l.
Variable estimate 2.5% 97.5% estimate 2.5% 97.5% estimate 2.5% 97.5% Intercept -0.76 -1.08 -0.45 -1.30 -2.96 0.35 0.30 -1.58 2.16 Agriculture 0.22 -0.21 0.68 -0.01 -0.12 0.09 -0.13 -0.37 0.09 Precipitation -0.17 -0.25 -0.10 0.05 0.03 0.08 0.02 -0.12 0.08 Temperature -0.30 -0.40 -0.20 -0.02 -0.11 0.07 0.07 -0.12 0.26
August 2013 Reference
November 2013 0.75 0.47 1.03 -0.83 -1.33 -0.32 -0.34 -2.11 1.46 February 2014 1.02 0.74 1.30 0.52 0.24 0.80 0.44 -0.79 1.67 April 2014 1.20 0.95 1.44 1.76 1.39 2.11 -0.75 -2.37 0.85 July 2014 0.59 0.39 0.78 0.85 0.59 1.12 -0.24 -1.32 0.80
2.2.2
Effects of Agriculture on Malaria Risk
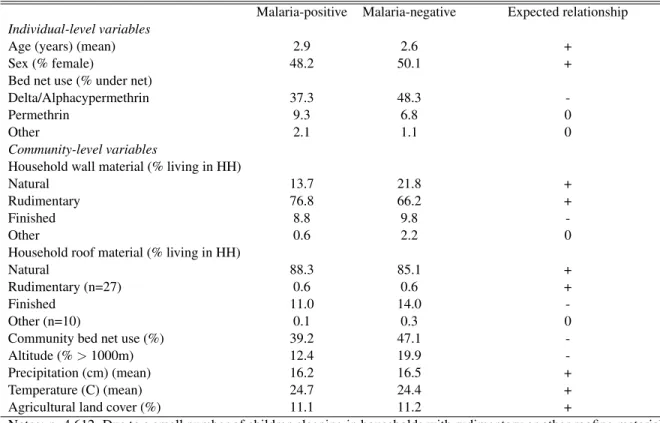
Table 2.3 presents descriptive statistics on the agricultural exposure and potential confounders included in all models, together with their expected relationships on malaria risk. There was no difference in the percent of agricultural land cover surrounding a community by overall malaria prevalence in under-5 children, with malaria-infected and uninfected children exposed to 11.1% and 11.2% agricultural land cover on average. There were also no differences on the temperature and precipitation measures, although malaria prevalence was 7.5% higher among those living at altitudes under 1,000 meters. Other differences included age, with malaria-infected children being slightly older. Individual bed net use also varied, with a higher proportion of malaria-negative children sleeping under deltamethrin- or alphacypermethrin-treated nets, and a higher proportion of malaria-positive children sleeping under permethrin-treated nets. Further, malaria-negative children were exposed, on average, to higher levels of community bed net protection, while malaria-positive children tended to live in poorer quality housing.
Table 2.3: Descriptive statistics for variables included in hierarchical models Malaria-positive Malaria-negative Expected relationship
Individual-level variables
Age (years) (mean) 2.9 2.6 +
Sex (% female) 48.2 50.1 +
Bed net use (% under net)
Delta/Alphacypermethrin 37.3 48.3
-Permethrin 9.3 6.8 0
Other 2.1 1.1 0
Community-level variables
Household wall material (% living in HH)
Natural 13.7 21.8 +
Rudimentary 76.8 66.2 +
Finished 8.8 9.8
-Other 0.6 2.2 0
Household roof material (% living in HH)
Natural 88.3 85.1 +
Rudimentary (n=27) 0.6 0.6 +
Finished 11.0 14.0
-Other (n=10) 0.1 0.3 0
Community bed net use (%) 39.2 47.1 -Altitude (%>1000m) 12.4 19.9 -Precipitation (cm) (mean) 16.2 16.5 + Temperature (C) (mean) 24.7 24.4 + Agricultural land cover (%) 11.1 11.2 +
Notes: n=4,612. Due to a small number of children sleeping in households with rudimentary or other roofing material, these categories were collapsed into the reference category in model fitting. A + indicates that the variable of interest is expected to increase risk, while a - indicates decreased risk. A 0 indicates no expected effect on risk.
high probability of increased risk. Values near 0 indicate high probability of decreased risk, while values near 0.5 correspond to little or no effect. Increasing exposure to agriculture was associated with increased malaria risk with a high posterior probability (estimate:0.07, 95% UI:−0.04−0.17, Pr(estimate>0)
= 0.89). As before, a 15% increase in agricultural cover is associated with risk differences ranging from
0.00(−0.00−0.01) to0.03(−0.01−0.07), depending on other risk factors such as bed nets treated with deltamethrin or alphacypermethrin, age, housing quality, and altitude.
Table 2.4: Results for final hierarchical probit regression model on agriculture and malaria risk Variable Estimate 2.5% 97.5% Pr(estimate>0)
Individual-level variables
Intercept -0.34 -0.51 -0.16 0 Age (years) 0.18 0.14 0.23 1 Female sex 0.03 -0.06 0.11 0.73 Bed net use
Delta/Alphacypermethrin -0.15 -0.25 -0.05 0 Permethrin 0.02 -0.17 0.21 0.58 Other 0.19 -0.18 0.56 0.84
Community-level variables
Household wall material
Natural Reference
Rudimentary 0.11 -0.04 0.27 0.92 Finished 0.05 -0.18 0.29 0.66 Other -0.26 -0.77 0.26 0.17 Finished Household roof material -0.12 -0.29 0.06 0.09 Community bed net use (%) -0.21 -0.31 -0.12 0 Altitude (living>1000m) -0.30 -0.70 0.11 0.07 Precipitation (z-score) -0.07 -0.19 0.04 0.11 Temperature (z-score) 0.17 0.03 0.32 0.99 Agricultural land cover (z-score) 0.07 -0.04 0.17 0.89
Notes: Pr(estimate>0) indiates that the posterior probability that the regression coefficient is greater than 0, indicating posterior probability of increased risk. Values near or at 0 indicate that the effect is protective, while values at or near 1 indicate that the covariate is a risk factor. Values near 0.5 indicate no effect
Figure 2.8: Hypothetical changes in malaria risk due to agriculture among children under 5 in DRC
Note: Shading indicates malaria risk based on other covariates, with green indicating low risk and red indicating high risk. For visualization, we further stratify based on each childs risk falling in the 25% (”Lowest 25%”), 25-75% (”Middle 50%”), and 75% (”Highest 25%”) quantiles. The black line represents the mean trend lines within each quantile.
2.3 Discussion
The agriculture-malaria relationship is complex, involving interactions between individuals, vectors, and the environment, all of which are highly diverse. To our knowledge, this is the first study attempting to understand the agriculture-malaria relationship using a population-based survey while incorporating available vector data from contemporaneous surveillance.
amongAn. gambiae, and that whileAn. funestusshowed a decreased probability of indoor biting with increasing agriculture, it only accounted for 1% of the mosquito population. Important seasonal patterns also existed among vectors, with the relative abundances ofAn. paludisandAn. gambiaevarying some sites, while indoor biting behavior among both species also varied, peaking in April 2014.
Results from analyses of DHS data indicate increased malaria risk with increasing agriculture, and that the relationship does not meaningfully vary over space due to confounding from the unobserved vector population or crop types. Further, our findings suggest that exposure to large-scale agricultural expansion will have a minimal effect on those at the most or least risk for infection based on other risk factors, but could have profound effects on those not at either of these extremes. Such an effect is of concern in the DRC, which has the largest proportion of potentially available cropland in sub-Saharan Africa, as well as one of the world’s highest malaria burdens.
Considerable work remains to fully understand the relationship between agriculture and malaria risk in sub-Saharan Africa. Work on adult populations is limited, with one study in the DRC finding no effect (Messina et al., 2011). Additionally, the relationship between agriculture, temperature, and precipitation needs additional examination. In this study, we treat them as confounders, but they may also modify risk, and their roles are complex (Paaijmans et al., 2010, 2011; Krefis et al., 2011; Ageep et al., 2009; Hern´andez-Avila et al., 2006; Stresman, 2010; Paaijmans et al., 2008). That complexity is not fully captured here. It is also impossible to representatively sample the vector population, although our population was sampled in different ecological zones.
Work is also needed to understand the role ofAn. paludis, which has received virtually no attention in the malaria literature. Recent work to identify Africa’s predominant malaria vectors predicted that
An. gambiaewas the dominant vector in DRC, which we do not dispute (Sinka et al., 2010). However,
work from the 1990s suggested thatAn. paludismay be an important vector in the DRC, and given its observed presence and the country’s high malaria burden, further work is needed to understand its role in transmission (Fontenille, 1999; Karch and Mouchet, 1992). Additional work is needed to try to understand how different types of agriculture may affect transmission.
2.4 From Agriculture to ITN effectivness
This paper sought to characterize the effect of agriculture on theAnophelesmosquito population and on malaria risk. Doing so represented a contribution to efforts to understand the underlying ecology of malaria transmission, a prerequisite for malaria control (Ferguson et al., 2010). That said, another prerequisite to malaria control is that current interventions remain effective. Indeed, ITNs have been a mainstay of all malaria control programs worldwide. Yet, insecticide resistance poses a serious threat, and it has been observed across sub-Saharan Africa. This is of particular concern in light of our findings from this work, where increasing agricultural land cover was associated with increased probability that
An. gambiaewere caught biting indoors. If insecticide resistance renders certain bed nets ineffective, and
if the ecological changes such as agricultural development lead the most pernicious malaria vector to bite indoors, then the loss of efficacy of ITNs due to insecticide resistance could be further compounded, and the transmission declines we have observe over the course of the last 15 years could be reversed.
CHAPTER 3: BED NET EFFECTIVENESS BY INSECTICIDE IN UNDER-5 CHILDREN ACROSS SUB-SAHARAN AFRICA
3.1 Introduction
Substantial investments in malaria control have greatly reduced malaria transmission since 2000, with interventions over this time period averting an estimated 663 million cases worldwide (95% uncertainty interval [UI]: 542 - 753) (Bhatt et al., 2015). Of the estimated cases averted, 68% (62% - 72%) have been attributed to use of insecticide treated nets (ITNs), a cornerstone of malaria control that have led to sustained reductions in transmission (Bhatt et al., 2015; Lindblade et al., 2006). ITNs possess two different mechanisms of action: they act as a physical barrier to prevent contact between mosquito and human, while insecticides provide an additional chemical barrier that can repel or kill susceptible mosquitoes on contact by targeting the voltage-gated sodium channel in the insect’s nervous system (Darriet et al., 1984; Lengeler et al., 2004; Davies et al., 2007). This latter mechanism, moreover, helps maintain the net’s protective efficacy after holes develop (Darriet et al., 1984). Thus, the continued success of ITNs largely depends on the continued effectiveness of insecticides, and the WHO has recommended all insecticide-treated nets (ITNs) in use be long-lasting insecticidal nets (LLIN), which are designed to retain insecticide activity for at least three years in field conditions, and are also of sturdier construction (WHO et al., 2007; Graham et al., 2005). Nevertheless, resistance to pyrethroids, the only class of insecticides approved for use in bed nets, has been reported across sub-Saharan Africa, the region with the highest malaria burden (Ranson et al., 2011; Kelly-Hope et al., 2008; Trape et al., 2011; Pinto et al., 2007; N’Guessan et al., 2007; Ranson et al., 2009; Hargreaves et al., 2000). Understanding the impact that such resistance may have on malaria control is therefore of critical importance.
identified: metabolic resistance and target-site resistance. The former is not as well understood, but is thought to result from the over expression of certain enzymes that sequester or detoxify the insecticide before it reaches the target site. Target-site resistance (also known as knock-down resistance, orkdr), conversely, is the result of point mutations in the insecticide’s sodium channel target, and allow insects to withstand exposure to insecticides without being knocked down (Ranson et al., 2011). Prevalence of these molecular markers varies considerably over space and time, while additional evidence suggests that increasing intervention coverage is exerting selection pressure on the gene expression and mutation processes responsible for resistance, and prevalence of resistance often increases as a result (Ranson et al., 2011; Czeher et al., 2008; Stump et al., 2004; Vulule et al., 1999; Protopopoff et al., 2008; Mathias et al., 2011; Padonou et al., 2012; Yadouleton et al., 2010; Djogb´enou et al., 2011).
Monitoring insecticide resistance and developing countermeasures, such as when to change insecti-cides used in nets, presents challenges. For example, recent recommendations suggest yearly monitoring efforts take place at a minimum of 12 sentinel sites, with additional surveillance efforts in other sites and at higher frequency recommended if resources permit (Kelly-Hope et al., 2008). However, insecticide resistance is heterogeneous even across short distances (Ranson et al., 2009). In a surveillance study conducted in 30 sites across Benin, for example, mortality following permethrin exposure varied from 25% to 100%, as did thekdrallele frequencies (0 - 0.91) inAn. gambiae ssmosquitoes (Djogb´enou et al., 2011). One recommendation that addresses this limitation is to sample the local vector population before any insecticide-based intervention begins, such that the proper insecticide(s) can be used (Ranson et al., 2009). Logistically, this is likely impossible given the scope of mass bed net distribution campaigns. It is also impossible to draw a representative sample of the mosquito population, greatly limiting under-standing resistance across an entire country and at the population level. Additionally, while molecular surveillance largely focuses on monitoring genetic mutations that confer resistance, resistance itself comes in multiple forms, including behavioral resistance, in which mosquitoes change their behavior to avoid contact with nets (Ranson et al., 2011; Mathias et al., 2011; Russell et al., 2011). This form of resistance is not well understood, and it is unknown whether or not behavioral traits have a genetic basis, meaning that, to date, molecular surveillance cannot detect behavioral changes (Ranson et al., 2011). Further, epidemiological studies on the links between insecticide resistance and transmission have also taken place in a limited number of sites, preventing generalizations to the broader population. Additional strategies are therefore needed to complement current entomological surveillance efforts.
3.2 Methods
3.2.1
Study Design and Data Sources
We obtained data on malaria and bed net use in children under 5 years of age from publicly available Demographic and Health Surveys (DHS) and Malaria Indicator Surveys (MIS) conducted between 2009 and 2016. Briefly, DHSs are two-stage cluster household surveys designed to provide nationally and sub-nationally representative estimates across a number of public health domain areas among children under the age of 5, and women and men of reproductive age. MISs follow the same survey design, but are more limited in scope than a full DHS. All surveys collect extensive demographic and socioeconomic data from participants. Further details for these surveys are available elsewhere (Hancioglu and Arnold, 2013; DHS, 2017).
3.2.2
Outcome and Exposure Measures
The primary outcome in this study is the malaria status of each child, which was determined by a rapid diagnostic test (RDT) using a heel- or finger-prick blood sample. The primary exposure is whether or not a child slept under a bed net the previous night, coded according the insecticide used in each net. We ascertained insecticide status using the bed net brand reported in the surveys. Each child sleeping under a net was coded as sleeping under a net treated with deltamethrin, permethrin, alphacypermethrin—the three most common insecticides—or other type of net. The latter category was used in cases where no brand information was available, or in cases where the insecticide could not be determined from the brand.
3.2.3
Potential Confounders
mosquito entry, with natural construction materials providing little or no barrier to entry, and finished materials providing the greatest barrier. Finally, we considered the possibility that community-level coverage with each type of net may influence individual malaria risk.
3.2.4
Statistical Methods
Our statistical analysis consisted of mixed effects logistic regression, and we stratify by country and year. All models incorporate survey sampling weights such that parameter estimates represent the expected effect in the under-5 population in each country and year in which a survey was conducted. We compared models including and excluding community-level coverage for each type of net using BIC. All analyses were done using R 3.3.1 and Stata 14.2.
3.3 Results
A total 168,118 children younger of 5 years of age from 33 DHS and MIS surveys conducted in 21 countries from 2009 to 2016 across sub-Saharan Africa were included in this analysis. Figure 3.9 shows a frequency plot of the surveys included in this study, together with sample sizes and type of survey.
Figure 3.9: Frequency plot of surveys included in the study
Malawi, coverage with both alphacypermethrin and deltamethrin declined from 2012 and 2014, while coverage with permethrin increased to 69%. Figure 3.10 shows the proportion of each type of insecticide in use by country and year.
Results from mixed effects logistic regression models indicate that excluding community-level bed net coverage (by insecticide) yielded better fit in 25 out of 33 models, and that the effects of sleeping under a net treated with a given insecticide did not meaningfully differ between the models considered. Table 3.5 shows the effects of sleeping under a bed net treated with different insecticides by country and year for both the full and reduced models, as well as the malaria prevalence at the time of the survey. Additionally, Figure 3.11 maps the odds ratio of each insecticide using the most recent survey, and therefore represents the current best estimate of the effectiveness of each insecticide at the population level.
Figure 3.10: Proportion of nets treated with different insecticides by country and year
were associated with meaningful reductions in odds of infection, both in the 2010 and 2015 surveys, where malaria prevalence declined from 51.4% to 45.1%. Among those children sleeping under a deltamethrin-treated net in 2010, the odds of infection were only 6% lower than a child not sleeping under a bed net (OR 0.94, 95% UI 0.74 - 1.19). By 2015, this small effect had disappeared (OR 1.00, 95% UI 0.84 - 1.19). Among those sleeping under a net treated with permethrin, the odds of infection ranged from 0.90 (0.60 - 1.36) in 2010 to 1.28 (0.89 - 1.83) in 2015. For alphacypermethrin, a possible protective effect in 2010 (OR 0.79, 95% UI 0.36 1.72) disappeared in 2015 (OR 0.96, 95% UI 0.49 -1.89), although considerable imprecision accompanies both estimates. Likewise, in Guinea, none of the three major insecticides in use were associated with reductions in odds of infection during the time of the survey, while in neighboring Liberia, the protective effect of deltamethrin—the primary insecticide in use in both the 2009 and 2011 surveys—appears to have disappeared from 2009 to 2011 (see Table 3.5).
Table 3.5: Results from stratified logistic regression models
Reduced Models Full Models
Deltamethrin Permethrin Alphacypermethrin Deltamethrin Permethrin Alphacypermethrin
Malaria OR OR OR OR OR OR Favored
Country/Year Prevalence (%) (95% CI) (95% CI) (95% CI) (95% CI) (95% CI) (95% CI) Model (BIC)
Angola 2011 13.5 0.71 NA NA 0.73 NA NA Reduced
(0.47 - 1.11) (0.47 - 1.12)
Benin 2011 24.6 0.72 0.87 0.72 0.85 0.87 0.94 Full
(0.51 - 0.99) (0.68 - 1.12) (0.38 - 1.38) (0.60 - 1.20) (0.68 - 1.11) (0.49 - 1.81)
Burkina Faso 2010 76.2 1.04 0.89 0.81 1.12 0.85 0.82 Reduced
(0.87 - 1.25) (0.61 - 1.29) (0.61 - 1.09) (0.92 - 1.35) (0.58 - 1.24) (0.61 - 1.10)
Burkina Faso 2014 61.3 0.84 0.95 0.61 0.85 0.54 0.60 Reduced
(0.68 - 1.05) (0.76 - 1.18) (0.38 - 0.96) (0.68 - 1.06) (0.43 - 0.67) (0.38 - 0.94)
Burundi 2012 12.8 0.67 0.40 0.79 0.75 0.40 0.80 Reduced
(0.46 - 0.98) (0.18 - 0.89) (0.51 - 1.22) (0.51 - 1.10) (0.18 - 0.88) (0.52 - 1.23)
Cameroon 2011 30.0 0.82 1.13 0.58 0.80 1.08 0.56 Reduced
(0.64 - 1.05) (0.75 - 1.70) (0.24 - 1.38) (0.62 - 1.04) (0.71 - 1.62) (0.24 - 1.33)
Cote d’Ivoire 2011 41.5 0.73 0.72 NA 0.64 0.74 NA Full
(0.57 - 0.94) (0.54 - 0.95) (0.49 - 0.94) (0.56 - 0.98)
DRC 2013 30.9 0.71 1.17 0.49 0.73 1.15 0.51 Reduced
(0.59 - 0.85) (0.78 - 1.76) (0.18 - 1.33) (0.61 - 0.88) (0.75 - 1.75) (0.19 - 1.39)
Gambia 2013 2.6 0.49 NA NA 0.45 NA NA Reduced
(0.28 - 0.86) (0.25 - 0.80)
Ghana 2014 36.4 1.07 0.79 1.13 0.96 0.69 1.03 Reduced
(0.83 - 1.39) (0.38 - 1.64) (0.71 - 1.81) (0.74 - 1.24) (0.33 - 1.46) (0.64 - 1.66)
Guinea 2012 46.8 1.24 1.13 1.02 1.11 1.07 1.02 Full
(0.89 - 1.73) (0.52 - 2.48) (0.69 - 1.53) (0.79 - 1.56) (0.48 - 2.4) (0.68 - 1.52)
Kenya 2015 12.9 0.46 0.74 NA 0.46 0.76 NA Full
(0.35 - 0.59) (0.60 - 0.92) (0.35 - 0.59) (0.61 - 0.94)
Liberia 2009 36.6 0.87 0.70 NA 0.86 0.69 NA Full
(0.69 - 1.11) (0.45 - 1.10) (0.68 -1.10) (0.43 - 1.09)
Liberia 2011 44.7 0.97 0.92 1.39 0.94 0.99 1.47 Reduced
(0.75 - 1.24) (0.34 - 2.46) (0.90 - 2.17) (0.73 - 1.21) (0.37 - 2.62) (0.92 - 2.35)
Madagascar 2011 8.7 0.85 0.61 0.93 0.77 0.54 0.71 Reduced
(0.43 - 1.71) (0.35 - 1.06) (0.46 - 1.86) (0.37 - 1.59) (0.31 - 0.97) (0.33 - 1.55)
Madagascar 2013 10.0 1.05 1.03 1.06 0.89 0.82 0.90 Full
(0.70 - 1.60) (0.70 - 1.54) (0.45 - 2.54) (0.59 - 1.35) (0.55 - 1.20) (0.39 - 2.1)
Madagascar 2016 5.1 1.01 0.96 2.76 0.87 0.88 2.56 Reduced
(0.68 - 1.51) (0.36 - 2.56) (0.52 - 14.71) (0.58 - 1.30) (0.34 - 2.32) (0.41-16.11)
Mali 2012 47.0 0.92 1.08 NA 0.90 1.10 NA Reduced
(0.74 - 1.14) (0.84 - 1.39) (0.72 - 1.11) (0.85 - 1.42)
Mali 2015 23.4 0.85 0.65 1.07 0.85 0.67 1.09 Reduced
(0.72 - 1.02) (0.31 - 1.39) (0.46 - 2.52) (0.72 - 1.01) (0.32 - 1.43) (0.46 - 2.58)
Mozambique 2011 38.2 0.95 1.02 NA 0.90 0.96 NA Reduced
(0.73 - 1.23) (0.79 - 1.32) (0.69 - 1.18) (0.74 - 1.24)
Malawi 2012 43.3 0.69 0.95 0.81 0.69 0.96 0.83 Reduced
(0.40 - 1.17) (0.64 - 1.43) (0.56 - 1.18) (0.40 - 1.18) (0.65 - 1.44) (0.57 - 1.21)
Malawi 2014 37.2 0.58 0.50 0.71 0.58 0.48 0.76 Reduced
(0.26 - 1.28) (0.32 - 0.79) (0.41 - 1.22) (0.26 - 1.29) (0.31 - 0.75) (0.44 - 1.32)
Nigeria 2010 51.4 0.94 0.90 0.79 0.94 0.87 0.82 Reduced
(0.74 - 1.19) (0.60 - 1.36) (0.36 - 1.72) (0.74 - 1.19) (0.58 - 1.32) (0.38 - 1.79)
Nigeria 2015 45.1 1.00 1.28 0.96 0.98 1.23 1.00 Reduced
(0.84 - 1.19) (0.89 - 1.83) (0.49 - 1.89) (0.82 - 1.16) (0.86 - 1.77) (0.51 - 1.95)
Senegal 2011 2.7 0.80 0.57 0.75 0.73 0.53 0.88 Full
(0.50 - 1.30) (0.20 - 1.62) (0.17 - 3.42) (0.44 - 1.21) (0.17 - 1.63) (0.22 - 3.48)
Senegal 2012 3.3 0.57 0.53 0.65 0.55 0.70 1.00 Reduced
(0.35 - 0.94) (0.28 - 1.01) (0.07 - 5.64) (0.34 - 0.91) (0.36 - 1.33) (0.11 - 9.34)
Senegal 2014 1.1 0.59 0.94 1.04 0.68 0.93 1.70 Reduced
(0.25 - 1.39) (0.34 - 2.55) (0.20 - 5.51) (0.25 - 1.84) (0.29 - 2.94) (0.73 - 3.97)
Senegal 2015 0.6 0.74 0.44 1.83 0.63 0.45 0.81 Reduced
(0.29 - 1.86) (0.14 - 1.40) (0.36 - 9.19) (0.26 - 1.52) (0.15 - 1.34) (0.22 - 3.04)
Tanzania 2011 9.4 NA 0.99 0.95 NA 0.95 0.93 Full
(0.76 - 1.29) (0.28 - 3.2) (0.73 - 1.24) (0.28 - 3.10)
Tanzania 2015 14.4 1.22 1.00 0.19 1.07 0.88 0.24 Reduced
(0.87 - 1.71) (0.79 - 1.26) (0.04 - 0.82) (0.77 - 1.49) (0.70 - 1.11) (0.05 - 1.11)
Togo 2013 38.2 0.70 0.44 NA 0.65 0.41 NA Reduced
(0.57 - 0.85) (0.09 - 2.06) (0.54 - 0.80) (0.09 - 1.90)
Uganda 2009 51.9 0.60 0.59 0.44 0.59 0.60 0.43 Reduced
(0.45 - 0.80) (0.40 - 0.86) (0.26 - 0.75) (0.45 - 0.79) (0.41 - 0.88) (0.25 - 0.73)
Uganda 2014 29.9 0.86 1.12 0.84 0.86 1.05 0.86 Reduced
(0.66 - 1.13) (0.84 - 1.50) (0.48 - 1.47) (0.65 - 1.13) (0.79 - 1.40) (0.48 - 1.54)
95% UI 0.57 - 0.94; permethrin OR 0.72, 95% UI 0.54 - 0.95). In Benin in 2011, against a background malaria prevalence of 24.6%, deltamethrin was similarly protective (OR 0.72, 95% UI 0.51 - 0.99), although permethrin-treated nets were less so (OR 0.87, 95% UI 0.68 - 1.12).
Figure 3.11: Odds of malaria infection by insecticide use from each country’s most recent survey
Green borders identify those countries in which a protective effect was observed at the 0.05 level.
malaria as well. The varying degrees of imprecision can be seen in Figure 3.12, which plots the odds of malaria infection according to insecticide use for all surveys, together with 95% uncertainty intervals.
Figure 3.12: Odds of malaria infection by insecticide use