CHILDREN, (DENTAL) CROWDING, AND CARIES: IS THERE A CONNECTION?
Kerry Anzenberger Dove, DMD
A thesis submitted to the faculty of the University of North Carolina at Chapel Hill in partial fulfillment of the requirements for the degree of Master of Science in the Department of Pediatric Dentistry in the School of Dentistry.
Chapel Hill 2012
Approved by:
2012
ABSTRACT
Kerry Anzenberger Dove: Children, (Dental) Crowding, and Caries: Is There a Connection?
(Under the direction of Martha Ann Keels)
The purpose of this study was to investigate lack of anterior interdental spacing of primary incisors as a clinical risk factor for the early assessment of caries risk, primarily posterior interproximal caries. This study was a cross-sectional study in which 204 healthy subjects (age 42-60 months) were collected from two sites. All subjects had 20 primary teeth without previous restoration. If the patient was eligible for bitewing radiographs, diagnostic radiographs were obtained and a caries risk assessment
This thesis is dedicated to my husband Travis Dove,
my puppy Chiclet,
ACKNOWLEDGEMENTS
To my thesis advisor, Dr. Martha Ann Keels, for her unwavering support, guidance and mentorship throughout this project.
To committee members, Dr. Rocio B. Quiñonez, Dr. Michael W. Roberts, and Dr. R. Gary Rozier for their invaluable support and encouragement.
To my statistician, Sharon Elizabeth Edwards, for her knowledge, expertise, patience, and friendship.
To my statistical consultant, Kimon Divaris, for his insight and statistical proficiency.
To Mary Hillmer, for her incredible hard work and patience in recruiting subjects.
To my fellow pediatric dental residents for their moral support, friendship, and assistance with data collection.
TABLE OF CONTENTS
Page
LIST OF TABLES ... vii
I. INTRODUCTION………...1
II. REVIEW OF LITERATURE ... 3
III. MATERIALS AND METHODS ... 10
IV. RESULTS ... 15
V. DISCUSSION ... 20
VI. CONCLUSIONS ... 27
VII. TABLES ... 28
LIST OF TABLES
Table 1.1 Descriptive Statistics (Demographics)... 28
Table 1.2 Descriptive Statistics (Experimental Variables) ... 29
Table 2.1 Bivariate Analysis (Any Caries, Demographics) ... 30
Table 2.2 Bivariate Analysis (Any Caries, Parent Reported Variables) ... 31
Table 2.3 Bivariate Analysis (Any Caries, Clinical Variables) ... 32
Table 2.4 Bivariate Analysis (Any Caries, Continuous Variables) ……….….33
Table 2.5 Bivariate Analysis (Posterior Interproximal Caries, Demographics) ….…..34
Table 2.6 Bivariate Analysis (Posterior Interproximal Caries, Parent Reported)….…35 Table 2.7 Bivariate Analysis (Posterior Interproximal Caries, Clinical Variables)...…36
Table 2.8 Bivariate Analysis (Posterior Interproximal Caries, Continuous)……...…...37
Table 3.1 Zero-Inflated Negative Binomial (Total Contacts)………38
Table 3.2 Zero-Inflated Negative Binomial (Maxillary Contacts)…………...………..39
Table 3.3 Zero-Inflated Negative Binomial (Mandibular Contacts)……….………….40
Table 4.1 AAPD Variables Zero-Inflated Negative Binomial………41
Table 4.2 AAPD Variables Zero-Inflated Negative Binomial (Total Contacts)………42
Table 4.3 AAPD Variables Zero-Inflated Negative Binomial (Maxillary Contacts)...43
Table 4.4 AAPD Variables Zero-Inflated Negative Binomial (Mandibular Contacts)..44
Table 5.1 Expected Counts (Total Contacts)………...45
Table 5.2 Expected Counts (Maxillary Contacts)…....………...46
INTRODUCTION
As pediatric dentists, promotion of dental health and prevention of dental disease are of utmost importance. Dental caries is a preventable disease that still affects
approximately 42% of the childhood population, ages 2-11 years old.1 In collaboration with our pediatric medical counterparts, it is critical to help identify high risk children at even earlier ages in order to prevent initiation of dental disease. Current caries risk assessments rely on a variety of social, behavioral, and clinical factors, of which clinical factors have been shown to hold highest predictability.2,3 The most common and
predictable variable is previous caries experience;3,4 however, when this variable is present it is too late as the disease process is already underway. This study proposes a new clinical risk concept of lack of interdental spacing. This concept is easy to visualize at an early age, prior to the beginning of the dental caries process. On average, the lower six anterior incisors begin to erupt at six months of age and have fully erupted by two years of age.5
The caries pattern of interest for this study is posterior interproximal caries. This is a chronic, multi-focal disease pattern that can start as early as age three when the posterior primary molars erupt, can last until their exfoliation at approximately age twelve,5 and continue into the adult permanent dentition. Dean6 showed an association of 69% of primary molar teeth with proximal caries developed caries on the adjacent
primary molar in another quadrant.6 Li and Wang published a study in which caries on primary molars held the highest predictive value (85.4%) for caries in the permanent dentition.4 This study emphasized the importance of early preventive measures to avoid initiation of dental caries in the primary dentition, especially in the posterior quadrants. Vanderas7 reported a positive association between caries on the distal aspect of the second primary molar and mesial aspect of the corresponding first permanent molar, indicating progression of the disease to the permanent dentition. Once this disease is present in the permanent dentition, due to its chronic, multi-focal nature, these studies4,6,7 indicate there is a lifelong interproximal caries risk.
Interdental spacing has not been studied as a caries risk factor. Specifically, anterior primary interdental spacing and its association with posterior interproximal caries has not been examined systematically. Accordingly, the aims of this prospective cross-sectional study are: to investigate the association between lack of anterior
interdental spacing as a clinical risk factor for the early assessment of posterior interproximal caries risk in the primary dentition; and to evaluate the benefit of the addition of the clinical variable, lack of anterior interdental spacing, to the American Academy of Pediatric Dentistry (AAPD) Caries-Risk Assessment Form2.
REVIEW OF LITERATURE
Caries in Childhood
Dental caries is the most prevalent chronic disease of childhood in the United States,8 five times higher than that seen for the next most prevalent disease, asthma.9 The unsettling reality is that dental caries is a preventable disease yet it continues to affect a large portion of the population. The Center for Disease Control (CDC) reports from the National Health and Nutrition Examination Survey 1999-2004 (NHANES) that 42% of children ages 2-11 years had caries experience in the primary dentition, a prevalence increased from the survey conducted five years earlier (1988-94).1 In the younger population of 2-5 year-olds, the prevalence significantly increased from 24% to 28%.1 Twenty-three percent of this population had untreated dental caries in the primary dentition, which remained unchanged from five years earlier.1 The examination criteria for the NHANES study did not include dental radiographs, therefore coronal caries could only be reported if a break in the enamel surface could be detected with an explorer.1 Interproximal caries could only be detected if the lesions was extensive enough to cause occlusal collapse. Therefore, the NHANES data underestimates the prevalence of interproximal caries and thus underestimates dental caries in the pediatric population. The Role of Pediatricians and Family Physicians
The most ideal approach to the prevention of dental caries is to initiate preventive strategies with parents/caregivers of children before the disease is present. Because
approaches need to be implemented at an early age. These prevention strategies needs to start before the disease process begins. The American Academy of Pediatric Dentistry (AAPD) recommends that children have their first dental visit and establish a dental home by the age of one;11 however, with a limited pediatric dental workforce and access to care issues, to accomplish this goal, the involvement of pediatricians and family physicians is invaluable. Visits to the pediatric medical office begin shortly after birth and are routine healthcare experiences for infants and children.
It is recommended that children have a minimum of eight well child visits, including recommended vaccination appointments, between birth and age three.12 Visits to the pediatric medical office are 250 times more frequent than visits to the dentist office during the first year of life.13 Coincidentally, this is an age when the primary teeth are just beginning to emerge. Because of the child’s early and frequent interaction with pediatricians and family physicians, they can offer an excellent first line of defense for the prevention of dental caries.
American Academy of Pediatric Dentistry (AAPD) Caries-Risk Assessment Form
The AAPD developed a Caries-Risk Assessment Form in 2002 as an instrument to be used by both dental and non-dental healthcare providers to help identify children at increased risk for dental caries.2 Updated most recently in 2010, Caries-Risk Assessment Forms categorize children as low, moderate, or high risk for dental caries.2 These levels of risk can be used to help develop individual treatment and prevention plans, along with periodicity of services, especially where resources are limited.2
The first two are based on parental/caregiver report and the third is based on professional clinical examination. This Caries-Risk Assessment Form has limitations. The history section of part one and two relies heavily on the accuracy of parental/caregiver responses, introducing reporting bias. Clinical variables have been shown to be stronger predictors than non-clinical variables.3 The third part includes the clinical evaluation, in which the professional must identify visible plaque, areas of demineralization/white spot lesions, enamel defects, and cavities or fillings.2 These clinical markers are difficult to identify without previous dental training . For example, visible plaque is defined on the form as white sticky build-up2 and is very similar in color to the tooth, making it difficult to identify. Areas of demineralization are defined on the assessment form as chalky white spots on the teeth2 and can even be challenging for dentists to identify.14 Finally, clinical experience helps to identify enamel defects and deep pits and fissures. For example, staining can appear to be caries,14 and composite resin restorations (“fillings”) may be difficult to identify also if there is a good color match. It has been shown that after training in infant oral health, pediatric primary care providers can show an adequate level of accuracy in identifying cavitated carious lesions,14 however, at this point the disease process exists.
the child can avoid dental caries altogether. It is even more imperative that these risk factors are accurate and efficient so that physicians can easily and effectively include them in the overall daily clinical practice of the well child visit. Under the Bright Futures guidelines there are more than twenty topics for pediatricians and family physicians to cover with the parent/caregiver as well as complete the physical exam in a limited amount of time, so a quick oral health risk assessment measure is essential.12 Epidemiology of Interproximal Caries as a Chronic Disease
Caries is most commonly classified into either interproximal or pit and fissure caries. Interproximal caries occurs on the smooth, rounded areas between adjacent teeth.15 When conditions of food stagnation with bacterial debris are lodged between teeth, the caries process can be initiated.15 Although the caries process itself occurs when there is a disturbance of the balance between pathologic versus protective factors,16 the types of surfaces involved appear to be influenced by some independent factors, such as spacing between teeth in the case of interproximal caries.
Multiple studies have identified the distal aspect of the first primary molar to have the highest caries experience .6,15,17 The explanation for this could be due to the enamel thickness or simply due to the fact that this surface has the longest exposure to cariogenic factors because of its eruption time and lifecycle as compared with the second primary molar, which emerges several months later.5, 15
lesion on a primary molar in one quadrant developed another proximal lesion on a primary molar in another quadrant.6 This study emphasize the multi-focal nature of posterior interproximal caries.
The dental caries process is not limited to the primary dentition. Ninety-four percent of children who developed dental caries in the permanent dentition had previous caries experience in their primary molars.6 Children who manifested caries in their primary teeth were three times more likely to develop caries in their permanent teeth, with the greatest predictor being caries of the primary molars rather than the primary anterior teeth.4 Vanderas et al7 reported that proximal caries on the distal surface of the second primary molar was positively associated with the presence of proximal caries on the corresponding permanent first molar mesial surface. To summarize: the chronic and destructive nature of interproximal caries emphasizes the importance of prevention of the initiation of such disease.
Interdental Spacing
Spacing is a common finding in the anterior segment of the primary dentition and is a requirement for proper alignment of the permanent incisors.18 There are slight increases in arch dimension during normal development but they are not sufficient to overcome large discrepancies, so crowding typically persists after the transition to the permanent dentition if it is present in the primary dentition.18
Generally the first primary incisor to erupt is the mandibular central at
concluded that after eruption of the primary dentition no changes were noted in
interdental spacing; children either inherently had spaces or did not have spaces.19 His early study emphasizes the stability of interdental spacing as a biologic entity.19 Generalized spacing is found in almost two-thirds of children in the primary
dentition.20,21 Multiple studies22,23,24 have shown that in children with dental crowding both arch width and length have been statistically reduced in size compared to children that do not exhibit crowding in the primary dentition. This indicates an overall lack of adequate space throughout the entire dental arch.
Statement of Hypotheses
• The first null hypothesis is: lack of anterior interdental spacing in both dental
arches is not associated with interproximal caries in the primary molar region.
• The second null hypothesis is: lack of anterior interdental spacing in the
mandible is not associated with interproximal caries in the primary molar region.
• The third null hypothesis is: lack of anterior interdental spacing in the maxilla is
not associated with interproximal caries in the primary molar region.
• The first alternative hypothesis is: lack of anterior interdental spacing in both
dental arches is associated with interproximal caries in the primary molar region.
• The second alternative hypothesis is: lack of anterior interdental spacing in the
mandible is associated with interproximal caries in the primary molar region.
• The third alternative hypothesis is: lack of anterior interdental spacing in the
MATERIALS AND METHODS
Study Design and Sample
This cross-sectional study was approved by the Institutional Review Boards at the University of North Carolina at Chapel Hill and Duke University. Subjects were
recruited from both the Graduate Pediatric Dentistry clinic at the University of North Carolina at Chapel Hill School of Dentistry and the Pediatric Dentistry Clinic at Duke University in Durham, North Carolina. Using observational data collected by Keels and Knee,26 a power analysis revealed a required sample size of 186 subjects. The statistical findings used to calculate this sample size included 40% of children had interproximal caries and approximately 40% of children lacked anterior interdental spacing.26 It was decided that 200 subjects would be collected in total, 100 from each site.
Consecutive enrollment began in September 2010 and was completed by October 2011. All subjects were healthy children (American Society of Anesthesiologists Class I or II) between the ages of 42-60 months and in the full primary dentition (all 20 primary teeth needed to be present). Subjects were examined in the dental chair with a dental light and mirror at either a new patient evaluation or recall appointment. Bitewing radiographs were obtained for all patients with closed posterior contacts adhering to the AAPD Guidelines for prescribing dental radiographs for children in the primary
examination, and children with any permanent teeth. Children with previous restorative dental treatment prior to the examination were also excluded from the study.
To avoid behavioral bias and to address behavioral discrepancies in obtaining bitewings, children who met the inclusion criteria and were treated under a general anesthesia setting were also included.
Data Collection
A data collection form was developed that included the caries risk assessment factors used by the AAPD and additional clinical criteria incorporating a visual record of anterior interdental spacing and radiographic or clinical record of posterior interproximal caries. Total clinically evident caries experience of the participant was recorded in addition to interproximal caries to avoid underestimation of caries prevalence. The first five questions reviewed the participant demographic information, including insurance coverage, which served as a proxy for socioeconomic status (SES). The following section consisted of variables from the AAPD Caries Risk Assessment Form.2 Part I was the history which included the biological and protective factors of the patient as reported by the parent.2 Part II included the clinical examination as reported by the examiner.2 The dental home status of the subject was assessed through parental report. Dental home11 was defined as attendance to regular recall appointments. If this was the subject’s first visit to the dentist or if they had irregular or emergency only care he/she was
Experimental variables
The final section of the data collection form was the recording of the experimental variables of the study. The number of contacts in the upper and lower anterior arches (between the primary canines, lateral incisors, and central incisors) were recorded. Existence of a contact was visually assessed by the examiner. A contact existed when the developmental space was absent. The number of contacts was the independent variable. There are five possible contacts that can exist between these six anterior teeth in both arches, and contacts were recorded as a number between zero and five in each arch.
The dependent experimental outcome variable was the presence of posterior interproximal caries. The presence of posterior interproximal caries was determined radiographically from the bitewing imaging, if radiographs were indicated for the subject. Interproximal caries extending beyond the dentino-enamel junction (DEJ) and incipient interproximal lesions, in enamel only, were recorded. Anterior and posterior
interproximal and incipient lesions were recorded; however, the disease of interest was posterior interproximal caries.
The other clinical variables that were assessed on examination were the presence of plaque, enamel defects or deep pits and fissures, and white spot lesions. Intraoral bacterial levels of the subjects were not investigated in this study. In order to validate the AAPD Caries Risk Assessment Form, any clinically evident caries were also recorded in the final section of the data collection form.
In the graduate pediatric dentistry clinic at the UNC School of Dentistry
pediatric dentists. On a subset of ten patients, there was 100% agreement between the two head UNC and Duke examiners. These clinicians trained the other examiners at both sites with a review of the data collection form, visual assessment of open or closed
contacts, as well as the additional clinical data of enamel defects, deep pits/fissures, white spot lesions, and presence of plaque.
To avoid inter-examiner discrepancies, all bitewing radiographs were interpreted by one pediatric dentistry resident blinded to the study variables. This resident re-read 10% of the radiographs in order to assure intra-examiner reliability.
Statistical Analyses
Descriptive, bivariate, and multivariate analyses were conducted using SAS Software Version 9.2 (SAS Institute, Cary, NC). Descriptive statistics were run for the entire subject population as well as by site. Risk ratios for the presence of posterior interproximal caries and the presence of any dental caries were calculated for each variable in the AAPD Caries Risk Assessment Form, as well as the experimental variables. Ninety-five percent confidence intervals and p-values were calculated with significance assessed at α≤0.05. Data was analyzed including the independent variable of anterior contacts defined in three different ways: total contacts (adding the maxillary and mandibular contacts together), maxillary contacts only, and mandibular contacts only.
zero-inflated Poisson, negative binomial, and zero-zero-inflated negative binomial models. Due to the excess zeros in the outcome variable, these tests showed that a zero-inflated negative binomial model best fit the dataset and that model was used for the final multivariate regression model. For each covariate included in the model, rate ratios and 95%
confidence intervals for the number of posterior interproximal caries were calculated and p-values with significance assessed at α≤ 0.05. Expected counts and 95% confidence intervals for the number of posterior interproximal caries with each increase in the number of closed contacts for the given reference subject were also calculated for the significant variables of total contacts, maxillary, and mandibular contacts.
RESULTS
Study Population
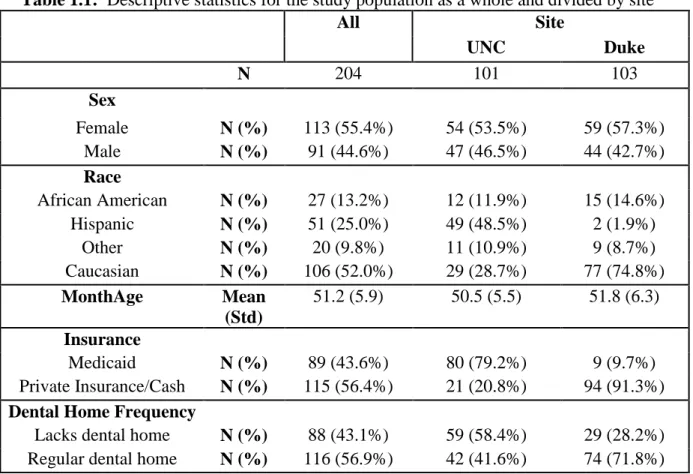
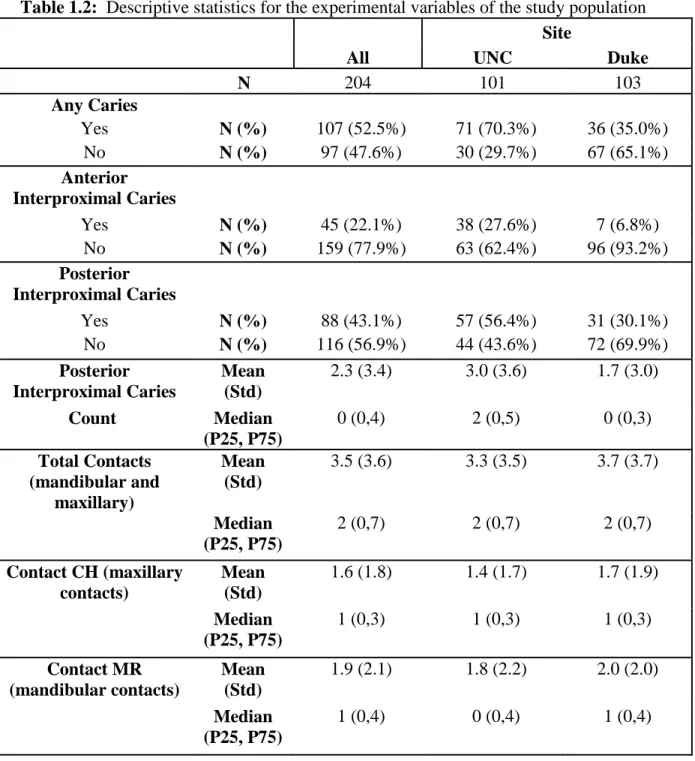
A total of 204 subjects participated in the study, 101 from the UNC School of Dentistry Pediatric Graduate clinic and 103 from the Pediatric Dentistry Clinic at Duke University. The descriptive demographic characteristics and experimental variables from the study population are shown in Tables 1.1 and 1.2 as a group and by site. The overall population has a slight majority of females (55.4%) with a mean age of 51.1 months (SD 5.9). The greatest differences between the two sites are the insurance coverage. Overall, the population consisted of 89 (43.6%) subjects covered by Medicaid insurance;
Bivariate Analyses
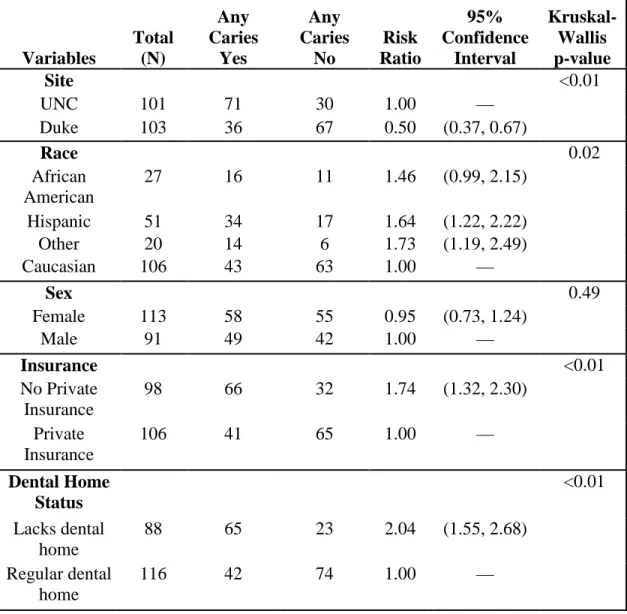
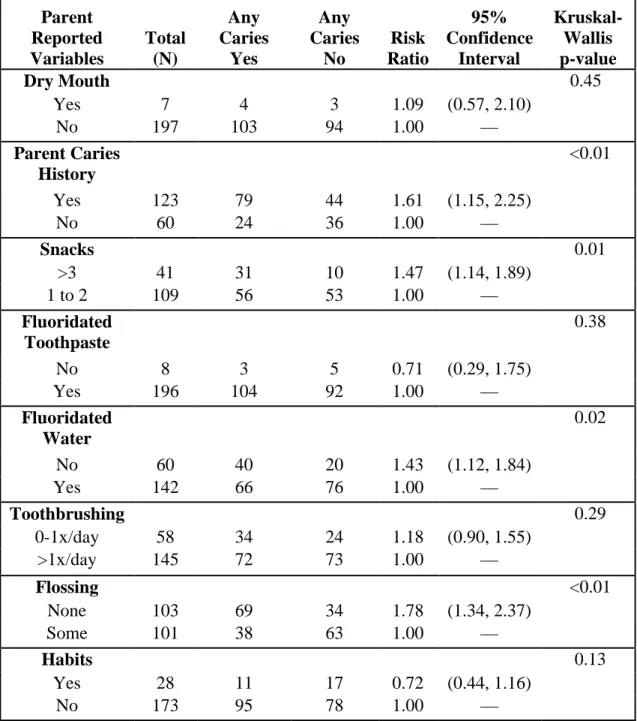
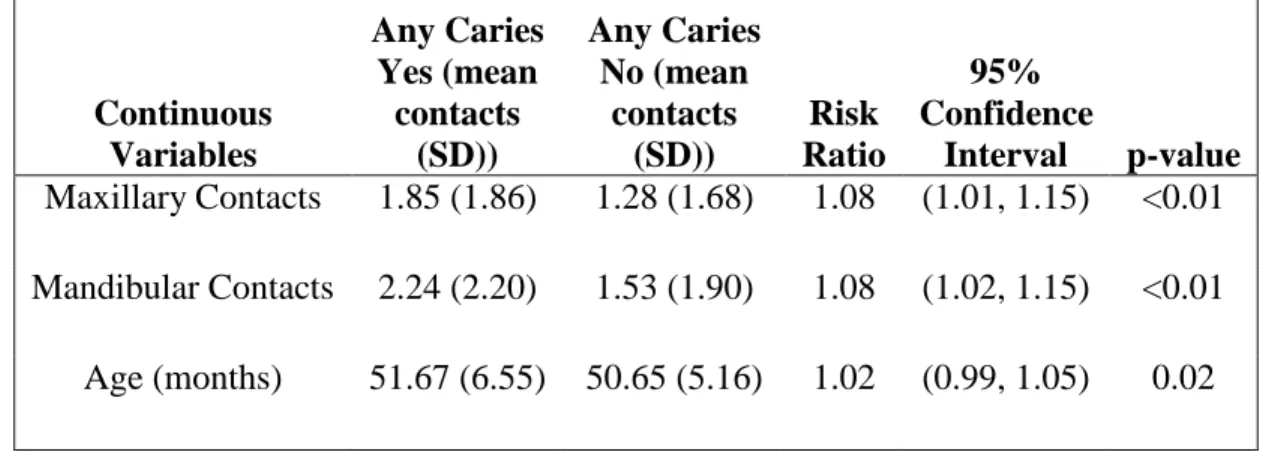
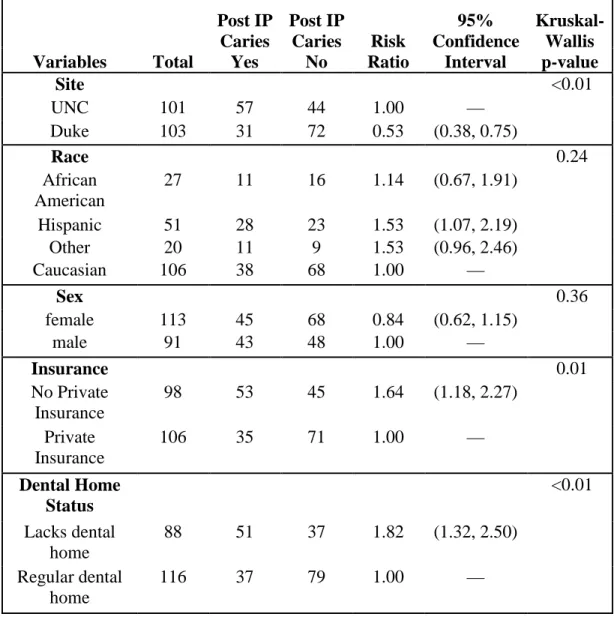
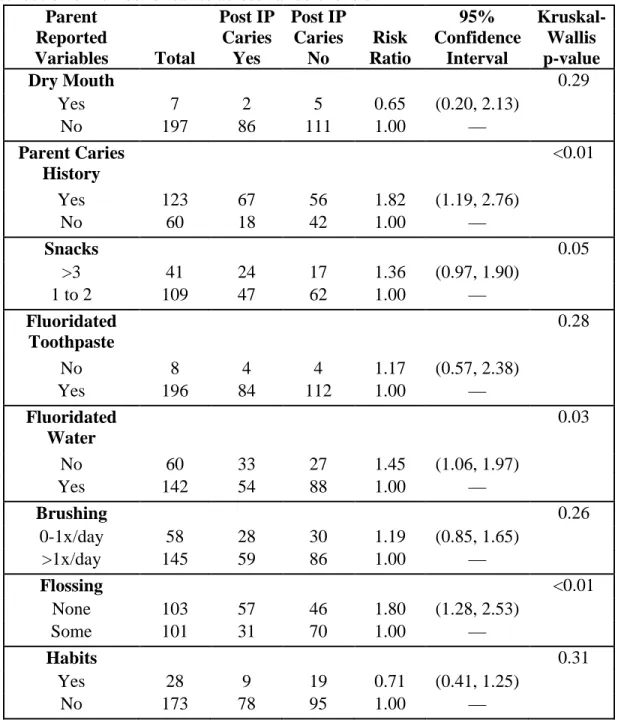
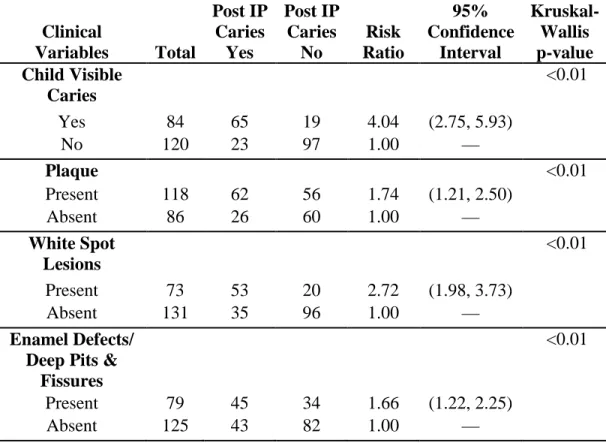
Risk ratios for the presence of any caries as well as posterior interproximal caries were calculated for the entire population. Tables 2.1-2.8 include all risk ratio calculations along with a 95% confidence interval and p-value. P-values were considered significant assessed at α≤0.05. The tables are divided into demographic variables, parent reported variables, and clinical variables. For the presence of any carious lesion, significant variables were site, race, insurance, dental home status, parent caries history, snacks, fluoridated water, and flossing. All clinical variables were significant for the presence of any caries, including closed contacts in both the maxillary and mandibular arches. Age was also a significant variable. Table 2.5 begins the risk ratio calculations for the presence of any posterior interproximal caries, the caries pattern of particular interest in this study. Significant variables for posterior interproximal caries were similar to those of any caries except that race was not significant. The following variables had missing values: 54 missing values for snacks, 21 missing values for parent caries history, three missing values for habits, three missing values for brushing, and two missing values for fluoridated water.
Multivariate Analyses
excess zeros. The model was run including the independent variable of anterior contacts defined in three different ways: total contacts (adding the maxillary and mandibular contacts together, 0-10), maxillary contacts only 5), and mandibular contacts only (0-5). Results for each model are shown in Tables 3.1, 3.2, and 3.3. Forwards variable selection was used to include the most important and significant variables. Age in months and insurance were included in the zeromodel part of the regression to account for the excessive number of subjects without any posterior interproximal caries. The other variables included in the model were race, dental home status, and the clinical variables of contacts, plaque, and enamel defects/deep pits and fissures. The clinical variables of visible caries and white spot lesions were not included in the model because these variables indicate presence of disease. Across all three models, the significant variables were consistently age, dental home status, and plaque. Contacts slightly varied in significance, where total contacts and mandibular contacts only were both significant in separate models; however, when maxillary contacts only were included in the model they were not significantly associated with the number of posterior interproximal caries.
in our most parsimonious model, when maxillary contacts was analyzed with the AAPD Caries Risk Assessment Form variables, it held significance (Rate Ratio=1.17, 95% CI(1.07, 1.29)) along with visible caries (Rate Ratio=3.06 , 95% CI(1.81, 5.20)) and plaque (Rate Ratio=1.88 , 95% CI(1.17, 3.02)). When the mandibular contacts only was added they also remained significant (Rate Ratio=1.11, 95% CI(1.03, 1.20)) in addition to visible caries (Rate Ratio=2.62, 95% CI(1.52, 4.50)) and plaque (Rate Ratio=1.67, 95% CI(1.14, 2.85)).
DISCUSSION
The overall caries rate for the study population was 52.5%, this is higher than the reported 42% of 2-11 year olds by NHANES from 1999-2004.1 The caries pattern of interest for this study was posterior interproximal caries which were present in 43.1% of this population of 42-60 month old children which was close to the predicted 40% used for the power analysis. The ability to accurately and reliably identify these children as early as possible, before the caries process has initiated, is the goal of caries risk assessment and the goal of this study.
Overall, 60.3% of the subject population had mostly spacing (either zero or one closed contact) in the maxillary arch and 55.4% had mostly spacing in the mandibular arch. This is lower than the expected values of generalized spacing in about two-thirds of children.20,21 Conversely 49.7% had less spacing and were more crowded in the maxillary arch and 44.6% had less spacing and were more crowded in the mandibular arch. Warren and Bishara23 found more crowding was observed between two 50 year time points and this study showed a higher prevalence of crowding that earlier studies.20,21,23
continued to show significance were age and dental home status, although this study did control for insurance type.
When the three different groupings of anterior contacts are examined in the multivariate analyses, total contacts (maxillary plus mandibular) and mandibular contacts are significant but maxillary contacts are not. A possible explanation for this is that the maxillary teeth reside in cancellous bone which is easily molded and changed perhaps due to a digit or pacifier habit or affected by the presence of a low, thick frenum.28 The lower incisors reside in the mandible which is encased in cortical bone and less effected by outside environmental factors,28 thus making “lower incisor crowding” a more stable clinical variable.
Visible caries repeatedly showed significance in these models, when included. It is the only variable that holds significance when only the current AAPD Caries Risk Assessment Variables are put into the experimental multivariate model for posterior interproximal caries. It was not included in the experimental study model of this study because it is the disease itself. If one is truly attempting to prevent any disease, then it is not prudent to predict disease by using the disease itself as a risk factor. This is also the argument for not including incipient white spot lesions in the study model as well.
seven subjects of the entire population were at risk for dry mouth this variable was not included in subsequent multivariate analyses. Of interest, the results of this study show that if a parent reported any flossing of their child’s teeth at home, the relative risk was statistically significant for both any caries as well as interproximal caries. Flossing is a difficult variable to assess throughout the literature because some studies use
professionally completed flossing and rarely use self-completed flossing.29 In the literature, there is one meta-analysis that shows professional flossing as significant preventive measure of interproximal caries, however there are no trials that could be found using unsupervised conditions for flossing.29 While the actual flossing process was not specifically investigated, the findings of this study would show a protective factor on self-performed flossing at home based on the bivariate analyses. Because the caries process is multi-factorial in nature, a model that incorporates many of these variables together is necessary to best identify caries risk factors.
While contacts were not statistically as strong as the other risk factors such as plaque or dental home status, it is a variable that consistently remained significant throughout the models. Model results were used to calculate expected posterior
overall increase is 1.5 posterior interproximal caries lesions from zero to ten contacts and an overall 54.9% increase in posterior interproximal lesions. When looking at maxillary contacts, although overall not significant, the average number of posterior interproximal caries for the reference subject is 2.86 (95% CI(1.84, 4.45)) with zero closed anterior contacts. For each additional increase in closed anterior maxillary contact the number of posterior interproximal caries increases by an average of .22. The overall increase is 1.08 posterior interproximal caries and a 37.8% increase in posterior interproximal lesions. When looking at mandibular contacts, the average number of posterior interproximal caries for the reference subject is 2.90 (95% CI(1.95, 4.31)) with zero closed anterior contacts. For each additional increase in closed anterior mandibular contact the number of posterior interproximal caries increases by and average of .27. The overall increase is 1.36 posterior interproximal caries and a 46.9% increase in posterior interproximal caries. The limitation to these calculations is that they rely on a mean calculation of posterior interproximal caries and as has been mentioned before the distribution is skewed towards zero. This calculation illustrates an increase in posterior interproximal caries with an increase in contacts; however, using this mean calculation even the reference subject starts out with posterior interproximal caries.
the dental home concept and first dental visit by age one11 because the earlier a child has a dental home the less at risk he/she is from the development of posterior interproximal caries. Because the dental home remains significant in most models, it may be a better surrogate measure for preventive strategies than measuring toothbrushing, flossing, and diet individually.
Limitations and Strengths
There were multiple dentist examiners conducting the clinical examinations but all were calibrated to use the data collection form and to identify the presence or absence of interdental spacing as well as the other clinical risk factors. Caregiver reporting bias can be an issue because many of the biological and protective variables rely on the subjects’ caregivers to honestly answer questions. In addition there is bias in our sample population due to convenience sampling of a dental care seeking sample. While the study held enough power for analysis of the entire study population, more subjects are needed to be able to obtain adequate power to analyze the two sites separately. This would be ideal as there are inherent differences between sites, although this study chose to use insurance as its control variable since that was the largest difference. This study also did not look at saliva samples or bacterial counts which are a risk factor in the AAPD Caries Risk Assessment Form.2 The addition of this risk factor would enhance the clinical variables portion of this study.
assist in risk identification. By drawing participants from both private practice and the dental school setting, it was the hope to achieve more generalizable results. The inclusion of participants treated under general anesthesia was intended to reduce behavioral bias that could result if diagnostic radiographs could not be obtained on uncooperative subjects. Using one examiner to read all radiographs helped to eliminate inter-examiner bias of the outcome variable. The use of a multivariate regression model helps to better assess risk of such a complex diseases pattern as caries, better than a bivariate analysis alone.
Future Research
Several hypotheses were generated for future investigation. Future studies in this area should look further into the variable of age. Perhaps the age range in this study was too broad and a confounding variable since it was continually significant in multiple models. Future studies should start at age four to give time for the interproximal lesions to develop. Including children three and a half to four years of age may have included subject that would eventually go on to develop interproximal caries. The actual time it takes for interproximal caries to develop from the point of contact between any two primary molars was not been identified. Or even more interesting, collecting more subjects at different, more narrow age ranges to assess more clearly the time points at which posterior interproximal caries begins.
of them had many closed anterior contacts. It would be of interest to look into dental crowding, diet, and caries risk factors in this population that, from the limited number collected in this study would be considered high risk.
CONCLUSIONS
1. Lack of anterior interdental spacing in the primary dentition is a statistically significant variable in the study of posterior interproximal caries, especially the lack of mandibular anterior interdental spacing.
2. Plaque, dental home status, and age were also significant variables for posterior interproximal caries in the multivariate regression model.
Table 1.1: Descriptive statistics for the study population as a whole and divided by site
All Site
UNC Duke
N 204 101 103
Sex
Female N (%) 113 (55.4%) 54 (53.5%) 59 (57.3%)
Male N (%) 91 (44.6%) 47 (46.5%) 44 (42.7%)
Race
African American N (%) 27 (13.2%) 12 (11.9%) 15 (14.6%)
Hispanic N (%) 51 (25.0%) 49 (48.5%) 2 (1.9%)
Other N (%) 20 (9.8%) 11 (10.9%) 9 (8.7%)
Caucasian N (%) 106 (52.0%) 29 (28.7%) 77 (74.8%)
MonthAge Mean
(Std)
51.2 (5.9) 50.5 (5.5) 51.8 (6.3)
Insurance
Medicaid N (%) 89 (43.6%) 80 (79.2%) 9 (9.7%)
Private Insurance/Cash N (%) 115 (56.4%) 21 (20.8%) 94 (91.3%)
Dental Home Frequency
Table 1.2: Descriptive statistics for the experimental variables of the study population
All
Site
UNC Duke
N 204 101 103
Any Caries
Yes N (%) 107 (52.5%) 71 (70.3%) 36 (35.0%)
No N (%) 97 (47.6%) 30 (29.7%) 67 (65.1%)
Anterior Interproximal Caries
Yes N (%) 45 (22.1%) 38 (27.6%) 7 (6.8%)
No N (%) 159 (77.9%) 63 (62.4%) 96 (93.2%)
Posterior Interproximal Caries
Yes N (%) 88 (43.1%) 57 (56.4%) 31 (30.1%)
No N (%) 116 (56.9%) 44 (43.6%) 72 (69.9%)
Posterior Interproximal Caries
Mean (Std)
2.3 (3.4) 3.0 (3.6) 1.7 (3.0)
Count Median
(P25, P75)
0 (0,4) 2 (0,5) 0 (0,3)
Total Contacts (mandibular and
maxillary)
Mean (Std)
3.5 (3.6) 3.3 (3.5) 3.7 (3.7)
Median
(P25, P75)
2 (0,7) 2 (0,7) 2 (0,7)
Contact CH (maxillary contacts)
Mean (Std)
1.6 (1.8) 1.4 (1.7) 1.7 (1.9)
Median
(P25, P75)
1 (0,3) 1 (0,3) 1 (0,3)
Contact MR (mandibular contacts)
Mean (Std)
1.9 (2.1) 1.8 (2.2) 2.0 (2.0)
Median
(P25, P75)
Table 2.1: Bivariate analysis: Risk ratio calculations for presence of any caries and Kruskal-Wallis tests comparing the distribution of number of caries across variable levels
Variables Total (N) Any Caries Yes Any Caries No Risk Ratio 95% Confidence Interval Kruskal-Wallis p-value
Site <0.01
UNC 101 71 30 1.00 —
Duke 103 36 67 0.50 (0.37, 0.67)
Race 0.02
African American
27 16 11 1.46 (0.99, 2.15)
Hispanic 51 34 17 1.64 (1.22, 2.22)
Other 20 14 6 1.73 (1.19, 2.49)
Caucasian 106 43 63 1.00 —
Sex 0.49
Female 113 58 55 0.95 (0.73, 1.24)
Male 91 49 42 1.00 —
Insurance <0.01
No Private Insurance
98 66 32 1.74 (1.32, 2.30)
Private Insurance
106 41 65 1.00 —
Dental Home Status
<0.01
Lacks dental home
88 65 23 2.04 (1.55, 2.68)
Regular dental home
Table 2.2: Bivariate analysis: Risk ratio calculations for parent reported variables for presence of any caries and Kruskal-Wallis tests comparing the distribution of number of caries across variable levels
Parent Reported Variables Total (N) Any Caries Yes Any Caries No Risk Ratio 95% Confidence Interval Kruskal-Wallis p-value
Dry Mouth 0.45
Yes 7 4 3 1.09 (0.57, 2.10)
No 197 103 94 1.00 —
Parent Caries History
<0.01
Yes 123 79 44 1.61 (1.15, 2.25)
No 60 24 36 1.00 —
Snacks 0.01
>3 41 31 10 1.47 (1.14, 1.89)
1 to 2 109 56 53 1.00 —
Fluoridated Toothpaste
0.38
No 8 3 5 0.71 (0.29, 1.75)
Yes 196 104 92 1.00 —
Fluoridated Water
0.02
No 60 40 20 1.43 (1.12, 1.84)
Yes 142 66 76 1.00 —
Toothbrushing 0.29
0-1x/day 58 34 24 1.18 (0.90, 1.55)
>1x/day 145 72 73 1.00 —
Flossing <0.01
None 103 69 34 1.78 (1.34, 2.37)
Some 101 38 63 1.00 —
Habits 0.13
Yes 28 11 17 0.72 (0.44, 1.16)
No 173 95 78 1.00 —
Table 2.3: Bivariate analysis: Risk ratio calculations for clinical variables for presence of any caries and Kruskal-Wallis tests comparing the distribution of number of caries across variable levels
Clinical Variables Total (N) Any Caries Yes Any Caries No Risk Ratio 95% Confidence Interval Kruskal-Wallis p-value Child Visible Caries <0.01
Yes 84 83 1 4.94 (3.45, 7.07)
No 120 24 96 1.00 —
Plaque <0.01
Present 118 72 46 1.50 (1.12, 2.01)
Absent 86 35 51 1.00 —
White Spot Lesions
<0.01
Present 73 65 8 2.78 (2.14, 3.61)
Absent 131 42 89 1.00 —
Enamel Defects/ Deep Pits &
Fissures
<0.01
Present 79 56 23 1.74 (1.35, 2.24)
Table 2.4: Bivariate analysis: Risk ratio calculations for continuous variables for
presence of any caries and Kruskal-Wallis tests comparing the distribution of number of caries across variable levels
Continuous Variables
Any Caries Yes (mean
contacts (SD))
Any Caries No (mean
contacts (SD))
Risk Ratio
95% Confidence
Table 2.5: Bivariate Analysis: Risk ratio calculations for presence of posterior interproximal caries and Kruskal-Wallis tests comparing the distribution of number of caries across variable levels
Variables Total
Post IP Caries Yes Post IP Caries No Risk Ratio 95% Confidence Interval Kruskal-Wallis p-value
Site <0.01
UNC 101 57 44 1.00 —
Duke 103 31 72 0.53 (0.38, 0.75)
Race 0.24
African American
27 11 16 1.14 (0.67, 1.91)
Hispanic 51 28 23 1.53 (1.07, 2.19)
Other 20 11 9 1.53 (0.96, 2.46)
Caucasian 106 38 68 1.00 —
Sex 0.36
female 113 45 68 0.84 (0.62, 1.15)
male 91 43 48 1.00 —
Insurance 0.01
No Private Insurance
98 53 45 1.64 (1.18, 2.27)
Private Insurance
106 35 71 1.00 —
Dental Home Status
<0.01
Lacks dental home
88 51 37 1.82 (1.32, 2.50)
Regular dental home
Table 2.6: Bivariate analysis: Risk ratios calculations for parent reported variables for presence of posterior interproximal caries and Kruskal-Wallis tests comparing the distribution of number of caries across variable levels
Parent Reported
Variables Total
Post IP Caries Yes Post IP Caries No Risk Ratio 95% Confidence Interval Kruskal-Wallis p-value
Dry Mouth 0.29
Yes 7 2 5 0.65 (0.20, 2.13)
No 197 86 111 1.00 —
Parent Caries History
<0.01
Yes 123 67 56 1.82 (1.19, 2.76)
No 60 18 42 1.00 —
Snacks 0.05
>3 41 24 17 1.36 (0.97, 1.90)
1 to 2 109 47 62 1.00 —
Fluoridated Toothpaste
0.28
No 8 4 4 1.17 (0.57, 2.38)
Yes 196 84 112 1.00 —
Fluoridated Water
0.03
No 60 33 27 1.45 (1.06, 1.97)
Yes 142 54 88 1.00 —
Brushing 0.26
0-1x/day 58 28 30 1.19 (0.85, 1.65)
>1x/day 145 59 86 1.00 —
Flossing <0.01
None 103 57 46 1.80 (1.28, 2.53)
Some 101 31 70 1.00 —
Habits 0.31
Yes 28 9 19 0.71 (0.41, 1.25)
No 173 78 95 1.00 —
Table 2.7: Bivariate Analysis: Risk ratio calculations for clinical variables for presence of posterior interproximal caries and Kruskal-Wallis tests comparing the distribution of number of caries across variable levels
Clinical
Variables Total
Post IP Caries Yes Post IP Caries No Risk Ratio 95% Confidence Interval Kruskal-Wallis p-value Child Visible Caries <0.01
Yes 84 65 19 4.04 (2.75, 5.93)
No 120 23 97 1.00 —
Plaque <0.01
Present 118 62 56 1.74 (1.21, 2.50)
Absent 86 26 60 1.00 —
White Spot Lesions
<0.01
Present 73 53 20 2.72 (1.98, 3.73)
Absent 131 35 96 1.00 —
Enamel Defects/ Deep Pits &
Fissures
<0.01
Present 79 45 34 1.66 (1.22, 2.25)
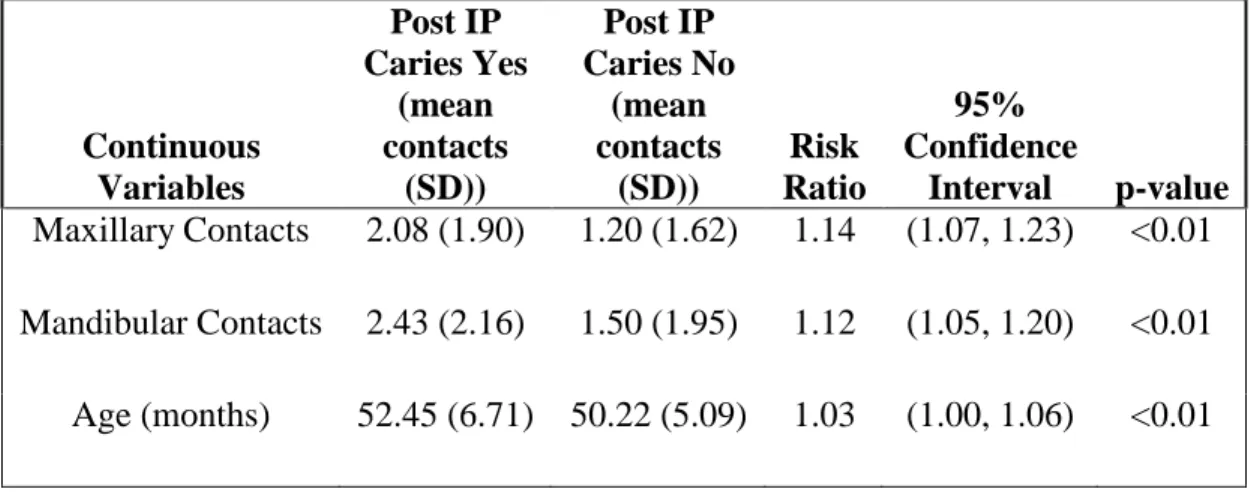
Table 2.8: Bivariate analysis: Relative risk calculations for continuous variables for presence of posterior interproximal caries and Kruskal-Wallis tests comparing the distribution of number of caries across variable levels
Continuous Variables
Post IP Caries Yes
(mean contacts
(SD))
Post IP Caries No
(mean contacts
(SD))
Risk Ratio
95% Confidence
Table 3.1: Zero-inflated Negative Binomial Regression Model for total (maxillary plus mandibular) contacts
Variable Rate Ratio
95% Confidence
Interval
Total contacts 1.04 (1.01, 1.09)
Age (months) 1.03 (1.01, 1.05)
Race
African American 0.75 (0.47, 1.19)
Hispanic 0.86 (0.58, 1.27)
Other 0.83 (0.54, 1.27)
Caucasian 1.00 —
Insurance
Medicaid 0.70 (0.48, 1.02)
Private Insurance/Cash 1.00 —
Dental Home Status
Lacks dental home 1.40 (1.05, 1.95)
Has dental home 1.00 —
Plaque
Yes 1.61 (1.12, 2.31)
No 1.00 —
Enamel Defects/ Deep Pits & Fissures
Yes 1.32 (0.95, 1.83)
Table 3.2: Zero-Inflated Negative Binomial Regression Model for maxillary contacts only
Variable Rate Ratio
95% Confidence
Interval Maxillary Contacts 1.07 (0.99, 1.15)
Age (months) 1.03 (1.01, 1.05)
Race
African American 0.77 (0.49, 1.23)
Hispanic 0.89 (0.60, 1.32)
Other 0.89 (0.59, 1.36)
Caucasian 1.00 —
Insurance
Medicaid 0.71 (0.49, 1.03)
Private Insurance/Cash 1.00 —
Dental Home Status
Lacks Dental Home 1.36 (1.03, 1,81)
Regular Dental Home 1.00 —
Plaque
Yes 1.64 (1.13, 2.37)
No 1.00 —
Enamel Defects/ Deep Pits & Fissures
Yes 1.29 (0.93, 1.79)
Table 3.3: Zero-Inflated Negative Binomial Regression Model for mandibular contacts only
Variable Rate Ratio
95% Confidence
Interval Mandibular Contacts 1.08 (1.01, 1.15)
Age (months) 1.03 (1.00, 1.05)
Race
African American 0.73 (0.46, 1.16)
Hispanic 0.83 (0.56, 1.22)
Other 0.80 (0.52, 1.24)
Caucasian 1.00 —
Insurance
Medicaid 0.70 (0.49, 1.01)
Private Insurance/Cash 1.00 —
Dental Home Status
Lacks dental home 1.39 (1.06, 1.83)
Regular Dental Home 1.00 —
Plaque
Yes 1.55 (1.09, 2.19)
No 1.00 —
Enamel Defects/ Deep Pits & Fissures
Yes 1.32 (0.96, 1.81)
Table 4.1: AAPD variables using the zero-inflated negative binomial model from this study
Variable Rate Ratio
95% Confidence
Interval Parent Caries History (+) 1.56 (0.92, 2.65)
Insurance (Medicaid) 0.68 (0.43, 1.09)
Snacks (>3) 1.13 (0.78, 1.62)
Fluoridated Water (No) 0.79 (0.54, 1.16)
Brushing (0-1x/day) 0.94 (0.66, 1.35)
Fluoridated Toothpaste (No) 1.61 (0.81, 3.19) Dental Home Status (Lacks) 1.01 (0.69, 1.46)
Child Visible Caries 2.88 (1.60, 5.17)
White Spot Lesions 1.61 (0.97, 2.66)
Enamel Defects/ Deep Pits & Fissures
0.95 (0.64, 1.42)
Table 4.2: AAPD variables using the zero-inflated negative binomial model with total contacts
Variable Rate Ratio
95% Confidence
Interval Parent Caries History (+) 1.53 (0.94, 2.50)
Insurance (Medicaid) 0.71 (0.45, 1.10)
Snacks (>3) 1.01 (0.71, 1.43)
Fluoridated Water (No) 0.78 (0.55, 1.12)
Brushing (0-1x/day) 0.87 (0.62, 1.23)
Fluoridated Toothpaste (No) 1.62 (0.85, 3.09) Dental Home Status (Lacks) 1.14 (0.79, 1.64)
Child Visible Caries 2.79 (1.65, 4.72)
White Spot Lesions 1.41 (0.88, 2.26)
Enamel Defects/ Deep Pits & Fissures
1.00 (0.68, 1.47)
Plaque 1.81 (1.14, 2.85)
Table 4.3: AAPD Variables using the zero-inflated negative binomial model with maxillary contacts
Variable Rate Ratio
95% Confidence
Interval Parent Caries History (+) 1.58 (0.96, 2.60)
Insurance (Medicaid) 0.74 (0.47, 1.15)
Snacks (>3) 1.09 (0.77, 1.56)
Fluoridated Water (No) 0.77 (0.54, 1.11)
Brushing (0-1x/day) 0.83 (0.58, 1.19)
Fluoridated Toothpaste (No) 1.57 (0.80, 3.07) Dental Home Status (Lacks) 1.14 (0.79, 1.65)
Child Visible Caries 3.06 (1.81, 5.20)
White Spot Lesions 1.47 (0.92, 2.35)
Enamel Defects/ Deep Pits & Fissures
0.97 (0.66, 1.44)
Plaque 1.88 (1.17, 3.02)
Table 4.4: AAPD Variables using the zero-inflated negative binomial model with mandibular contacts
Variable Rate Ratio
95% Confidence Interval Parent Caries History (+) 1.50 (0.92, 2.45)
Insurance (Medicaid) 0.69 (0.44, 1.06)
Snacks (>3) 0.99 (0.70, 1.41)
Fluoridated Water (No) 0.80 (0.56, 1.13)
Brushing (0-1x/day) 0.93 (0.66, 1.30)
Fluoridated Toothpaste (No) 1.65 (0.87, 3.12) Dental Home Status (Lacks) 1.09 (0.76, 1.56)
Child Visible Caries 2.62 (1.52, 4.50)
White Spot Lesions 1.42 (0.88, 2.30)
Enamel Defects/ Deep Pits & Fissures
1.01 (0.69, 1.47)
Plaque 1.67 (1.14, 2.85)
Table 5.1: Expected counts of posterior interproximal caries with increasing number of closed total anterior contacts
Total Contacts
Expected Count
95% Confidence
Interval
0 2.73 (1.77, 4.21)
1 2.85 (1.89, 4.30)
2 2.98 (2.01, 4.41)
3 3.11 (2.13, 4.54)
4 3.25 (2.26, 4.68)
5 3.40 (2.38, 4.85)
6 3.55 (2.50, 5.04)
7 3.71 (2.61, 5.26)
8 3.87 (2.72, 5.52)
9 4.05 (2.82, 5.81)
Table 5.2: Expected counts of posterior interproximal caries with increasing number of closed maxillary anterior contacts
Maxillary Contacts
Expected Count
95% Confidence
Interval
0 2.86 (1.84, 4.45)
1 3.05 (2.04, 4.56)
2 3.25 (2.24, 4.73)
3 3.47 (2.42, 4.96)
4 3.69 (2.59, 5.27)
Table 5.3: Expected counts of posterior interproximal caries with increasing number of closed mandibular anterior contacts
Mandibular Contacts
Expected Count
95% Confidence
Interval
0 2.90 (1.95, 4.31)
1 3.13 (2.16, 4.52)
2 3.38 (2.38, 4.80)
3 3.65 (2.59, 5.16)
4 3.94 (2.78, 5.60)
REFERENCES
1. Dye BA, Tan S, Smith V, Lewis BG, Barker LK, Thornton-Evans G, Eke PI, Beltran-Aguilar ED, Horowitz AM, and Li CH. Trends in Oral Health Status: United States, 1988-1994 and 1999-2004. Vital Health Statistics. 2007; Series 11, Number 248: 1-17.
2. American Academy of Pediatric Dentistry. Guideline on Caries-risk Assessment and Management for Infants, Children, and Adolescents. Pediatric Dentistry 2011-2012; 33(6) Reference Manual: 110-117.
3. Powell LV. Caries prediction: a review of the literature. Community Dent Oral Epidemiology 1998; 26: 361-371.
4. Li Y and Wang W. Predicting Caries in Permanent Teeth from Caries in Primary Teeth: An eight-year cohort study. Journal of Dental Research 2002; 81: 561-566.
5. McDonald RE, Avery DR, and Dean JA. Dentistry for the Child and Adolescent. 8 ed. St. Louis: Mosby Elsevier: 2004. (pg 178)
6. Dean JA, Barton DH, Vahedi I, and Hatcher EA. Progression of interproximal caries in the primary dentition. The Journal of Clinical Pediatric Dentistry 1997; 22(1): 59-62.
7. Vanderas AP, Kavvadia K, and Papagiannoulis L. Development of Caries in Permanent First Molars Adjacent to Primary Second Molars with Interproximal Caries: Four-year Prospective Radiographic Study. Pediatric Dentistry 2004; 26(4): 362-368.
8. USDHHS (2000). A report of the Surgeon General. Rockville, MD: Department of Health and Human Services, US Public Health Service.
9. Mouradian WE, Wehr E, Crall JJ. Disparities in children’s oral health and access to dental care. JAMA 2000; 284 (20): 2625-2631.
10.Casamassimo PS, Thikkurissy S, Edelstein BL, and Maiorini E. Beyond the dmft: The Human and Economic Cost of Early Childhood Caries. The Journal of the American Dental Association 2009; 140 (6): 650-657.
12.American Academy of Pediatrics (AAP). Bright Futures: Recommendations for Preventive Pediatric Health Care. http://brightfutures.aap.org. 2008.
13.American Academy of Pediatrics. Profile of pediatric visits: Tables 9-10 (based on 2000-2005 Medical Expenditure Panel Survey and 2000-2004 National Ambulatory Medical Care Survey). Updated June 2008. Available at :
http://practice.aap.org/public/ProfileOfPediatricVisits.pdf. Accessed January 5, 2009.
14.Pierce KM, Rozier RG, and Vann WF Jr. Accuracy of Pediatric Primary Care Providers’ Screening and Referral for Early Childhood Caries. Pediatrics 2002; 109(5): E82-2.
15.Parfitt GJ. Conditions Influencing the Incidence of Occlusal and Interstitial Caries in Children. Journal of Dentistry for Children 1956; 23: 31-39.
16.Featherstone JDB. The Caries Balance: Contributing Factors and Early
Detection. Journal of the California Dental Association 2003 February; 31(2): 129-133.
17.Allison PJ and Schwartz S. Interproximal Contact Points and Proximal Caries in Posterior Primary Teeth. Pediatric Dentistry 2003; 25(4): 334-340.
18.Proffit WR, Fields HW, Sarver DM. Contemporary Orthodontics. 4 ed. St. Louis: Mosby Elsevier; 2007. (pgs 86, 99)
19.Baume LJ. Physiological Tooth Migration and its Significance for the Development of Occlusion: I. The Biogenetic Course of the Deciduous Dentition. Journal of Dental Research 1950; 29(2): 123-132.
20.Foster TD. A Textbook of Orthodontics. 2 ed. St. Louis: Blackwell Scientific Publications; 1982.
21.Da Silva LP and Gleiser R. Occlusal Development Between Primary and Mixed Dentitions: A 5-year Longitudinal Study. Journal of Dentistry for Children 2008; 75(3): 287-294.
22.Tsai HH. Dental Crowding in the Primary Dentition and its Relationship to Arch and Crown Dimensions. Journal of Dentistry for Children 2003; 70(2): 164-169. 23.Warren JJ and Bishara SE. Comparison of Dental Arch Measurements in the
24.Howe RP, McNamara JA Jr, and O’Connor KA. An Examination of Dental Crowding and its Relationship to Tooth Size and Arch Dimension. American Journal of Orthodontics 1983; 83(5): 363-373.
25.Warren JJ, Slayton RL, Yonezu T, Kanellis MJ, and Levy SM. Interdental Spacing and Caries in the Primary Dentition. Pediatric Dentistry 2003; 25(2): 109-113.
26.Keels MA and Knee E. Pilot Study of Predicting Interproximal Caries in Children. Communication. 2009.
27.American Academy of Pediatric Dentistry. Guideline on Prescribing Dental Radiographs for Infants, Children, Adolescents, and Persons with Special Health Care Needs. Pediatric Dentistry 2011-2012; 33(6) Reference Manual: 289-291. 28.Seeman J, Kundt G, and Stahl de Castillon F. Relationship between occlusal
findings and orofacial myofunctional status in primary and mixed dentition: part IV: interrelation between space conditions and orofacial dysfunctions. Journal of Orofacial Orthopedics 2011; 72(1): 21-32.