OBSERVATIONAL METHODS IN CARDIOVASCULAR OUTCOMES RESEARCH
Jerome Jeffrey Federspiel
A dissertation submitted to the faculty of the University of North Carolina at Chapel Hill in partial fulfillment of the requirements for the degree of Doctor of Philosophy in the
Department of Health Policy and Management.
Chapel Hill 2013
Approved by:
© 2013
ABSTRACT
JEROME JEFFREY FEDERSPIEL: Observational Methods in Cardiovascular Outcomes Research
(Under the direction of Morris Weinberger)
Compared to randomized trials, observational methods have several advantages for cardiovascular outcomes research, including lower cost, reduced risk to subjects, and
improved generalizability. Here, I leverage recently-developed observational methodologies to address questions that would be difficult or impossible to conduct using randomized trials. Study 1 centers on patterns and predictors of stress test use after elective percutaneous coronary intervention (PCI). I find that: (1) stress testing is commonly performed after elective PCI in a pattern suggestive of routine testing; (2) risk factors thought to increase the potential value of such testing are paradoxically associated with lower use of testing, and (3) the rate of stress testing use varies strongly across the facilities participating in the national CathPCI Registry in a manner that is associated with higher rates of repeat revascularization procedures without reduction in death or myocardial infarction. Study 2 centers on the imaging modality (echocardiography versus nuclear imaging) chosen for patients receiving an exercise stress test after PCI. While many comparisons of test performance (i.e.,
sensitivity and specificity) have been made for echocardiography and nuclear imaging, little is known about the implications of test choice on clinical outcomes or resource use. I find that patients who receive echocardiography received fewer subsequent coronary
were noted. Study 3 illustrates the use of newly-developed instrumental variables
ACKNOWLEDGEMENTS
I sincerely appreciate my committee’s flexibility and patience with me as I worked through a rather unconventional dissertation, both in format and in execution. Particular thanks are owed to Morris Weinberger, for his steady guidance in bringing this dissertation to completion, and to Sally Stearns, who has supported and guided my work for the past four years.
In addition to my committee, I have benefitted from the support and guidance of numerous individuals outside UNC. Special thanks are due to a number of faculty members at the Duke Clinical Research Institute, including Pamela Douglas, Patricia Cowper, Cynthia Green, Bimal Shah, and Kevin Anstrom. Additional guidance was provided by Frederick Masoudi (University of Colorado) and Leslee Shaw (Emory University).
I am grateful to the members of my dissertation writing group (Alice
Fortune-Greeley, Kimberly Geissler, Mona Kilany, Ashley Kranz, Elizabeth La, Laurel Trantham) for their support over the years. Completing a dissertation is a unique experience which cannot be appreciated unless experienced and I am grateful for the opportunity to share this
the National Heart, Lung, and Blood Institute while completing this dissertation. Earlier phases of my medical training were funded by an award to the UNC MD/PhD Program (T32-GM008719) and funding from the State of North Carolina. Data for Study 1 was funded under contract no. HHSA29020050032I Task Order No. 4 from the Agency for Healthcare Research and Quality, U.S. Department of Health and Human Services as part of the Developing Evidence to Inform Decisions about Effectiveness (DEcIDE) program.
PREFACE
TABLE OF CONTENTS
LIST OF TABLES ... xi
LIST OF FIGURES ... xii
LIST OF ABBREVIATIONS ... xiv
Chapter 1. INTRODUCTION ...1
2. STRESS TESTING UTILIZATION AND MODALITY AFTER CORONARY REVASCULARIZATION ...7
AN IMPORTANT POLICY PROBLEM ...7
PATTERNS AND PREDICTORS OF STRESS TESTING AFTER ELECTIVE PCI (STUDY 1/CHAPTER 3) ...10
CHOICE OF STRESS TESTING MODALITY AFTER PCI (STUDY 2/CHAPTER 4) ...12
FIGURES ...16
3. STUDY 1: STRESS TESTING AFTER ELECTIVE REVASCULARIZATION...21
OVERVIEW ...21
INTRODUCTION ...22
METHODS ...23
RESULTS ...29
DISCUSSION ...33
TABLES ...38
FIGURES ...47
4. STUDY 2: STRESS TESTING IMAGING MODALITIES ...53
BACKGROUND ...54
METHODS ...55
RESULTS ...61
DISCUSSION ...64
TABLES ...70
FIGURES ...78
5. INSTRUMENTAL VARIABLES FOR RELEVANT ESTIMATES ...86
OVERVIEW ...86
INTRODUCTION ...87
CLINICAL CONTEXT ...93
A MODEL FOR TREATMENT SELECTION AND OUTCOMES ...97
EMPIRICAL APPROACH ...108
RESULTS ...112
DISCUSSION ...114
TABLES ...117
FIGURES ...129
6. CONCLUSIONS...138
STUDIES 1 AND 2 ...138
STUDY 3 ...144
SUMMARY ...145
APPENDIX A: DERIVATION OF STUDY COHORT ...146
APPENDIX B: R CODE TO IMPLEMENT PET-BASED IMPLEMENTATION OF LOCAL IV ...148
LIST OF TABLES
Table
3.1. Healthcare Common Procedure Coding System and International Classification of Diseases, ninth revision,
Clinical Modification codes used to define stress testing and outcomes ...38
3.2. Selected characteristics at time of elective PCI, and associations with stress testing rate ...39
3.3. Patient characteristics, by facility quartile of stress test use at 15 months after percutaneous coronary intervention ...42
3.4. Comparison of expected event rates, across quartiles of stress test utilization ...45
3.5. Alternative model specifications...46
4.1. Healthcare Common Procedure Coding System and International Classification of Diseases, ninth revision, Clinical Modification codes used to define stress testing and outcomes ...70
4.2. Baseline patient characteristics ...71
4.3. Propensity score model ...74
4.4. Unadjusted and adjusted cause-specific hazards models ...76
4.5. Robustness of inverse probability weighted model results to threshold value for time-varying effect ...76
4.6. Inverse probability weighted competing risk proportional hazards models ...77
5.1. Baseline patient characteristics ...117
5.2. Average marginal effects from probit and bivariate probit (IV) models...120
5.3. Complete probit and bivariate probit model results ...121
5.4. Tests for essential heterogeneity (at link scale) ...127
LIST OF FIGURES
Figure
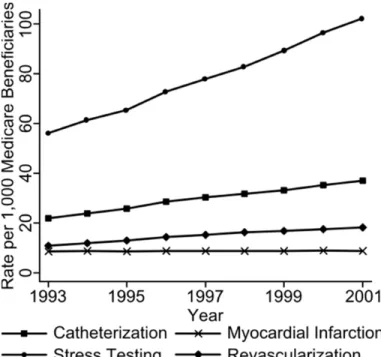
2.1. Temporal trends in stress testing utilization compared with rates of invasive testing (catheterization), coronary
revascularization and myocardial infarction: 1993-2001 ...16
2.2. Temporal trend in Medicare Part B spending on nuclear imaging (MPS), echocardiography (Echo), exercise testing (ETT), and cardiac catheterization (Cath) services: 2000-2008 ...17
2.3. Forms of stress tesing commonly performed in the United States ...18
2.4. Trend in type of stress test employed as function of time since PCI ...19
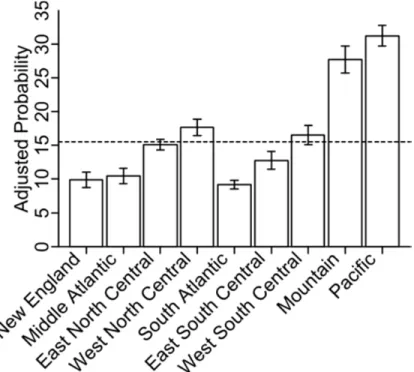
2.5. Probabilities of receiving an exercise stress test with echocardiography rather than nuclear imaging, by US Census division ...20
3.1. Study cohort flow ...47
3.2. Patterns of stress testing after PCI ...48
3.3. Stress testing use, stratified by patient characteristics ...49
3.4. Adjusted predictors of stress testing ...50
3.5. Stress testing patterns in higher-risk patients, by facility-level quartile of stress test use. ...51
3.6. Associations between facility-level quartile of stress test use among higher-risk patients and clinical outcomes ...52
4.1. Cohort selection diagram ...78
4.2. Unadjusted outcomes by stress test imaging modality ...80
4.3. Distribution of propensity scores ...81
4.4. Impact of inverse probability weighting on covariate balance. ...82
4.5. Temporal stability of facility-level imaging modality selection ...83
4.7. Inverse propensity weighted (IPW)-adjusted cumulative
incremental costs ...85
5.1. Heterogeneity diagram ...129
5.2. Study flow diagram ...130
5.3. Temporal trends in drug-eluting stent use over the study period ...131
5.4. Unadjusted cumulative incidence of outcomes ...132
5.5. Standardized differences in baseline patient, procedural, and facility characteristics ...133
5.6. Predicted event rate based on observed baseline covariates, stratified by DES receipt and time of PCI procedure ...134
5.7. Comparison of bootstrapped replicates to point estimates ...135
LIST OF ABBREVIATIONS
ACC – American College of Cardiology
ACCF – American College of Cardiology Foundation ACS – Acute coronary syndrome
AHA – American Heart Association
AHRQ – Agency for Healthcare Research and Quality ATE – Average treatment effect
AUC – Appropriate use criteria BMS – Bare metal stent
CABG – Coronary artery bypass grafting CER – Comparative effectiveness research CI – Confidence interval
CMS – Centers for Medicare and Medicaid Services CVD – Cardiovascular disease
DES – Drug-eluting stent ECG – Electrocardiogram Echo – Echocardiography
ESC – European Society for Cardiology FFS – Fee for service
HR – Hazard ratio
HCPCS – Healthcare Common Procedure Coding System
IV – Instrumental variable
LATE – Local average treatment effect LIV – Local instrumental variable
MedPAR – Medicare Provider Analysis and Review MI – Myocardial infarction
MTE – Marginal treatment effect
NCDR – National Cardiovascular Data Registry NIH – National Institutes of Health
NSTEMI – Non ST-elevation myocardial infarction OR – Odds ratio
PeT – Person-centered treatment effects PCI – Percutaneous coronary intervention STEMI – ST-elevation myocardial infarction TT – Effect of treatment on the treated TUT – Effect of treatment on the untreated UA – Unstable Angina
US – United States
1. INTRODUCTION
In economically-developed countries such as the United States, the burden of
cardiovascular disease (CVD) on morbidity and mortality has steadily declined for over fifty years. Between 1968 and 2006, the age-adjusted CVD mortality rate in the US fell by 65 percent (1). While lifestyle changes such as reduced smoking rates and improved nutrition are responsible for some of this decline, half of the reduction in death due to coronary heart disease that occurred in the 1980s and 1990s was due to improved medical treatment (2-4).
Improvements in treatment are certainly due in part to the development of novel treatments for CVD, but health services research’s role in optimizing the delivery of cardiovascular care is also a critical driver of improved CVD outcome (5-8). For example, despite its low cost and compelling evidence of survival benefit, aspirin was prescribed for only 60 percent of Medicare beneficiaries who experienced a myocardial infarction in 1992-1993 (9). After health services researchers brought attention to this quality issue, prescription rates increased to 90% by 2001 (10). Similarly, the development of percutaneous coronary intervention (PCI) to terminate certain types of myocardial infarction (ST-elevation
Despite impressive progress, CVD remains an important clinical and public health problem. It continues to be the most common cause of mortality in the United States, responsible for 34 percent of deaths in 2006 (1). By 2030, it is projected that 41 percent of the United States population will have been diagnosed with some form of CVD (14).
Additionally, improvements in outcome have come at growing financial cost to both patients and third party payers. Direct medical expenditures on CVD were estimated to exceed $324 billion in 2010, and the growth in CVD-related medical care costs exceeds even the general rate of medical care inflation (15). As a result, CVD-related care is an increasingly important component of the overall explosive growth in American medical care spending, which ultimately threatens the ability of patients to access appropriate medical care (16). Thus, the agenda for CVD-related health services research in the 21st century must include identifying approaches that continue the trend of steadily improving patient outcomes in a manner that is sensitive to resource use.
Randomized trials are considered the gold standard methodology to evaluate the efficacy of interventions, because a well-conducted randomized trial is the methodology that is least vulnerable to bias due to confounding (i.e., treatment assignment is exogenous by construction). However, trials are conducted under highly controlled conditions, with a narrow range of patients, which limits their generalizability to real world patients and practices. The use of observational data has several compelling advantages for CVD-related health services research (17):
patients with comorbid conditions, current randomized trial design and recruitment efforts result in cohorts that under-represent the elderly, women, and racial or ethnic minorities (18). Furthermore, because patients must consent to participate in trials, those who agree to study enrollment differ in systematic ways from patients who refuse to consent (19, 20). Because the effects of most medical treatments are likely heterogeneous (i.e., treatments work better in some patients than others), the fact that patients enrolled in clinical trials may be
systematically different than the typical patient eligible for treatment is a significant limitation of randomized trials.
2. The sample sizes attainable with some observational datasets allows for the assessment of rare outcomes for which trials would be prohibitively expensive. Recent efforts to control the Federal deficit will impact the amount of funding available for
biomedical research. The 1% decrease in the National Institutes of Health budget for Fiscal Year 2011 was only the second reduction in the NIH budget since 1970. As research budgets continue to shrink in real dollar terms, the lower cost of observational methods will be increasingly attractive, especially for research questions in which there is no commercial enterprise willing to fund trials. For similar reasons, the larger sample sizes obtainable in observational research also facilitate clinically-relevant subgroup analyses that would not be adequately powered in a trial.
3. Finally, the use of observational data allows for comparisons that would be
impractical or unethical in trials. Policy questions concerning the optimal benefits structure of government health insurance can be challenging to test using randomized trials for political reasons, particularly when many populations covered by government health
practice guidelines, pre-existing evidence of benefit can create an ethical prohibition against randomizing patients to a control group. Such ethical limitations, while clearly appropriate, nonetheless mean that it is difficult to use trials to measure the impact of non-adherence to clinical guidelines on patient outcome.
The three studies outlined in this dissertation leverage observational methods to conduct CVD-related health services research intended to inform efforts in the clinical and policy realms to improve outcomes while controlling costs. All three studies focus on
questions related to the management of patients receiving percutaneous coronary intervention (PCI). Studies 1 and 2 focus on post-PCI care by characterizing patterns of care and
outcomes associated with the use of coronary stress testing. Understanding the optimal use of cardiac testing procedures is an important clinical and policy problem, but a lack of evidence regarding the effects of testing on patient outcomes and treatment costs complicates these efforts. Study 3 focuses on a peri-procedural treatment decision – whether to deploy bare metal or drug-eluting stents. Each study is briefly described below.
Study 1: Stress testing patterns and predictors after elective PCI. Current treatment guidelines recommend that, for patients receiving elective PCI, stress testing should be reserved for the evaluation of recurrent symptoms rather than screening asymptomatic patients for recurrent ischemia (at least in the first two years following PCI). In this aim, we evaluated: (a) patterns in the use of stress testing after elective PCI; (b) predictors of stress test use; (c) correlations between facility-level variation in stress test use and both underling patient risk and subsequent patient outcomes.
optimal imaging modality to employ when performing imaging-based exercise stress testing after PCI – echocardiography (cardiac ultrasound) or nuclear imaging. In this aim, we used longitudinal claims data from a population of Medicare beneficiaries receiving PCI for acute coronary syndromes to measure the downstream resource use and clinical outcomes
associated with the choice of imaging modality.
Study 3: Local instrumental variables methods for evaluating drug-eluting and bare metal stents for PCI. Instrumental variables methods have gained some traction in the outcomes research literature, based on their ability to adjust for endogenous treatment selection (i.e., confounding) due to factors unobserved in the data available for analysis. However instrumental variables methods have a major limitation – they result in an estimate that reflects the local average treatment effect – the effect of a treatment on a hypothetical population that cannot generally be identified in practice. Methods developed by James Heckman and Edward Vytalcil and promoted in the outcomes research literature by Anirban Basu integrate an economic model of human behavior into the estimation approach in order to obtain results with greater policy relevance then the local average treatment effect
available from traditional instrumental variable methods. Specifically, the use of “local instrumental variable” methods provide estimates of the average treatment effect, the effect of treatment on the treated, the effect of treatment on the untreated. In this study, I
demonstrate an application of this methodology using the example of drug-eluting and bare metal coronary stents.
2. STRESS TESTING UTILIZATION AND MODALITY AFTER CORONARY REVASCULARIZATION
Understanding the optimal use of noninvasive cardiac testing procedures is an important clinical and policy problem, but a lack of evidence regarding the effects of testing on patient outcomes and treatment costs complicates these efforts. Papers 1 and 2 of this dissertation evaluate the use of stress testing after percutaneous coronary intervention. In this chapter, I provide additional background information on the use of coronary stress testing, its role in patients who have received elective PCI, and choices of stress testing modalities.
AN IMPORTANT POLICY PROBLEM
Non-invasive cardiac testing has undergone tremendous technological innovation in the past twenty years, as advancements across testing modalities have led to improvements in capabilities to evaluate cardiac physiology and anatomy while sparing patients the risks and expense of invasive tests such as cardiac catheterization. Enormous growth in utilization of non-invasive cardiac testing has resulted (Figure 2.1) (21, 22). The overall utilization and
and strong associations between having an ownership stake in an imaging device and the rate at which cardiologists employ imaging have raised concerns that financial interests rather than medical necessity drive imaging decision making (22, 24, 26-28). The financial toll of the growth in testing use, in concert with evidence of geographic and provider variation in testing utilization, explains why non-invasive cardiac testing is an important focus for both clinicians and policymakers (29, 30).
Numerous efforts have been implemented to control unnecessary utilization of non-invasive cardiac testing. Payers have attempted to limit utilization through both changes in financial incentives and direct supervision of medical decision-making. Medicare
reimbursement for cardiac imaging services has been reduced on several occasions – most recently in 2010, when CMS imposed a 36 percent reduction in reimbursement for the most common type of nuclear cardiac imaging test (single-photon emission computed
tomography) and a 10 percent reduction for most forms of echocardiography (cardiac ultrasound) (31). In the private insurance market, there has been increased enthusiasm for applying managed care principles to imaging through pre-authorization review requirements administrated by radiology benefits management organizations (RBMs)(32, 33). The
cardiology profession and allied groups have also responded to concerns about the growth in cardiac imaging use by developing voluntary practice guidelines from the American College of Cardiology and American Heart Association as well as Appropriate Use Criteria (AUC) from the American College of Cardiology Foundation (ACCF) (34).
Recent evidence suggests that this multifaceted approach is succeeding, with modest reductions in imaging utilization among Medicare beneficiaries (Figure 2.2) (35). However,
tools that do not distinguish between high- and low-value applications. There is evidence that cardiac imaging is overused for some applications, but also underused for some high-value indications (36). Thus, simple reimbursement reductions may have unintended consequences. The ACCF’s AUC provide for clinical scenarios based on expert assessment on whether imaging use is appropriate (34). AUC have now been issued for all forms of cardiac imaging (37-39). However, AUC and similar guidelines committees frequently rely on expert
opinion–only 1% of ACC/AHA imaging guidelines are based on “A”-quality evidence (40). It is common for experts to disagree – for example the routine use of echocardiography after cardiac resynchronization therapy implantation for device optimization was considered of uncertain benefit by AUC evaluators, with estimates of its appropriateness ranging widely from 4-9 across a fifteen judge panel (1-3 is considered “inappropriate”, 4-6 “uncertain”, and 7-9 “appropriate”) (37). Thus, promulgation and widespread adoption of these guidelines is hampered by a paucity of rigorous empirical evidence regarding imaging’s effects on outcomes, overall care processes, and cost (41, 42).
PATTERNS AND PREDICTORS OF STRESS TESTING AFTER ELECTIVE PCI (STUDY 1/CHAPTER 3)
Stress testing is a non-invasive test used to assess for significantly occluded coronary arteries. It is considered a “functional” test in that it measures the impact of occlusion on the myocardium (cardiac muscle), rather than an “anatomic” test (such as coronary angiography or cardiac computed tomographic angiography) that measures the narrowing of blood flow in the coronary arteries directly. The use of stress testing in patients who have previously received revascularization with PCI (commonly known as angioplasty) is an indication for which additional evidence is sorely needed to inform clinical practice. For patients who have received PCI, current major society guidelines and AUC consider assessment of recurrent chest pain to be an appropriate use of stress testing (referred to throughout this document as "symptom-driven testing"). However, the guidelines are also unanimous in recommending against the routine use of stress testing in asymptomatic patients to detect recurrent,
asymptomatic cardiac ischemia after revascularization (referred to throughout this document as "surveillance testing") (38, 45, 46). This guidance was recently reflected by the American College of Physician’s “Choosing Wisely” campaign, in which the use of stress testing for surveillance testing was selected by both the American College of Cardiology and the American Society of Nuclear Cardiology as part of their lists of five common practices that ought to be questioned by patients and providers (47).
stenosis and consequently do not impact myocardial function until they rupture, thus they cannot be detected by stress testing (48, 49). The overwhelming number of lesions that are identified by surveillance stress testing would be those for which preemptive treatment with revascularization would be unlikely to prevent major cardiac events. While some of these lesions may eventually cause stable anginal symptoms, early intervention is unlikely to offer benefit. Furthermore, falsely positive results from stress testing subject patients to
unnecessary anxiety and additional unnecessary procedures such as coronary angiography – procedures that come with their own attendant risks and costs.
While experts agree that stress testing should not be routinely performed after PCI, evidence from a large private insurer and the Medicare program demonstrated that stress testing is widely employed in the post-PCI population at rates that far exceed estimates of the incidence of recurrent chest pain in such a population (44, 50). These findings suggest that physicians are employing stress testing in post-PCI populations for indications other than those recommended by current AUC and clinical guidelines (i.e., they are using stress testing for surveillance testing). Because the current guidelines provide only limited consideration of the likely heterogeneity in the value of stress testing, one possible explanation for the
CHOICE OF STRESS TESTING MODALITY AFTER PCI (STUDY 2/CHAPTER 4)
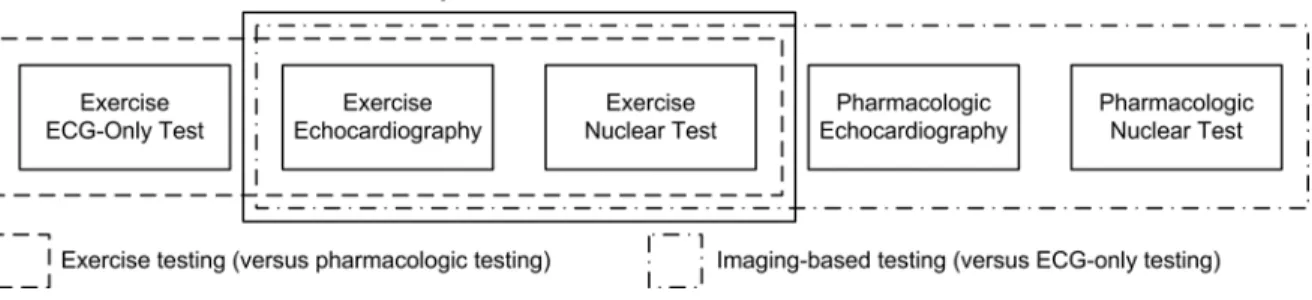
While efforts continue to define more precisely when stress testing should be employed after PCI, understanding which modality of stress testing is optimal is also an important clinical and policy question. Two main parameters define how a stress test is conducted (Figure 2.3):
1. Imaging modality: Stress testing can be conducted with electrocardiography (ECG) alone or with imaging; if imaging is used, by far the two most commonly employed techniques in the United States are nuclear imaging and echocardiography. No single approach is
universally optimal. ECG-based stress testing is inexpensive, but has limited sensitivity and is often not interpretable in the setting of left bundle branch block or paced ventricular rhythms (46). While stress echocardiography and nuclear stress imaging perform similarly in ischemia detection, they differ in other key respects (56, 57). Fundamentally,
echocardiography and nuclear imaging measure related, but subtlety different, phenomena. Nuclear imaging measures the perfusion of blood within the myocardium, and
modalities. In particular, the most common nuclear imaging technique (tomographic myocardial perfusion imaging) costs Medicare an average of $478, while stress echocardiography costs $210 (60). Recent evidence suggests that most stress testing
conducted after revascularization is conducted with nuclear imaging; whether this approach represents optimal practice is unclear (50).
2. Stress modality: Stress testing can be conducted with stress induced by either exercise or administration of pharmacologic agents. Exercise stress testing provides information about cardiac function in the context of normal activity and avoids side effects from pharmacologic stress agents. In addition, exercise capacity is itself a useful prognostic indicator, and in elderly patients may be the strongest available predictor of mortality and cardiovascular events (61, 62). Stress induced by pharmacologic agents can only be performed with imaging (i.e., no ECG-only testing). Therefore, it is recommended that pharmacologic stress testing be reserved for patients who are unable or unwilling to exercise adequately (>85% of age-predicted maximal heart rate),(46) and guidelines for stress testing assume that providers will use exercise testing whenever possible (37, 38).
Preliminary data suggest the most promising comparison is between exercise echocardiography and exercise nuclear testing. Federspiel et al. conducted a retrospective cohort study using 2006-2008 data to identify contemporary patterns, predictors, and implications of stress testing modality in the year following PCI.(63) We made three binary comparisons of modality:
1) exercise testing with ECG alone versus exercise testing with imaging (either nuclear imaging or echocardiography);
3) exercise echocardiography versus exercise nuclear testing.
Using a combination of registry and administrative (claims) data from the Medicare program, we documented several findings:
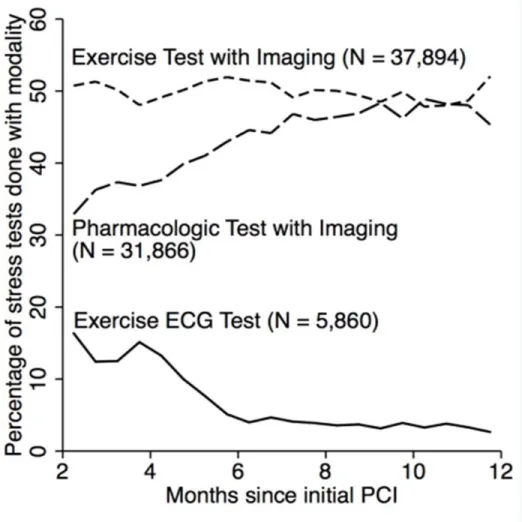
1. Among patients receiving exercise stress tests, baseline clinical characteristics of patients receiving testing with and without imaging were similar. However, the proportion of tests performed without imaging was far higher in the first six months post PCI than later, suggesting that ECG-only exercise tests are employed for a different purpose than imaging-based exercise tests (i.e., that there is confounding by test indication) (Figure 2.4)1. Among
patients receiving an imaging-based stress test, patients receiving pharmacologic stress testing were older and had higher rates of most comorbidities than patients receiving exercise stress testing, suggesting that this decision largely reflects differences in underlying risk (i.e., that there is confounding by patient characteristics). In contrast, patients receiving an
exercise stress test with nuclear imaging appeared similar in most respects to patients receiving echocardiography, and there were no strong differences in test timing noted between echocardiography and nuclear-based tests. Based on these results, I concentrated this Study on the decision to use exercise echocardiography or nuclear testing.
2. Both with and without statistical adjustment for patient characteristics, there was pronounced geographic variation in whether patients undergoing an exercise stress test with imaging received nuclear or echocardiography (Figure 2.5). Rates varied from 9.1% in the
South Atlantic Census Division to 31.2% in the Pacific Division, a 3.4-fold difference.
3. The choice of echocardiography versus nuclear imaging for exercise stress testing was associated with short-term differences in downstream procedure use. The cumulative incidence of repeat stress testing within 90 days of the initial stress test was higher in exercise echocardiography compared with exercise nuclear imaging tests, but the incidence of subsequent cardiac catheterization and revascularization were lower.
4. While the overall cumulative incidence of stress testing post-PCI declined by approximately 17 percent between 2006 and 2008, the proportion of stress tests performed with each modality varied little over the time period. These results suggest that broad-based reductions in stress test utilization post-PCI, rather than targeted changes in the use of specific modalities, have occurred in recent years.
FIGURES
Figure 2.1: Temporal trends in stress testing utilization compared with rates of invasive
Figure 2.2: Temporal trend in Medicare Part B spending on nuclear imaging (MPS),
echocardiography (Echo), exercise testing (ETT), and cardiac catheterization (Cath) services: 2000-2008.
Figure 2.4: Trend in type of stress test employed as function of time since PCI.
Figure 2.5: Probabilities of receiving an exercise stress testing with echocardiography rather
than nuclear imaging, by US Census division.
3. STUDY 1: STRESS TESTING AFTER ELECTIVE REVASCULARIZATION
OVERVIEW
demonstrated no association between stress testing rates and death (p=0.61) or readmission for MI (p=0.76), but a positive association with repeat revascularization (p=0.008). Stress testing after elective PCI is common, performed more frequently in lower-rather than higher-risk patients, and occurs in a pattern indicating routine annual testing. Even in higher higher-risk patients, associations between facility-level stress testing rates and increased use of repeat revascularization without differences in mortality or MI-related readmission suggest limited value from scheduled testing, providing an opportunity to improve management approaches after elective PCI.
INTRODUCTION
Current American College of Cardiology (ACC) Foundation appropriate use criteria (AUC) deem imaging-based stress testing within two years of percutaneous coronary intervention (PCI) as appropriate in patients who have recurrent symptoms consistent with further coronary obstruction (“symptom-driven testing”), but inappropriate in asymptomatic individuals (“surveillance testing”) (37, 38). Routine stress testing was also deemed not beneficial in joint ACC/American Heart Association/Society for Cardiovascular
Angiography and Interventions guidelines for PCI (64) and targeted as unnecessary in the ACC contribution to the “Choosing Wisely” initiative (47).
- limiting the value of broad recommendations such as the current AUC and clinical guidelines and motivating the value of targeted examinations of stress test usage.
To explore these issues, we linked detailed clinical data provided by the CathPCI Registry to longitudinal data from the Centers for Medicare & Medicaid Services (CMS) to determine among patients receiving elective PCI for coronary disease: 1) patterns of stress testing after elective PCI; 2) associations between clinical factors and stress testing use; and 3) for higher-risk patients, associations between facility-level utilization of stress testing after PCI and outcomes.
METHODS
Data Sources and Cohort
Cases of PCI with stent insertion were identified from the CathPCI Registry (66, 67), which is an initiative of the American College of Cardiology Foundation and The Society for Cardiovascular Angiography and Interventions. Details regarding dataset construction have been previously published (43, 63). Briefly, we included patients 65 years of age or older who were admitted and discharged between January 2005, and December 2008. Since the CathPCI Registry does not include direct identifiers, registry records were linked to fee-for-service Medicare inpatient claims using indirect identifiers (68, 69), which has been
subsequent to the index PCI procedure. Up to four years of follow-up data were available (i.e., from time of PCI through the end of 2008).
For this analysis, the cohort was restricted to individuals receiving elective PCI for a non-acute coronary syndrome indication, based on CathPCI Registry data. Additional exclusion criteria were applied to accurately measure subsequent stress testing and repeat revascularization and identify factors associated with stress testing. We excluded any stress testing done during a 60-day “blackout period” after each patient’s index event, since diagnostic tests during this period may be routinely performed for cardiac rehabilitation, staging of procedures, or functional capacity assessments (50). We also excluded patients who ceased to be enrolled in fee-for-service Medicare, died, underwent repeat
revascularization or angiography, or were readmitted for myocardial infarction (MI) during the blackout period.
Identification of Outcomes, Stress Test Use, and Covariates
Enrollment and mortality data were obtained from Medicare denominator files, while repeat coronary angiography and revascularization (PCI and coronary artery bypass grafting) events were identified using International Classification of Diseases, Ninth Revision, Clinical Modification (ICD-9-CM) procedure and Healthcare Common Procedure Coding System (HCPCS) codes from inpatient, carrier, and outpatient claims. Readmissions for MI were identified from ICD-9-CM primary diagnosis codes in inpatient claims.
Cardiac stress testing after PCI was identified by HCPCS codes on carrier or outpatient claims. Electrocardiogram (ECG) stress and nuclear imaging procedures
tomography testing performed on the same day were combined into a single stress imaging event (see Table 3.1 for codes).
Standard data definitions used in the CathPCI Registry were used for patient, procedural, and facility characteristics. One exception was revascularization completeness, which is not assessed in the CathPCI Registry (72). Therefore, in order to define
revascularization completeness, registry data elements denoting maximum pre-PCI occlusion were consolidated into four coronary regions: left main, left anterior descending, circumflex, and right. Each region was considered to have a significant occlusion if maximum pre-PCI occlusion was reported to be ≥70% (≥50% for left main). We defined complete PCI as occurring when: 1) for each region in which significant occlusion was reported, ≥ 1 lesion (main vessel or major branch) was treated for pre-PCI occlusion reported ≥70% (≥50% for left main) and the post-PCI occlusion was reported as <50%; and 2) for all main vessel and major branch lesions treated in the region, post-PCI occlusion was reported as <50%. Because of the complexities inherent in assessing completeness of revascularization in bypass grafts, patients with a history of coronary artery bypass grafting were excluded. Because socioeconomic status was also not recorded in the CathPCI Registry, we obtained aggregate data at the patient ZIP code level from the 2009 Pop-Facts database (Nielsen Claritas, Ithaca, New York).
Statistical Analyses
Patterns of Stress Test Use
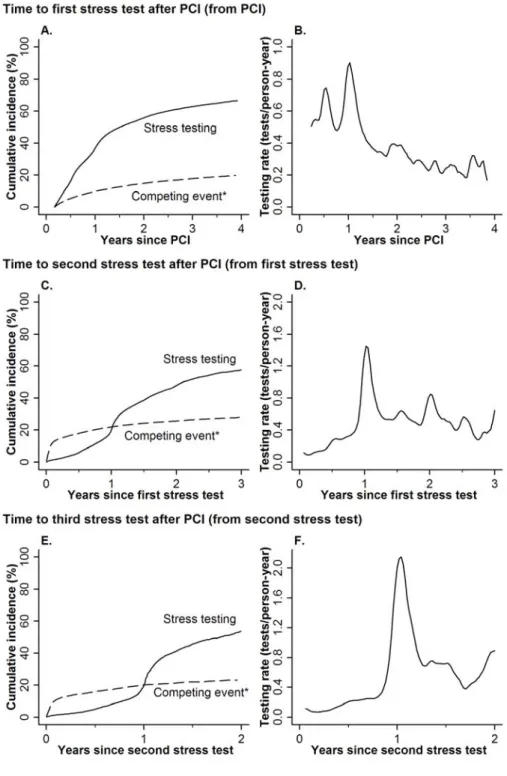
angiography as competing risks to identify the use of stress testing in patients without a major cardiac event after PCI; termination of fee-for-service Medicare coverage and end of claims availability were treated as censoring events. Testing patterns are presented both as cumulative incidence curves portraying the percentage of patients (accounting for censoring) who received a stress test up to a particular time point, as well as kernel-smoothed estimates of the hazard showing the rate at which stress testing was employed (the “intensity of testing”) at a specific time point (73). In addition to evaluating the use of first stress tests after PCI, second and third stress tests were also assessed to characterize longer term patterns of repeated testing.
Clinical Correlates of Stress Test Use
Characteristics of patients undergoing elective PCI were described using medians, 25th and 75th percentiles for continuous variables and percentages for categorical variables.
Associations between individual characteristics and stress testing (not preceded by death, MI-related readmission, or repeat revascularization or angiography) were calculated with both unadjusted and adjusted cause-specific Cox proportional hazards models (74). In addition to adjusting for patient and procedural characteristics, we also constructed a model which included fixed effects for each PCI facility (using stratification rather than indicator variables to avoid the incidental parameter problem); this approach allowed for adjustment for
in overall stress testing use and timing, we constructed extended proportional hazards models that included interaction terms between covariates and a binary indicator for time being in the seventh, thirteenth, and fourteenth months after PCI. These time points were selected based on inspection of testing rates in the data as appearing to correspond to follow-up visits at 6 and 12 months post-PCI. We hypothesized that a different effect of a characteristic on stress testing use in these months versus the remainder of the follow-up period would suggest a different effect on surveillance stress testing use than symptom-driven testing, since surveillance testing is more likely to occur periodically at regular intervals and associated with interval office visits than symptom-driven testing. Wald tests were used to assess the significance of the interaction terms.
Facility-level variation in test use in higher-risk individuals and patient outcomes
The cohort was limited to higher-risk patients who may have greater benefit from surveillance stress testing: history of silent ischemia (asymptomatic at PCI), multi-vessel coronary disease, history of MI (prior to their elective index PCI), diabetes mellitus, and receipt of incomplete revascularization. Because only limited data were available about patient’s health status after discharge from PCI, we conducted an indirect analysis leveraging variation in facility rates of stress testing, (calculated using cause-specific stress testing incidence 15 months after PCI, based on the facility in which the patient received PCI). Facilities were categorized into quartiles based on stress testing use; only facilities with ≥25 patients were included to reduce measurement error.
mortality, MI-related readmission, repeat coronary revascularization). All models considered end of fee-for-service claims availability to be a censoring event; for the MI endpoint, death was another censoring event; for repeat revascularization, both death and MI were considered to be censoring events. In addition to the facility-level quartile of stress testing, models for all three outcomes adjusted for patient, procedural, and facility characteristics specified a priori as possibly associated with differences in outcome. A marginal model was used to account for the likely correlation in error terms within-facility, with standard errors calculated using a robust sandwich variance estimator clustered at the facility level (74). We assessed the robustness of results with respect to model choice in sensitivity analyses in which we: 1) obtained standard errors via bootstrapping, sampling at the facility level, and 2) incorporated facility-level random effects to estimate a shared frailty (hierarchical or cluster-specific) model instead of a marginal (population-averaged) model (76).
This indirect approach assumed that variations in stress testing use across facilities would reflect variations in practice patterns- that high utilization rates suggest more frequent use of surveillance stress testing, and that low utilization rates would suggest stress testing reserved for recurrent symptoms. To assess the validity of this assumption, we calculated kernel-smoothed hazard rates, based on facility quartile of stress test use, to determine if facilities with a higher rate of stress test use had a more strongly periodic pattern of stress testing usage (spikes in stress testing utilization at time points suggesting surveillance testing at scheduled intervals). We also assessed whether underlying risk was correlated with
variation in facility-level rates of stress testing usage. Given the large sample size,
characteristics. To assess the net effect of observable differences in characteristics on
expected outcomes, we constructed cause-specific Cox models, which included all covariates except the facility quartile of stress testing. Using this model, we calculated predicted relative hazards for each patient, and averaged them across facility quartiles of stress testing, with standard errors provided by the delta method. Higher rates of stress testing may alternatively indicate that patients receive stress testing prior to repeat angiography procedures, with lower rates of stress testing reflecting facilities in which patients with recurrence of symptoms are referred directly to repeat angiography. Consequently, as sensitivity analysis we also
estimated a proportional hazards model including facility-level quartiles of combined repeat angiography or stress testing.
Statistical analyses were conducted using SAS version 9.2 (SAS Institute, Cary, North Carolina), Stata/SE version 12.1 (Statacorp LP, College Station, Texas), and R version 2.11.1 (R Foundation, Vienna, Austria), using an alpha level of 0.05. The Duke University Medical Center and University of North Carolina Institutional Review Boards granted a waiver of informed consent and authorization for this study; all analyses were performed at the Duke Clinical Research Institute (Durham, NC).
RESULTS
Patient Cohort
Overall, 62,964 patients treated at 875 centers underwent elective PCI between January 1, 2005, and October 31, 2008 and met criteria for the 60-day blackout period
(Figure 3.1). The median duration of follow-up was 625 days [25th–75th percentile: 323–960
Patterns of Stress Test Use
By four years after PCI, 66.4% of patients received at least one stress test, while 19.7% experienced a major coronary event prior to stress testing (a “competing event”)
(Figure 3.2A). Almost all (94.1%) of the initial post-PCI stress tests were performed with
imaging, primarily nuclear imaging (84.4%). Stress testing in the first two years after PCI was common: the cumulative incidence of stress testing was 45.5% and 58.2% by 15 and 27 months, respectively. Stress testing rates showed peaks in the 7th and 13-14th months after stress testing, suggesting frequent use of surveillance testing at these time points (Figure 3.2B). Repeated stress testing was also common; by 27 months after an initial stress test,
51.8% of patients received a second (Figure 3.2C); similarly, by 27 months after a second
stress test, 58.7% received a third (Figure 3.2E). Rates of second stress testing peaked in the
13-14th months after an initial stress test (Figure 3.2D), and third stress testing rates
demonstrated a similar pattern (Figure 3.2F). As with initial tests, the vast majority (94.1%)
of repeat stress tests were performed with imaging. When CABG recipients were included in secondary analysis, results were very similar (not shown).
Predictors of Stress Test Use
The unadjusted cumulative incidence of stress testing at 27 months post-PCI was lower for patients who were asymptomatic at time of PCI, received incomplete
fixed effects, demonstrated that after adjustment, factors positively associated with receiving a stress test at any time within 4 years of PCI (Table 3.2) included neighborhood-level rates
of college education, statin therapy use at time of PCI, family history of coronary artery disease, positive ischemia test result prior to the index PCI procedure, and a history of multiple PCI procedures as well as receiving a drug-eluting stent or multiple lesions treated during the index PCI procedure, and receiving PCI at a private rather than university hospital. Independent negative predictors included age ≥ 75 years, most comorbid conditions
(cerebrovascular disease, chronic lung disease, heart failure, and peripheral vascular disease), being a current smoker, having a history of prior MI (not at the time of the encounter or during the study period), being asymptomatic at time of PCI, incomplete coronary
revascularization, and having a major PCI-related complication. While there was a modest difference between stress testing rates between white and nonwhite patients (HR 0.96, p = 0.032) prior to inclusion of hospital fixed effects, this effect was eliminated with addition of fixed effects (HR 0.99).
Next, we introduced interaction terms between the covariate and time (7th or 13-14th months post-PCI based on the pattern of stress testing in Figure 3.1B) (Figure 3.4).
while patients with ejection fraction <50% had lower rates of stress testing overall, this association was more strongly negative in months 7 and 13-14 than the remainder of the period.
Facility-level variation in test use in higher-risk individuals and patient outcomes
The higher-risk cohort included 43,512 patients. There was significant variation in the 15-month rate of stress testing usage after PCI, based on the facility in which the patient received PCI. Relative to the lowest test use quartile, the hazard ratio for stress testing within 15 months of PCI increased to 1.59 (CI, 1.50–1.69), 2.09 (1.97–2.21), and 3.12 (2.91–3.35) in quartiles 2-4, respectively. The pattern of stress testing also differed across quartiles
(Figure 3.5).Little periodicity was observed in the first quartile, while the fourth had a
strongly periodic pattern, peaking in the 7th and 13-14th months post-PCI. This trend suggests that surveillance testing was commonly performed in the fourth quartile, while patients treated in facilities in the first quartile were unlikely to receive such surveillance testing. Statistically significant, albeit modest differences in many patient characteristics were
observed across quartiles of stress testing (Table 3.3). Based on characteristics in the dataset,
Covariate-adjusted, cause-specific Cox models, coefficients for facility quartiles 2-4 (relative to quartile 1) were not jointly significant for death (p=0.61) or MI (p=0.76), nor were any pairwise comparisons to quartile 1 (Figure 3.6). In contrast, for repeat
revascularization, terms for quartiles 2-4 were jointly significant (p=0.008), with increasing use of repeat revascularization associated with the increasing quartiles of stress testing, and greatest increase for patients receiving index PCI in fourth (highest) quartile facilities. Similar results were observed: 1. with quartiles calculated based on the combined rate of angiography and stress testing; 2. with bootstrapped standard errors; and 3. when using a shared frailty model rather than a marginal model (Table 3.5).
DISCUSSION
In this national cohort of fee-for-service Medicare beneficiaries receiving elective PCI, subsequent stress testing was commonly performed for surveillance, rather than recurrent symptoms. Patient factors that would predict a high likelihood of restenosis or recurrent symptoms were paradoxically associated with lower rates of post-PCI stress testing. Associations between facility-level stress testing rates in the 15 months following elective PCI and clinical outcomes up to 4 years post-PCI demonstrated a positive relationship between stress testing rates and repeat revascularization in higher risk patients, but no association with respect to mortality or MI-related readmission.
suggests that initial surveillance tests are commonly performed at 6 and 12 months post-PCI. Our analysis extends previous results not only by its focus on elective PCI but also by
evaluating patterns of repeated stress testing after PCI both overall, and in higher risk
individuals. We find that over half of patients receiving an initial post-PCI stress test receive additional stress tests within two years, with timing indicative of annual surveillance testing. These results are consistent with other recent work in Medicare beneficiaries, which
demonstrated a similar incidence and pattern of repeated stress testing (78).
Surprisingly, patient factors predicted to increase the risk of recurrent ischemia and presumably the value of routine testing (e.g., incomplete revascularization, diabetes mellitus, prior MI, increasing age, low ejection fraction) were associated with reduced use of stress testing after elective PCI. In addition, while often statistically significant, the magnitude of observed effects was modest – none altered the overall rate of stress testing by even 20%. This finding suggests that underlying patient risk may not be a major factor driving decisions regarding stress testing in patients who have received elective PCI.
The limited impact of patient risk factors on use of stress testing was striking when considering the wide variation in testing patterns observed in facilities where patients received PCI (a proxy measure for local practice patterns). Furthermore, some of the strongest predictors of increased stress testing were receipt of PCI in a private (versus
modest difference observed based on race, suggesting less post-PCI stress testing for white patients. However, observed race-based differences in care were eliminated with application of facility-level fixed effects, suggesting that differences in facility-level practice patterns explains the lower rate of stress test use in whites.
The observed variation in stress testing rates and periodicity even in a higher risk patient group based on the facility where the patient received PCI, suggests that higher-use facilities performed more surveillance testing, while low-use facilities reserved testing for patients with recurrent symptoms. Rather than increased stress testing rates reflecting increased patient risk, we observed greater use of stress testing in facilities where patients were, on average, at lower risk for death, MI, and repeat revascularization. Others have shown similarly broad facility-level variation in stress testing patterns and a lack of
correlation between patient risk and test use (51, 52). Facility-level variation in stress testing was associated with increased rates of coronary revascularization, but not death or MI-related readmission. These results complement those from a recent single-center study of CABG and PCI recipients referred for screening stress echocardiography (53), small randomized trials in high-risk populations (54, 55), and our previous work in an “all-comers” Medicare PCI population.
Limitations
to younger patients is unknown. Second, data after PCI discharge are limited to Medicare claims. Consequently, we cannot know whether individual stress tests were consistent with AUC or practice guidelines - forcing the indirect analytic approaches employed here. Third, the validity of the facility-level variation analysis relies on the untestable assumption that after adjustment for observed factors, unobserved factors do not confound the relationship between facility-level stress test use and outcomes. Finally, patients may benefit from surveillance stress testing through outcomes not measured in this analysis (e.g., quality of life, angina, or reassurance).
Conclusion
TABLES
Table 3.1: Healthcare Common Procedure Coding System and International Classification of
Diseases, Ninth Revision, Clinical Modification codes used to define stress testing and outcomes.
HCPCS or ICD-9-CM Code Type of Claim
Stress Testing
Electrocardiogram stress test* 93015-93018 Carrier/Outpatient Nuclear imaging 78460-78461, 78464-78465,
78472-78473, 78481, 78483
Carrier/Outpatient
Echocardiography 93350 Carrier/Outpatient
Positron Emission Tomography
78491-78492 Carrier/Outpatient Magnetic Resonance Imaging 75552-75556 (2005-2007)
75559-75560, 75563-75564 (2008)
Carrier/Outpatient Coronary Angiography 93508, 93539, 93540, 93545 Carrier, Outpatient Percutaneous Coronary
Intervention
92980-92982, 92984, 92995, 92996, G0290, G0291, 36.01, 36.02, 36.05, 36.06, 36.07, 00.66
Carrier, Outpatient,
Inpatient Coronary Artery Bypass
Grafting
33510-33514, 33516-33519, 33521-33523, 33533-33536, 36.1x, 36.2, S2205-S2209
Carrier, Outpatient,
38
Table 3.2: Selected characteristics at time of elective PCI, and associations with stress testing rate. (N=62,694)
% or median [Q1–Q3] Unadjusted Hazard Ratio (CI) Adjusted* Hazard Ratio (CI) Adjusted* Hazard Ratio, with Facility
Effects (CI) Demographics
Age (years)
Median [Q1 - Q3] 74 [69-79] - -
75 years or older 46.2 0.81 (0.79, 0.83) 0.82 (0.80, 0.84) 0.80 (0.78, 0.82)
Male gender 56.8 1.05 (1.02, 1.07) 1.01 (0.99, 1.03) 1.01 (0.98, 1.03)
White Race 87.4 0.99 (0.96, 1.03) 0.96 (0.93, 1.00) 0.99 (0.95, 1.03)
ZIP Code Characteristics Mean household income
($10,000s) 6.0 [5.1-7.8] 1.04 (1.04, 1.05) 1.02 (1.01, 1.02) 0.99 (0.98, 1.01)
% of households below poverty line (HR per 100% difference)
6.9 [3.9-10.9] 0.27 (0.22, 0.33) 0.69 (0.49, 0.99)** 0.74 (0.49, 1.12)**
% of households renting house (HR per 100% difference)
23.2 [16.4-31.4] 0.90 (0.82, 0.98)** 1.01 (0.89, 1.14)** 0.89 (0.77, 1.03)**
% of adults with less than HS diploma (HR per 100% difference)
16.8 [11.1-23.9] 0.41 (0.36, 0.46)** 1.13 (0.85, 1.49)** 1.05 (0.75, 1.46)**
% of adults with a college degree (HR per 100% difference)
25.7 [18.6-38.0] 1.98 (1.83, 2.13)** 1.49 (1.21, 1.83)** 1.54 (1.21, 1.96)**
Clinical History
Body mass index (HR per 10 units)
28.1 [25.0-32.0] 1.02 (1.00, 1.04)*** 0.99 (0.97, 1.01)*** 0.98 (0.96, 1.00)***
Comorbidities
Cerebrovascular Disease 13.7 0.84 (0.81, 0.87) 0.89 (0.86, 0.92) 0.89 (0.86, 0.93)
39
Diabetes Mellitus 31.9 0.95 (0.93, 0.98) 0.97 (0.94, 0.99) 0.97 (0.94, 1.00)
Dyslipidemia, on statin 75.7 1.10 (1.07, 1.13) 1.07 (1.04, 1.10) 1.08 (1.05, 1.11)
Heart Failure 10.7 0.72 (0.69, 0.75) 0.84 (0.81, 0.88) 0.86 (0.82, 0.90)
Hypertension 82.4 0.98 (0.95, 1.01) 1.00 (0.97, 1.03) 0.99 (0.96, 1.02)
Peripheral vascular disease 14.1 0.86 (0.83, 0.89) 0.94 (0.90, 0.97) 0.93 (0.90, 0.96)
Current smoker 10.6 0.84 (0.81, 0.88) 0.85 (0.82, 0.89) 0.83 (0.80, 0.87)
Family history of CAD < 55 years
20.8 1.08 (1.05, 1.11) 1.07 (1.04, 1.10) 1.07 (1.03, 1.10)
Pre-PCI Ischemia Testing
None 18.4 0.98 (0.93, 1.03) 0.97 (0.92, 1.02) 0.96 (0.91, 1.01)
Negative 9.9 1 (reference) 1 (reference) 1 (reference)
Equivocal 2.4 0.99 (0.91, 1.08) 0.99 (0.90, 1.08) 1.08 (1.03, 1.13)
Positive 69.2 1.19 (1.14, 1.24) 1.13 (1.08, 1.18) 1.00 (0.91, 1.10)
Previous PCI (prior to index PCI) 26.8 1.05 (1.02, 1.08) 1.30 (1.22, 1.39) 1.26 (1.18, 1.35)
Previous PCI > 1 year ago or unknown timing
23.8 1.02 (0.99, 1.05) 0.79 (0.74, 0.85) 0.79 (0.74, 0.85)
Previous MI (> 7 days) 18.6 0.89 (0.87, 0.92) 0.92 (0.89, 0.95) 0.93 (0.90, 0.96)
Left Ventricular Ejection Fraction < 50%
15.7 0.79 (0.76, 0.81) 0.88 (0.84, 0.91) 0.88 (0.84, 0.91)
Admission Symptoms
Asymptomatic 36.3 0.95 (0.92, 0.97) 0.96 (0.94, 0.98) 0.93 (0.90, 0.95)
Atypical Chest Pain or Stable Angina
63.7 1 (reference) 1 (reference) 1 (reference)
Active heart failure at time of PCI
8.1 0.75 (0.72, 0.79) 0.96 (0.91, 1.01) 0.91 (0.86, 0.97)
Glomerular filtration rate (eGFR; mL/min/1.73m2)
eGFR < 30 or on dialysis 3.2 0.81 (0.75, 0.87) 0.94 (0.88, 1.02) 0.97 (0.90, 1.04)
30 ≤ eGFR < 60 33.5 0.92 (0.90, 0.94) 0.98 (0.95, 1.00) 0.97 (0.95, 1.00)
40
PCI Procedural Characteristics
Incomplete revascularization 25.3 0.91 (0.89, 0.94) 0.96 (0.93, 0.99) 0.95 (0.92, 0.98)
Any drug-eluting stent used 78.1 1.15 (1.11, 1.18) 1.06 (1.03, 1.10) 1.08 (1.04, 1.11)
Number of lesions treated 1 [1-2] 1.02 (1.00, 1.04) 1.04 (1.02, 1.06) 1.03 (1.01, 1.06)
Multivessel Disease 40.0 0.94 (0.92, 0.96) 0.97 (0.94, 1.00) 0.92 (0.86, 0.98)
Any Procedural Complication 3.9 0.89 (0.84, 0.95) 0.92 (0.86, 0.98) 0.95 (0.92, 0.98)
Facility Characteristics Facility Type
Private, teaching 39.2 1.16 (1.11, 1.21) 1.19 (1.14, 1.25) N/A**
Private, non-teaching 48.9 1.24 (1.19, 1.30) 1.31 (1.25, 1.37) N/A**
University 10.1 1 (reference) 1 (reference) N/A**
Government 1.8 0.94 (0.85, 1.04) 0.91 (0.82, 1.01) N/A**
Annual PCI Volume (HR per 100
procedures) 853 [550-1482] 1.00 (1.00, 1.00) 1.01 (1.00, 1.01) N/A**
Bed Size (HR per 100 beds) 421 [299-576] 1.00 (0.99, 1.00) 1.00 (0.99, 1.01) N/A**
41
Table 3.3: Patient characteristics (median [Q1,Q3] or percentage), by facility quartile of stress test use at 15 months after percutaneous coronary intervention
Overall
472 Facilities (N = 43,512)
Quartile 1 (Lowest rate) 118 Facilities (N = 9,135)
Quartile 2
118 Facilities (N = 10,893)
Quartile 3
118 Facilities (N = 11,426)
Quartile 4 (Highest rate)
118 Facilities
(N = 12,058) p-value Demographics
Age (years)
Median [Q1 - Q3] 74 [69, 79] 73 [69, 79] 74 [69, 79] 74 [69, 79] 74 [69, 79] <0.001
75 years or older 46.3 44.5 46.9 46 47.6 <0.001
Female gender 41.4 42.8 43 40.8 39.6 <0.001
White Race 87.1 89.0 86.7 85.9 87.3 <0.001
ZIP Code Characteristics Mean household
income ($10,000s) 6.0 [5.1, 7.8] 5.6 [4.9, 6.6] 5.6 [4.9, 7.2] 6.6 [5.3, 8.5] 6.4 [5.3, 8.5] <0.001 % of households below
poverty line 6.8 [3.9, 10.8] 7.8 [5.1, 11.0] 7.7 [4.3, 12.1] 5.9 [3.5, 10.2] 5.9 [3.4, 9.7] <0.001 % of households renting
house 23.2 [16.4, 31.4] 22.9 [16.5, 30.7] 23.8 [16.9, 31.0] 22.8 [15.9, 31.9] 23.3 [16.3, 32.4] 0.002 % of adults with less
than a high school
education 16.7 [11.1, 23.7] 18.1 [13.1, 24.6] 18.3 [12.4, 25.5] 15.6 [10.2, 22.7] 15.4 [9.8, 21.9] <0.001 % of adults with a
college degree 25.7 [18.6, 37.9] 22.9 [17.6, 32.2] 22.9 [17.1, 34.1] 28.8 [20.1, 41.1] 28.1 [20.4, 41.9] <0.001
Clinical History
Body mass index [kg/m2] 28.3 [25.2, 32.3] 28.5 [25.4, 32.7] 28.4 [25.1, 32.4] 28.2 [25.1, 32.1] 28.2 [25.2, 32.1] <0.001 Comorbidities
Cerebrovascular Disease 14.7 14.8 15.6 15.1 13.3 <0.001
42
Heart Failure 11.8 12 13.2 12.1 10.1 <0.001
Hypertension 83.4 83.5 83.8 83.4 82.9 0.32
Peripheral vascular
disease 15.2 14.3 16.9 15 14.5 <0.001
Current smoker 10.8 11.3 11.1 10.4 10.4 0.10
Family history of CAD <
55 years 20.6 22.4 20.3 20.5 19.6 <0.001
Pre-PCI Ischemia Testing <0.001
None 17.7 19.4 20.4 16.4 15
Negative 2.3 2.3 2.7 2.5 1.5
Equivocal 9.8 11.9 11.3 9 7.6
Positive 70.3 66.4 65.6 72 75.8
Previous PCI (before
index procedure) 28.9 26.9 28.6 28.7 30.9 <0.001
Previous PCI > 1 year before index procedure,
or timing unknown 25.8 24.2 25.4 25.6 27.5 <0.001
Previous MI (> 7 days) 24.1 23.5 26.4 24.1 22.4 <0.001 Left Ventricular Ejection
Fraction
Median [Q1 - Q3] 60.0 [50.0, 63.0] 60.0 [50.0, 65.0] 60.0 [50.0, 61.0] 60.0 [50.0, 63.0] 60.0 [50.0, 60.0] <0.001
< 50% 20.4 20.2 21.8 20.1 19.7 0.004
Asymptomatic at PCI 46.6 40.3 45.7 47.7 51.1 <0.001
Active heart failure at
time of PCI 8.5 9.2 8.7 8.3 7.8 0.001
Glomerular filtration rate
(mL/min/1.73m2) 0.003
eGFR < 30 or receiving
dialysis 3.6 4.1 3.7 3.6 3.2
30 ≤ eGFR < 60 34.1 35.1 34.1 33.7 33.5
43
Characteristics Incomplete
revascularization 32.6 33.2 31.2 33.2 32.8 0.004
Any drug-eluting stent
used 78.4 79.9 76.9 79.5 77.6 <0.001
Multivessel Disease 51.7 54.2 49.3 52.2 51.6 <0.001
Any Procedural
Complication 4.1 3.8 3.9 4.6 3.9 0.006
Facility Characteristics Facility Type
Private, teaching 40.0 42.6 43.5 37.1 37.6 <0.001
Private, non-teaching 48.0 36.9 45.8 47.2 59.2 <0.001
University 10.2 14.4 10.8 14.6 2.4 <0.001
Government 1.8 6.0 0.0 1.1 0.8 <0.001
44
Table 3.4: Comparison of expected event rates, across quartiles of stress test utilization
Hazard Ratio (CI) P
Death <0.001
Quartile 1 (Lowest) 1.00 (Reference)
Quartile 2 1.04 (1.01, 1.06)
Quartile 3 0.94 (0.92, 0.97)
Quartile 4 (Highest) 0.92 (0.89, 0.95)
MI-related Readmission <0.001
Quartile 1 (Lowest) 1.00 (Reference)
Quartile 2 1.02 (0.99, 1.06)
Quartile 3 0.94 (0.89, 0.98)
Quartile 4 (Highest) 0.90 (0.85, 0.95)
Repeat Revascularization <0.001
Quartile 1 (Lowest) 1.00 (Reference)
Quartile 2 0.98 (0.96, 1.00)
Quartile 3 0.98 (0.95, 1.01)
45
Table 3.5: Alternative Model Specifications
Hazard Ratio (95% Confidence Interval) Quartiles of either stress
testing or catheterization
Bootstrapped Standard Errors
Shared Frailty model
Death
Quartile 1 (Lowest) 1.00(Reference) 1.00 (Reference) 1.00 (Reference)
Quartile 2 1.06 (0.96, 1.17) 1.04 (0.94, 1.17) 1.04 (0.94, 1.15)
Quartile 3 0.99 (0.90, 1.10) 0.98 (0.89, 1.09) 0.98 (0.88, 1.08)
Quartile 4 (Highest) 1.02 (0.92, 1.13) 1.02 (0.92, 1.14) 1.02 (0.92, 1.13)
MI-related Readmission
Quartile 1 (Lowest) 1.00 (Reference) 1.00 (Reference) 1.00 (Reference)
Quartile 2 0.89 (0.74, 1.06) 0.92 (0.76, 1.10) 0.92 (0.77, 1.09)
Quartile 3 1.05 (0.88, 1.25) 0.97 (0.79, 1.16) 0.97 (0.81, 1.15)
Quartile 4 (Highest) 0.91 (0.76, 1.10) 0.93 (0.76, 1.12) 0.93 (0.77, 1.11)
Repeat Revascularization
Quartile 1 (Lowest) 1.00 (Reference) 1.00 (Reference) 1.00 (Reference)
Quartile 2 1.12 (1.02, 1.23) 1.13 (0.98, 1.29) 1.11 (0.99, 1.26)
Quartile 3 1.16 (1.06, 1.27) 1.11 (0.99, 1.25) 1.12 (1.00, 1.27)
FIGURES
Figure 3.1. Study cohort flow.
Figure 3.2. Patterns of stress testing after PCI
Figure 3.3. Stress testing use, stratified by patient characteristics
Figure 3.4. Adjusted predictors of stress testing.
Figure 3.5. Stress testing patterns in higher-risk patients, by facility-level quartile of test use
Kernel-smoothed estimates of rate of first stress testing after percutaneous coronary
Figure 3.6. Associations between facility-level quartile of stress test use among higher-risk patients and clinical outcomes.
4. STUDY 2: STRESS TESTING IMAGING MODALITIES
OVERVIEW
Exercise stress testing is commonly performed following percutaneous coronary intervention (PCI) in patients with acute coronary syndromes (ACS); however, little is known about the impact of modality on patient outcomes or resource use. Our objective was to determine the impact of exercise nuclear versus exercise echocardiography testing after PCI on outcomes and resource use. This was done by doing a longitudinal observation study in the setting of medicare claims used to identify outpatient exercise stress testing with imaging within 15 months after PCI for ACS. Patients included those aged 65 and older, enrolled in fee-for-service Medicare and treated with PCI after hospitalization for ACS. Outcomes and resource use up to 4 years post-testing were compared using inverse probability weighting. We report adjusted hazard ratios (HRs) and 95% confidence intervals (CI). Among 29,279 eligible patients, 15.5% received exercise echocardiography. Echocardiography recipients had higher rates of repeat stress testing (adjusted HR: 2.60, CI: 2.19-3.10) than nuclear imaging
recipients in the first 90 days after testing, but lower rates of revascularization (adjusted HR: 0.87, CI: 0.76-0.98) and catheterization (adjusted HR: 0.88, CI: 0.80-0.97). None of these differences persisted for outcomes subsequent to the first 90 days after stress testing. Rates of death and readmission for myocardial infarction rates did not differ. Total Medicare
payments, including test cost, were lower initially after echocardiography, but not
clinical data at the time stress testing was ordered, precluding examination of test or procedural appropriateness. In this longitudinal observational study, echocardiography recipients had fewer invasive procedures, but higher rates of repeat testing, than nuclear testing recipients. Thus, imaging cost evaluations depend on analysis duration and scope of costs considered. The comparative evaluation of imaging modalities should reflect their impact on overall process and cost efficiency.
BACKGROUND
Exercise stress testing is commonly performed following percutaneous coronary intervention (PCI) (50), most frequently using nuclear or echocardiography imaging (63). Studies have examined optimal testing approaches for patients without diagnosed coronary artery disease presenting with stable angina; however, little is known about optimal stress testing strategies in patients who have already received coronary revascularization (80, 81). Understanding the value of alternative testing modalities is critical given the costs of cardiac imaging-related services in the United States (35).
To date, most evaluations of imaging efficacy have focused on test performance parameters such as sensitivity and specificity; only recently has a research agenda been expanded to focus upon the comparative value of cardiac imaging strategies (29).
Unfortunately, many imaging cost evaluations have only considered the costs associated with testing, rather than the impact of testing on resource use during or after the current episode of care. Health reform will provide incentives to move from fee-for-service reimbursement to episodic payment approaches, such as bundling, global payments, or accountable care


![Table 3.3: Patient characteristics (median [Q1,Q3] or percentage), by facility quartile of stress test use at 15 months after percutaneous coronary intervention](https://thumb-us.123doks.com/thumbv2/123dok_us/8314146.2202456/56.1188.97.1091.196.818/patient-characteristics-percentage-facility-quartile-percutaneous-coronary-intervention.webp)