http://www.scirp.org/journal/tel ISSN Online: 2162-2086
ISSN Print: 2162-2078
Impact of Capital Structure on Firm Value:
Evidence from Indian Hospitality Industry
Divya Aggarwal
1, Purna Chandra Padhan
21Fellow Program in Management (Finance), XLRI, Xavier School of Management, Jharkhand, India 2XLRI, Xavier School of Management, Jharkhand, India
Abstract
This study examines the effect of capital structure and firm quality on firm value of selected BSE listed Indian hospitality firms over a time frame of 2001-15. Variables including firm quality measured through Altman Z score, leverage, size, profitability, tangibility, growth, liquidity along with macro va-riables of growth in gross domestic product and inflation are taken into con-sideration for examining their impact on firm value. An empirical study has been carried out through panel data techniques by applying pooled OLS, fixed effects and random effects models. The findings of the study reveal a signifi-cant relationship of firm value with firm quality, leverage, liquidity, size and economic growth. The study shows that Modigliani miller theorem of capital structure irrelevance does not hold for Indian hospitality sector. It is of prac-tical significance for hotel owners to reassess their capital structure to improve firm quality and firm’s market performance.
Keywords
Altman Z Score, Firm Value, Leverage, Trade off Theory
1. Introduction
There have been numerous empirical researches on various factors determining the relation between capital structure and firm value. The debate on the impact of capital structure variables on firm value is ongoing in the field of corporate finance. It still hasn’t come to a conclusive result and remains a controversial is-sue. Few capital structure theories such as the theories of trade off, pecking order and market timing have been extensively studied and tested empirically in the literature, but have given mixed results. Therefore, there is no unanimous view on the relevance of capital structure theories in general and especially on hospi-tality industries in particular. In lieu of this, the study aims to understand the
How to cite this paper: Aggarwal, D. and Padhan, P.C. (2017) Impact of Capital Struc-ture on Firm Value: Evidence from Indian Hospitality Industry. Theoretical Econom-ics Letters, 7, 982-1000.
https://doi.org/10.4236/tel.2017.74067
Received: May 19, 2017 Accepted: June 19, 2017 Published: June 22, 2017
Copyright © 2017 by authors and Scientific Research Publishing Inc. This work is licensed under the Creative Commons Attribution International License (CC BY 4.0).
role of firm quality and capital structure in determining the firm value in the hospitality sector in a developing country context. It analyzes selected hotel and tourism companies listed on Bombay stock exchange (BSE) in India to establish relationship between firm value and firm quality.
Our motivation to study the hospitality sector is due to many reasons. Firstly, due to unique characteristics of the hospitality sector, it constantly needs to in-novate based on need of the hour. It focuses on creating a home away from home for travelers. Hence, it is always a great challenge for hotels to retain cus-tomers. Moreover, this industry is highly sensitive to macroeconomic cycles. Secondly, the slowdown in global economy has hit the Indian hotel industry which has been facing a slump for over five years now. As per the recent report in 2014 by the Federation of Hotels and Restaurant association of India (FHRAI), the occupancy rates in the hotel space have been stagnant since the past two years. A recent study by Varuni & Sathyanarayanan [1] mentioned how the global slowdown impacted both business and leisure travel which have led to a slump in this industry. Thirdly, the hospitality sector is constrained with funding issues with not so friendly lending policies by Indian banks. A report by HVS Global hospitality services from Thadani & Mobar [2], analyzed the critical challenges faced by Indian hotel industry in 2013 highlighting a plethora of is-sues impacting this sector adversely. Fourthly, most of the empirical work on understanding determinants of capital structure in Indian context is limited to the manufacturing sector. The studies in developing countries are less in com-parison to developed companies and more sparse in services sector.
The importance of the hospitality sector cannot be underestimated in India. With the first hotel established in India in 1903 (branded as the Taj Hotels by the founder of Indian conglomerate Tata group), the Indian hotel industry now is expected to generate almost 13.45 million jobs, accounting for almost 9% of total employment opportunities. The sector is among the top 10 sectors in India attracting foreign direct investments (FDI) as per the department of industrial policy and promotion (DIPP). Approximately USD 9.23 billion as FDI has been invested in this sector within the year 2000-2016 as mentioned in the report by IBEF [3].
with firm value.
This study contributes to the literature by examining capital structure and firm quality determinants to provide empirical support to capital structure theo-ries in a specific industry, the hospitality sector in Indian context. Moreover, this is among the first study which analyzes relation between firm value and capital structure over a large time frame of 15 years for Indian hotel companies. This study will also help various stakeholders such as; hotel owners, government and investors to understand the relation between capital structure determinants, firm quality and firm value for hotel companies. Analyzing the impact of firm quality on firm value will enable management to reexamine their financial performance along with assisting in identifying which factors impact their firm value. It will also enable hotel owners to improve their capital structure decisions. For inves-tors it will help them in better identification of firms for investments. For regu-lators it will enable them to identify areas to come up with friendly policies for hotel industry.
The rest of the study proceeds as follows: Section II discusses the literature re-view and prior work in empirical tests on firm value and capital structure theo-ries leading to model specification. Section III presents the methodology fol-lowed. Section IV explains the results and Section V offers concluding remarks of the study.
2. Literature Review
Modigliani and Miller [4] stated that market value of a firm does not depends upon its capital structure and if firms do not provide the required returns, then individuals can get their desired returns by creating synthetic portfolios. Many scholars have found the theory of capital structure irrelevance by Modigliani and Miller [4] to be objectionable and have constantly challenged it. Walter [5] ar-gued that the famous separation analogy of splitting milk into cream and skim milk for debt and equity bearing the same cost as whole milk cannot be consi-dered in a similar fashion when looking at splitting of operating income. It was shown that an optimal capital structure exists with a certain debt level where the marginal cost of raising additional debt should be greater than or equal to the average cost of capital as pointed out by Solomon [6]. Firm failures had always invited scholarly attention moving from firm quality assessment based on qua-litative factors to financial ratio analysis. Till 1970s, two kinds of statistical mod-els were used to predict bankruptcy. These were the univariate model developed by Beaver [7] and the multivariate discriminant analysis, called the Z score which became the best known predictor of bankruptcy and is most widely used till date with continuous score revision, developed by Altman [8].
Many scholars challenged the theory of capital structure irrelevance by adding imperfections of bankruptcy costs. Warner [9] empirically proved that firms with very volatile earnings had less debt and more diversified firms had more debt due to different bankruptcy costs. Hence a firm should not borrow “as much as possible” and act rationally by matching asset maturities and debt. For a firm there are assets in place representing present value of earnings (which should be financed by debt) and assets for growth representing present value of growth opportunities (which should be financed more by equity). Myers [10]
showed that large levels of debt can also lead to under investment., DeAngelo & Masulis [11] challenged the capital structure irrelevance theory by taking corpo-rate tax shields as substitute of debt tax shields and showing that each firm has a unique optimal capital structure dependent on its industry.
A review on theory of capital structure by Raviv [12] showed that apart from TOT, capital structure theories diverged into two other dimensions of agency theory and asymmetric information arising due to conflict of interest in asset ownership. Tracing the developments in finance theory, Weston [13] mentioned that scholars have identified three root causes of agency problems which were due to shareholders gaining on expense of debtholders, managers or agents tak-ing an undue advantage of firm perks with a fractional ownership and informa-tion asymmetry. The agency theory states that there does exist an optimal capital structure for a firm by a tradeoff between the agency cost of debt and the benefit from debt. Jensen & Meckling [14] used this explanation to justify why loan agreements have covenants to protect lenders from the risk of asset substitution by shareholders. The information asymmetry led to the development of pecking order theory by Myers [15] which resides on firm managers using private infor-mation to time issue of securities and having a preference first for internal funds, then debt and lastly equity. Hence use of debt, equity or retained earnings also gives a signal on firm operations and impact firm value.
Various studies have tried to find empirical evidence for these theories by us-ing firm specific variables to determine their impact on firm value and capital structure. The literature has evolved in two areas. One analyzes the determinants of capital structure i.e. the factors affecting firm leverage. The other analyzes the impact of firm capital structure on firm market value. Moreover, studies have been done on both listed and non-listed firms. This study caters to the impact of firm capital structure and quality on firm market value by studying listed firms. Major studies have related firm value with capital structure variables like debt, equity, size, profitability, risk, tangibility and macro factors like inflation, growth etc. Some of the pioneering work in this area has been of Rajan and Zingales
[16]; Booth [17]. A detailed explanation of the variables examined in this study is given in section III.
In Indian context the empirical evidence of capital structure determinants has been done in a limited way and mostly restricted to manufacturing sector. Major works include those of Sarma and Rao [18], Dhankar and Boora [19], Bhaduri
[22] have given mixed results. Moreover, majority of these studies have at-tempted to establish the relation between firm capital structure and firm specific determinants. Impact of them on firm value is not explored much in Indian context. This study contributes to the existing literature by analyzing the impact of capital structure and firm specific variables on firm value of Indian hotel in-dustry.
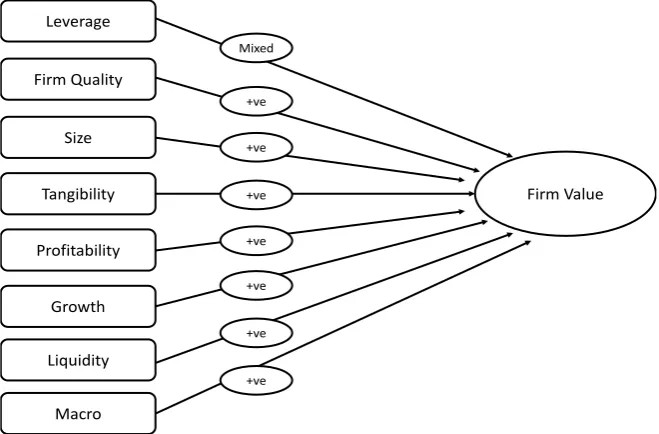
A conceptual framework of the linkages of firm attributes, firm quality and capital structure on firm value is given in Figure 1. The framework indicates the sign of relationship based on the trade of theory. It has been used to develop hypothesis for examining the relationships between the variables.
The next section discusses the variables used in depth along with the devel-opment of model equation for analysis.
3. Data and Variable Description
3.1. Data
The panel data is used on 22 Indian hotel companies which are listed on the BSE. The time period of analysis ranges from a period of 2001-15. The data is sourced from CMIE database. The database contains 37 listed companies under the hotels and restaurant industry group. A total of 22 firms were selected for the analysis. The basis of selection of firms was done subject to data availability and listing prior to 2000. A brief description of the 22 firms is given in the appendix of the study. The selection of firms is shown in Table 1.
3.2. Variable Descriptions
[image:5.595.209.539.498.715.2]A variety of capital structure determinants have been used in different studies depending upon the research objective and industry being analyzed. Empirical studies have shown the impact of firm specific factors on determination of capi-
Figure 1. Linkages of firm attributes, firm quality and capital structure on firm value.
Firm Value Leverage
Firm Quality
Size
Tangibility
Profitability
Growth
Liquidity
Macro
Mixed
+ve
+ve
+ve
+ve
+ve
+ve
Table 1. Number of companies selected.
Industry group Total Taken
Hotels & restaurant 37 22
Of which:
Hotels & restaurant services 31 20
Tourism 2 2
Travel agencies 3 0
Restaurants 1 0
tal structure which then impacts the firm value. Since this study examines the effect of capital structure on firm value, the dependent variables include proxies of firm value as done in numerous studies. They directly test the Modigliani and Miller hypothesis on influence of capital structure on firm value as done in the studies, such as those by Sarma and Rao [18]; Cheng, Liu, & Chien [23]. Three proxies of firm value are used.
3.2.1. Dependent Variables Include
Dependent variables include in both absolute (EV, MCap) and relative terms (PB).
1) Enterprise value (EV)—this is the most comprehensive proxy for firm value as it includes both equity and debt. It has been used in studies by Dhankar and Boora [19]; Chadha & Sharma [22].
2) Market capitalization (MCap)—this metric is devoid of debt and reflects how much the equity of the firm is priced in the market in absolute terms. It has been used in studies by, Dhankar and Boora [19]; Chadha & Sharma [22].
3) Price to Book (P/B)—used as a proxy for relative firm value for companies having negative earnings. It shows the ratio of market price of equity and its book value. A higher than 1 ratio means that market has priced its equity more than its book value. It has been used in various studies including Ozkan [24], Antoniou [25], and Bevan [26].
A comprehensive summary of the empirical work is done by Harris and Ravi
[12] and Rajan and Zingales [16] which highlight common variables being shared in multiple studies as determinants of capital structure. This study ana-lyzes the below variables as explanatory variables.
3.2.2. Independent Variables Include
Rovolis [27]; Antoniou [25]; Bhaduri [20]; Charalambakis & Psychoyios [28]; Shah & Jam-e-Kausar [29] etc. and have shown a mixed relation between leve-rage and firm value. We believe the relation between them to be significant.
Hypothesis 1—firm value and leverage have a significant relation.
2) Firm quality—leverage is also related to financial distress costs as per agency theory. We have also included the risk of bankruptcy on firm value cal-culated through Z score as developed by Altman [8]. The higher the score more is the firm quality and lower is the probability of firm being bankrupt. Rajan and Zingales [16] mentions probability of bankruptcy as a significant determinant of capital structure among various studies. We expect a significant relation of Z score with firm value.
Hypothesis 2—firm value and firm quality are positively related.
3) Size—considerable evidence have been found on a significant relation be-tween size and firm leverage. We have used natural logarithm of total assets (Ln_TA) as a proxy for firm size, in this study, based on Naceur & Goaied [30]. Large firms due to diversification benefits and cushion against adverse cash flow fluctuations tend to be more leveraged. While Titman and Wessels [31]; showed a negative relation between firm value and short term debt, Rajan and Zingales
[16] showed a positive relation between leverage and size due to reduced infor-mation asymmetry. It supports the agency theory. Most of the studies have shown a positive relationship of size and leverage such as those of Ang [32]; Warner [9]; Booth [17]. We expect a positive relation between size and firm val-ue as studies have referred to size as an inverse proxy of bankruptcy probability and size also reduces financial distress cost.
Hypothesis 3—firm value and size have a significant positive relation.
4) Tangibility—being a capital intensive sector, the hospitality sector has a high proportion of fixed assets in the form of land and building. Agency cost theories and information asymmetry theories stress that the capital structure de-cisions are impacted by asset structure. High compositions of fixed assets offer more collateral value, hence providing a safety cushion backup. This study uses fixed assets to total assets (FA_TA) as a proxy for tangibility. It has been used in many other studies such as those by Rajan and Zingales [16], Bevan [26], Booth
[17], Voulgaris [33], Shah & Jam-e-Kausar [29]. The tradeoff theory expects a positive relation between firm leverage and asset tangibility. With more tangible assets the firm has more collateral to offer and hence, can invest in more projects due to fund availability. We expect a significant positive relation between firm value and tangibility due to the nature of the hotel industry.
Hypothesis 4—firm value and tangibility have a significant positive relation. 5) Profitability—pecking order theory expects a negative relation between firm profitability and debt issue as shown in studies by Myres [34], Antoniou
posi-tive relation between firm leverage and profitability since it lowers the cost of fi-nancial distress. We expect a positive relation between profitability and firm value. We have used return on assets (ROA) as a measure of firm profitability. It has been used in various studies including Shah & Jam-e-Kausar [29], Rajan and Zingales [16], Al-Fayoumi [36].
Hypothesis 5—firm value and profitability have a significant positive relation. 6) Growth—as per pecking theory and trade off theory there exists a positive and negative relation between firm leverage and growth as shown by Myres [10], Jensen [37], Harris and Arthur [38]. Pecking order theory predicts a preference for debt over equity in lieu of growth opportunities. Trade off theory predicts more agency conflicts from growth opportunities. We expect a significant rela-tion between firm value and growth since growth opportunities impact capital structure of the firm. As consistent with many studies we have used growth in total assets as a proxy for growth (GRWTA), as mentioned in the study by Tit-man and Wessels [31]. It is more determined due to the nature of the hotel in-dustry where increase in total assets signifies how the hotel chain has expanded. Dependent upon the nature of industry, firms with more tangible assets tend to borrow more than firms with less tangible assets. In Indian context, whether capital markets have recognized the growth of hotel firms without an adverse ef-fect on its firm quality, still needs to be explored. However, we expect a signifi-cant relation between firm growth and firm value.
Hypothesis 6—firm value and growth have a significant relation.
7) Liquidity—with higher liquidity, firms can finance investments with ease
and meet short term financial commitments. Studies like Antoniou [25] have found a significant relation between liquidity and leverage. Dependent upon the industry characteristics, various empirical studies have given mixed results on the impact of liquidity on firm value. We expect a significant relation between liquidity and firm value. We have used current ratio (CR) as a proxy for liquidity in the study.
Hypothesis 7—firm value and liquidity have a significant positive relation. 8) Macro factors—we have also included additional variables of inflation and GDP growth to examine the effect of macro factors on firm value. High inflation tends to make firms borrow instead of raising equity and high GDP growth makes firms to raise more equity. The GDP (GDPGR) is taken at current market prices with the base year 2004-05. Since the period of study is 15 years, we expect the macro variables to have a significant relation between them. These proxies have been used by Booth [17].
Hypothesis 8a—firm value and GDP growth are positively related. Hypothesis 8b—firm value and inflation are positively related.
4. Econometric Methodology
1 2 , 3 , 4 .
5 . 6 . 7 . 8 .
9 . 10 . ,
it i t i t i t
i t i t i t i t
i t i t i t
EV LEVERAGE FIRM QUALITY LNSIZE
TANG PROF GROWTH LIQUIDITY
GDPGROWTH INFLATION
β β β β
β β β β
β β ε
= + + +
+ + + +
+ + +
(1)
1 2 , 3 , 4 .
5 . 6 . 7 . 8 .
9 . 10 . ,
it i t i t i t
i t i t i t i t
i t i t i t
MCap LEVERAGE FIRM QUALITY LNSIZE
TANG PROF GROWTH LIQUIDITY
GDPGROWTH INFLATION
β β β β
β β β β
β β ε
= + + +
+ + + +
+ + +
(2)
1 2 , 3 , 4 .
5 . 6 . 7 . 8 .
9 . 10 . ,
it i t i t i t
i t i t i t i t
i t i t i t
PB LEVERAGE FIRM QUALITY LNSIZE
TANG PROF GROWTH LIQUIDITY
GDPGROWTH INFLATION
β β β β
β β β β
β β ε
= + + +
+ + + +
+ + +
(3)
Notes: β1 is intercept term εi t, is the residual term, i=1, 2,, 22 number
of companies and t=1,,15 year. The definition of variables, their nature and
the expected sign are given in Table 2.
We have used panel data as it enables to take into account the heterogeneity of firm specific characteristics. Combining both time series of all cross section ob-servations, it is more efficient, informative and gives more degrees of freedom along with reducing collinearity among variables. The methodology is also re-ferred from Gujarati [39]. Three types of panel data regression models on the three dependent variables are used. Those are pooled OLS, fixed and random ef-fect model. The pooled ordinary least square (OLS) assumes intercept and slope coefficients to remain constant over time and across firms and assesses the im-pact of all exogenous variables on the endogenous variable. However, when time and individual specific effects are present in pooled OLS, it gives biased result as mentioned by Bevan [26]. To incorporate the effect of firm specific characteris-tics, fixed and random effect model are used. While the fixed effect model as-sumes that the firm specific effect is correlated with the independent variable, the random effect model assumes individual specific effects are uncorrelated with independent variables. The fixed effect model evaluates differences in in-tercepts, which may be due to unique features of each firm, such as differences in management style or managerial talent. By replacing β1i in place of β1 in
each of these equations will give rise to fixed effect model, where intercept across firms are different but not over time with their slopes remaining constant. Pooled OLS is considered as a restricted model due to the constraints imposed for a common intercept on all firms. To estimate whether fixed effects model is better than pooled OLS, a formal test of restricted F test is used. We further use a random effect panel regression model. In fixed effects panel data, the intercept for each firm is unique whereas in random effects panel data, the intercept represents a mean value of all firms with an error component accounting for deviations of individual firms from the mean value. By placing β1i =β1+ui in
place of intercept term β1 in each equation from 1 to 3 will be defined as
ran-dom effect model, where ui is error term. To determine whether fixed effect
Table 2. Summary of determinants of capital structure and their predicted signs.
Dependent
variables Measurement
Predicted relationship
& sign Enterprise
value (EV) Enterprise value of the firm on Bombay stock exchange (BSE) Market
capital (Mcap) Market capitalization of the firm on Bombay stock exchange (BSE) Price to
book ratio (PB) Price to book ratio of the firms on Bombay stock exchange (BSE)
Independent variables
Leverage (TOL_TNW)
Measures total outside liabilities of a company against the value of the company net of outside
liabilities i.e. tangible net worth. Total outside liabilities include all borrowings and current liabilities
Significant & −ve
Firm Quality (Z score)
Calculated using Altman z score by below formula: Z score = 1.2* (Working capital by total assets) + 1.4*
(Retained earnings by total assets) + 3.3* (Earnings before interest and taxes over total assets) +
0.6* (Market capitalization over total liabilities) + 1* (Total income by total assets)
Significant & +ve
Size (LnTA) refers to the sum of all current and non-current assets Logarithm of total assets of the firm which Significant & +ve
Tangibility (FA_TA)
Ratio of net fixed assets over total assets. Net fixed assets defined as sum of net intangible assets,
land & building, plant & machinery etc. after adjusting for arrears of depreciation and impairments
Significant & +ve
Profitability (ROA)
Returns generated by an enterprise on the total funds deployed in business. Calculated as a ratio of profit after
tax net of prior period and extra ordinary transactions over average of beginning and year-end total assets
Significant & +ve
Growth
(GrwTA) Year on year change in average total assets Significant & +ve
Liquidity (CR) Measures the ability to pay short term obligations; Short term liabilities include those payable
within a year over short term assets Significant & +ve GDP growth Year on year growth of GDP at current prices Significant & +ve Inflation Annual inflation rate of wholesale price index Significant & +ve
5. Empirical Results Analysis
5.1. Descriptive Statistics
Table 3. Descriptive statistics.
MCAP EV PB TOL_TNW Z LNTA FA_TA ROA GRWTA CR GDPGR INFL
Mean 6010.29 8556.81 2.23 1.93 1.50 7.32 0.50 5.04 12.51 1.72 11.59 7.11
Median 942.00 1307.70 1.45 0.90 1.30 7.25 0.50 4.30 8.50 0.80 12.20 6.30
Max. 94,353.2 117,223.7 20.7 152.10 5.40 11.20 0.90 28.70 160.60 75.00 16.80 15.00
Min. 5.10 −6.20 0.00 −32.50 −0.6 3.70 0.00 −32.2 −31.70 0.10 7.20 3.20
Std. Dev. 14,239.91 17,854.31 2.60 8.85 1.11 1.84 0.25 6.90 19.58 4.85 2.52 3.11
CoV 2.37 2.09 1.16 4.60 0.74 0.25 0.51 1.37 1.57 2.83 0.22 0.44
Skewness 3.72 3.18 3.25 14.76 0.87 0.12 −0.24 −0.03 3.50 11.46 −0.10 0.99
Kurtosis 17.69 13.68 18.1 254.09 3.59 2.15 2.09 6.01 23.63 163.05 2.64 3.41
Jarque-Bera 3733.86 2125.84 3685 87,8861.4 46.1 10.67 14.62 124.61 6506.85 35,9445.9 2.33 55.85
P value 0.00 0.00 0.00 0.00 0.00 0.00 0.00 0.00 0.00 0.00 0.31 0.00
Observations 330 330 328 330 330 330 330 330 329 330 330 330
Note: Here and henceforth following the abbreviations used in the text frequently stands for MCAP = market capitalization, EV = Enterprise value, PB = Price to book, TOL_TNW = ratio of total outside liabilities to total net worth, Z = Altman Z score, LNTA = log of total assets, FA_TA = Fixed assets by total assets, ROA = return on total assets, GRWTA = growth in total assets, CR = current ratio, GDPGR = growth in GDP and INFL = inflation, VIF = Variance Inflation Factor).
normality leads to rejection of null hypothesis of a normal distribution for all se-ries except growth in GDP, suggesting non-normal distribution, as expected in panel data. The growth in total assets on an average is 12.5% which reflects that the firms have grown at a high rate, indicating a growing industry. The tangible assets measured as a ratio of fixed assets to total assets is almost 50% which is high considering the nature of the industry. The profitability ratio is low, almost 5% of total assets along with low current liquidity of 1.7 on average. However, a key concern is the low Z score which is 1.4 on an average. A Z score below 1.8 indicates low firm quality. The ratio of total outside liabilities by total net worth is also high at an average of 1.9. It measures the firm’s total outside liabilities over its tangible net worth, a higher ratio demonstrates excessive reliance on ex-ternal funds, limiting the future borrowing ability. Though the industry has been growing but it is subjected to low firm quality and low returns. The inflation rate and growth in GDP are 7% and 11.5% on average over the period of 2001-15 in-dicating a rising trend.
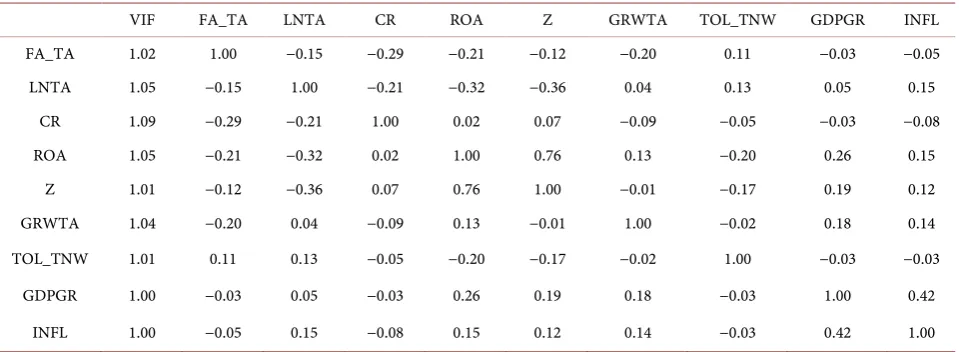
5.2. Correlation Matrix
Table 4. Correlation coefficients.
VIF FA_TA LNTA CR ROA Z GRWTA TOL_TNW GDPGR INFL
FA_TA 1.02 1.00 −0.15 −0.29 −0.21 −0.12 −0.20 0.11 −0.03 −0.05
LNTA 1.05 −0.15 1.00 −0.21 −0.32 −0.36 0.04 0.13 0.05 0.15
CR 1.09 −0.29 −0.21 1.00 0.02 0.07 −0.09 −0.05 −0.03 −0.08
ROA 1.05 −0.21 −0.32 0.02 1.00 0.76 0.13 −0.20 0.26 0.15
Z 1.01 −0.12 −0.36 0.07 0.76 1.00 −0.01 −0.17 0.19 0.12
GRWTA 1.04 −0.20 0.04 −0.09 0.13 −0.01 1.00 −0.02 0.18 0.14
TOL_TNW 1.01 0.11 0.13 −0.05 −0.20 −0.17 −0.02 1.00 −0.03 −0.03
GDPGR 1.00 −0.03 0.05 −0.03 0.26 0.19 0.18 −0.03 1.00 0.42
INFL 1.00 −0.05 0.15 −0.08 0.15 0.12 0.14 −0.03 0.42 1.00
Note: Here and henceforth following the abbreviations used in the text frequently stands for MCAP = market capitalization, EV = Enterprise value, PB = Price to book, TOL_TNW = ratio of total outside liabilities to total net worth, Z = Altman Z score, LNTA = log of total assets, FA_TA = Fixed assets by total assets, ROA = return on total assets, GRWTA = growth in total assets, CR = current ratio, GDPGR = growth in GDP and INFL = inflation, VIF=Variance Inflation Factor.
5.3. Panel Regression Model
The results of pooled OLS, fixed effects and random effects model for each of the three equations are given in Tables 5-7 respectively. Since each firm has the same number of observations, the study has performed balanced panel using Eviews 9.5 software.
As pooled OLS assumes no significant time and individual effects, the inter-cept and slope coefficients of the 22 hotel firms are assumed to be constant over the entire period of 15 years. However, the fixed effect regression assumes con-stant slope coefficients with varying intercepts for all firms. The key challenge is to determine whether to use pooled OLS model or fixed effect model or random effect model. For determining which model is better between fixed effect and pooled OLS, the F statistic calculated for all the three equations is given in
Tables 5-7. Since the F statistic value is highly statistically significant, the re-stricted model of pooled OLS is invalid. Therefore, the unrere-stricted fixed effect model is better than the restricted pooled OLS.
Again, a critical factor in determining which model to use between fixed and random effect is the correlation between the individual firm error components and the explanatory variables. If they are correlated then fixed effect model is used whereas if they are uncorrelated, random effect model is used. We use the formal test developed by Hausman [40] which is used in various studies to select between fixed and random effect model. The null hypothesis is random effect model is consistent and efficient and alternative of random effect inconsistent. In otherworld’s, the null hypothesis assumes that individual firm error compo-nents and explanatory variables are not correlated. Rejection of null hypothesis implies selection of fixed effect model over random effect model and vice versa. The test follows χ2 distribution.
Table 5. Panel data Equation (1) with dependent variable-EV.
Independent variable
Pooled OLS Fixed effect Random effect
Coefficient t-statistic P value Coefficient t-statistic P value Coefficient t-statistic P value Constant −53277.59 −47.31 0.00* −38646.72 −26.07 0.00* −38805.38 −13.64 0.00*
Leverage (TOL_TNW) 124.56 7.21 0.00* 106.84 8.90 0.00* 106.75 8.90 0.00*
Firm quality (Z score) 4321.41 20.46 0.00* 2267.24 12.48 0.00* 2266.91 12.50 0.00*
Size (Ln TA) 7288.81 75.79 0.00* 5480.17 28.15 0.00* 5506.70 28.54 0.00*
Tangibility (FA_TA) 2965.68 4.32 0.00* 1258.79 1.54 0.12 1255.61 1.54 0.12
Profitability (ROA) −298.58 −8.45 0.00* −219.19 −7.67 0.00* −218.48 −7.65 0.00*
Growth (GRWTA) −10.25 −1.26 0.20 −11.42 −1.96 0.05** −11.50 −1.97 0.04**
Liquidity (CR) 174.80 5.13 0.00* 109.72 4.51 0.00* 110.25 4.53 0.00*
GDP growth (GDPGR) 260.38 3.85 0.00* 351.24 7.66 0.00* 351.38 7.66 0.00*
Inflation (Infl) −198.62 −3.68 0.00* −23.29 −0.57 0.56 −25.86 −0.64 0.51
R2 0.500 0.776 0.193
Adjusted R2 0.499 0.775 0.192
F-statistic 803.082 835.803 193.139
Prob (F-statistic) 0.000 0.000 0.000
D-W statistics 0.541 1.206 1.202
F test F statistic = 412.903, P = 0.00000
Hausman test Chi square statistic = 4.36604, P value = 0.8857
(*Significance at 1%, **Significance at 5% and ***Significance at 10%).
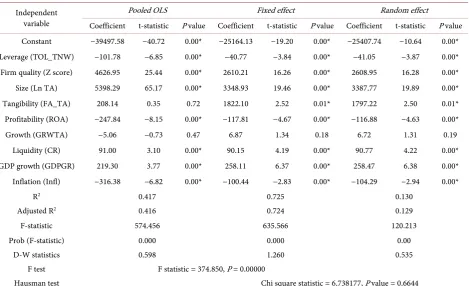
Table 6. Panel data Equation (2) with dependent variable-Mcap.
Independent variable
Pooled OLS Fixed effect Random effect
Coefficient t-statistic P value Coefficient t-statistic P value Coefficient t-statistic P value Constant −39497.58 −40.72 0.00* −25164.13 −19.20 0.00* −25407.74 −10.64 0.00*
Leverage (TOL_TNW) −101.78 −6.85 0.00* −40.77 −3.84 0.00* −41.05 −3.87 0.00*
Firm quality (Z score) 4626.95 25.44 0.00* 2610.21 16.26 0.00* 2608.95 16.28 0.00*
Size (Ln TA) 5398.29 65.17 0.00* 3348.93 19.46 0.00* 3387.77 19.89 0.00*
Tangibility (FA_TA) 208.14 0.35 0.72 1822.10 2.52 0.01* 1797.22 2.50 0.01*
Profitability (ROA) −247.84 −8.15 0.00* −117.81 −4.67 0.00* −116.88 −4.63 0.00*
Growth (GRWTA) −5.06 −0.73 0.47 6.87 1.34 0.18 6.72 1.31 0.19
Liquidity (CR) 91.00 3.10 0.00* 90.15 4.19 0.00* 90.77 4.22 0.00*
GDP growth (GDPGR) 219.30 3.77 0.00* 258.11 6.37 0.00* 258.47 6.38 0.00*
Inflation (Infl) −316.38 −6.82 0.00* −100.44 −2.83 0.00* −104.29 −2.94 0.00*
R2 0.417 0.725 0.130
Adjusted R2 0.416 0.724 0.129
F-statistic 574.456 635.566 120.213
Prob (F-statistic) 0.000 0.000 0.00
D-W statistics 0.598 1.260 0.535
F test F statistic = 374.850, P = 0.00000
Hausman test Chi square statistic = 6.738177, P value = 0.6644
[image:13.595.68.538.430.716.2]Table 7. Panel data equation 3 with dependent variable-PB.
Independent variable
Pooled OLS Fixed effect Random effect
Coefficient t-statistic P value Coefficient t-statistic P value Coefficient t-statistic P value
Constant −4.126 −26.962 0.000* −1.928 −7.710 0.000* −2.096 −7.265 0.000*
Leverage (TOL_TNW) 0.084 34.648 0.000* 0.088 41.332 0.000* 0.088 41.277 0.000*
Firm quality (Z score) 2.369 82.701 0.000* 2.225 72.752 0.000* 2.218 73.106 0.000*
Size (Ln TA) 0.224 17.091 0.000* 0.038 1.151 0.249 0.059 1.890 0.058**
Tangibility (FA_TA) 1.210 12.973 0.000* −0.267 −1.938 0.052** −0.196 −1.446 0.1481 Profitability (ROA) −0.175 −36.452 0.000* −0.117 −24.392 0.000* −0.117 −24.516 0.000*
Growth GRWTA 0.014 13.523 0.000* 0.015 16.013 0.000* 0.015 16.010 0.000*
Liquidity (CR) −0.028 −6.261 0.000* −0.011 −2.797 0.005* −0.011 −2.755 0.005*
GDP growth (GDPGR) 0.093 10.194 0.000* 0.068 8.856 0.000 0.069 8.972 0.000*
Inflation (Infl) 0.006 0.897 0.369 0.014 2.125 0.033** 0.012 1.905 0.056**
R2 0.5652 0.7005 0.5586
Adjusted R2 0.5647 0.6993 0.5580
F-statistic 1037.9470 558.6899 1010.3240
Prob (F-statistic) 0.0000 0.0000 0.0000
D-W statistics 0.9290 1.2552 1.2459
F test F statistic = 147.7796, P = 0.00000
Hausman test Chi square statistic = 38.538, P value = 0.000
*Significance at (*Significance at 1%, **Significance at 5% and ***Significance at 10%).
(2) indicate use of random effect model by failing to reject the null hypothesis; whereas Equation (3) rejects the null hypothesis and proposes use of fixed effect model. As for Equations (1)-(3), Chi square statistic with P value is 4.36604 (P = 0.8857), 6.738177 (P = 0.6644), and 38.538 (P = 0.000) respectively. We tested for the correlation coefficient between the dependent variables to find explanation be-hind these results. The correlation coefficient between EV and Mcap came out to be extremely high as 0.95. Whereas, the correlation coefficient of PB with Mcap and EV was low, being 0.17 and 0.16 respectively. Since EV and Mcap are highly correlated, both Equations (1) and (2) when subjected to Hausman test gave simi-lar results of preference for random effect model. Whereas with PB having low correlation with EV and Mcap, the model preferred through Hausman test was different from the model of random effect. The results are reported in Tables 5-7.
Hence, the study interprets the results of random effect model for Equations (1) and (2) along with the fixed effect model for Equation (3). The results inter-preted are from the perspective of effect of variables under study on firm abso-lute and relative measures. While EV and MCap are absoabso-lute firm value meas-ures, PB is a relative firm value measure. We estimate the random effect (with Swamy and Arora estimator of component variances) model. The model will become more parsimonious and robust.
However the relation is positive for Equations (1) and (3) but is negative for Eq-uation (2). The negative relation is consistent with the study of Feidakis & Rovo-lis [27] and Dang [41] which showed a negative relation between share price performance and firm leverage. With market capitalization as a dependent vari-able, higher leverage leads to an adverse effect on it, whereas firm enterprise value shows a positive relation with leverage. It supports the pecking order theory that use of debt is preferred over equity especially in a sector like hospi-tality with a high gestation period. Hence, Modigliani Miller theorem of capital structure irrelevance does not hold for Indian hotel firms.
The firm quality score has a significant positive relation with firm value for all equations as expected. The coefficient value for Equations (1)-(3) is 2266.91, 2608.95 and 2.225 respectively with all being significant at 1% significance level. A high Z score demonstrates high firm quality by reducing the probability of bankruptcy. It leads to a positive impact on firm value. With a high gestation pe-riod, variables used to calculate firm quality reflect the firm’s capability of gene-rating opegene-rating returns and operations.
Size also has a positive relation with firm value for all equations. However, the Ln_size coefficient is statistically significant at 1% significance level for Equa-tions (1) and (2) only. In case of Equation (3), the coefficient is not statistically significant with a large p value of 0.249. The positive significant relation with absolute firm value measures is consistent with the studies of Feidakis & Rovolis
[27], Antoniou [25] and Dang [41]. Theoretically, trade off view and size being inversely related to bankruptcy probability support the above result.
For tangibility and growth in total assets, the results are inconclusive for its effects on firm value. With respect to Equation (3), relative measure of firm val-ue PB, tangibility is significant at 5% significance level with growth in total assets significant at 1% significance level. With respect to absolute firm value measures, tangibility is significant at 1% significance level for Mcap but is insignificant for EV. On the contrary, growth in total assets is significant at 5% significance level for EV but is insignificant for Mcap. Prior studies including works of Rajan and Zingales [16], Feidakis & Rovolis [27], Antoniou [25] and Dang [41], have shown a positive significant relationship between firm leverage and tangibility on account of trade off view and agency costs. It is yet to be explored further whether the ownership of hotel land and building resides with the firm or are leased. In such cases a more detailed study of the nature of ownership is re-quired. Currently, it is beyond the scope of this study to examine it in depth. Tangibility and growth in fixed assets will also determine the level of secured debt the firms are targeting based on collateralized assets. It also needs to be ex-plored with respect of how secured debt impact firm value. In our study, debt has been taken as total outside liabilities only and not demarcated between se-cured or unsese-cured.
profitability, the firm value is determined by the quality of the operations. In this case firm liquidity has a positive significant relation with absolute firm value measures. With sufficient funds to support short term operating liabilities en-sures smooth functioning of the hotel industry’s operations.
While GDP has a positive significant relation for all equations, the effect of in-flation is mixed. It indicates that economic growth has a significant positive im-pact on firm quality in hospitality industry.
From the results it is evident that firm quality, size, leverage and current li-quidity have a significant influence on firm value. Thus Modigliani Miller theo-rem does not hold in Indian hospitality context. Firm size and cost of financial distress measured through a firm quality score having a significant influence on firm value; reflect the theoretical support of trade off theory along with agency cost theory.
6. Conclusions and Discussion
This study has aimed to contribute to the existing literature in various ways. Firstly, it is one of the few studies which enhance the understanding of factors affecting firm value of hospitality sector in India over a large time frame of 15 years. Large gestation period and funding structure being key concerns of hos-pitality sectors, make it imperative to understand unique factors which influence firm value. Majority of the studies are done in manufacturing sector. Secondly, it is one of the first empirical tests to use firm quality score of Z value as it has not been tested in hospitality sector in Indian context.
Based on the findings of the study, we suggest few policy measures for Indian hospitality firms. With firm quality and liquidity having a significant influence on firm value, financial institutions should focus on offering funds which can ensure smooth functioning of operations. With a long gestation period, a better access to funds with friendly lending policy can enable improvement in opera-tions. With negative relation with profitability, it could be that markets prefer hospitality firms to leverage debt for expansion, which could be due to unique attribute of the industry itself. However, at the same time, boost tourism as an external force can help improve the income in hospitality sector. Along with ex-pansion in asset properties, a parallel exex-pansion in revenue generation is also needed. With leverage having a significant influence on firm value, the study highlights the importance of capital structure on firm value. It is of use for hotel owners to relook at their debt equity mix and fulfill multiple objectives of im-proving firm quality and firm liquidity by making better financial decisions. For listed firms, market performance is vital and improvement in firm quality by op-timal capital mix which can ascertain value creation. The results also show growth in GDP having a significant positive impact on firm value. The results from the study are supported by the existing TOT and agency cost theories. With size having a significant positive relationship with firm value, it urges to ask “Does big means better?”
hos-pitality companies. With few number of hoshos-pitality companies only listed, the scope of the research could be expanded to understand the determinants of cap-ital structure. Secondly, the explanatory power of the model can be improved by taking more relevant variables. However, our study was limited to the use of re-levant variables based on the availability of data.
The study has laid the foundation to explore the role of asset structure in depth in determining firm value. Future work is needed to understand the role of asset ownership and firm expansion by developing new hypothesis for their influence on firm value. Moreover, a more detailed account of financials over a large time frame is needed to understand the dynamics of the hospitality sector.
Acknowledgements
The authors of the study thank Dr. Joy Deng for their editorial assistance and the anonymous referee for their constructive feedback and suggestions.
References
[1] Varuni, K. and Sathyanarayanan, D. (2014) Hoteliers Hope Next Govt to Drive Turnaround in Sector. ET Bureau.
Http://Articles.Economictimes.Indiatimes.Com/2014-04-10/News/49031679_1_Fhr ai-Next-Government-Restaurant-Associations
[2] Thadani, M. and Mobar, J.S. (2013) Critical Challenges Faced by Hotel Owners in India. HVS India Report, India.
[3] IBEF (2016) Tourism and Hospitality. India Brand Equity Foundation, New Delhi, India.
[4] Modigliani, M. and Miller, M.H. (1958) The Cost of Capital, Corporation Finance and the Theory of Investment. American Economic Review, 48, 261-297.
[5] Walter, J.E. (1963) Dividend Policy: Its Influence on the Value of the Enterprise.
The Journal of Finance, 18, 280-291.
https://doi.org/10.1111/j.1540-6261.1963.tb00724.x
[6] Solomon, E. (1963) Leverage and the Cost of Capital, Journal of Finance, 18, 273- 279. https://doi.org/10.1111/j.1540-6261.1963.tb00723.x
[7] Beaver, W. (1966) Financial Ratios as Predictors of Failure. Journal of Accounting Research, 5, 71-111. https://doi.org/10.2307/2490171
[8] Altman, E.I. (1968) Financial Ratios, Discriminant Analysis and the Prediction of Corporate Bankruptcy. The Journal of Finance, 23, 589-609.
https://doi.org/10.1111/j.1540-6261.1968.tb00843.x
[9] Warner, J. (1977) Bankruptcy Costs: Some Evidence. The Journal of Finance, 32, 337-347. https://doi.org/10.2307/2326766
[10] Myers, S.C. (1977) Determinants of Corporate Borrowing. Journal of Financial Eco- nomics, 5, 147-175. https://doi.org/10.1016/0304-405X(77)90015-0
[11] Deangelo, H. and Masulis, R. (1980) Optimal Capital Structure Under Corporate and Personal Taxation. Journal of Financial Economics, 8, 3-29.
https://doi.org/10.1016/0304-405X(80)90019-7
[12] Harris, M. and Raviv, A. (1991) The Theory of Capital Structure. Journal of Fi- nance, 46, 297-355. https://doi.org/10.1111/j.1540-6261.1991.tb03753.x
[14] Jensen, M. and Meckling, W. (1976) Theory of the Firm: Managerial Behavior, Agency Costs and Ownership Structure. Journal of Financial Economics, 3, 305- 360. https://doi.org/10.1016/0304-405X(76)90026-X
[15] Myers, S.C. (1984) Corporate Financing and Investment Decisions When Firms Have Information Investors Do Not Have. Journal of Financial Economics, 13, 187- 221. https://doi.org/10.1016/0304-405X(84)90023-0
[16] Rajan, R.G. and Zingales, L. (1995) What Do We Know about Capital Structure? Some Evidence from International Data. Journal of Finance, 50, 1421-1460.
https://doi.org/10.1111/j.1540-6261.1995.tb05184.x
[17] Booth, L., Aivazian, V., Demirguc-Kunt, A. and Maksimovic, V. (2001) Capital Structures in Developing Countries. The Journal of Finance, 56, 87-130.
https://doi.org/10.1111/0022-1082.00320
[18] Sarma, L.V. and Rao, H. (1969) Leverage and the Value of the Firm. The Journal of Finance, 24, 673-677. https://doi.org/10.1111/j.1540-6261.1969.tb00391.x
[19] Dhankar, R.S. and Boora, A.S. (1996) Cost of Capital, Optimal Capital Structure, and Value of Firm: An Empirical Study of Indian Companies. Vikalpa, 21, 29-36.
https://doi.org/10.1177/0256090919960303
[20] Bhaduri, S. (2002) Determinants of Capital Structure Choice: A Study of the Indian Corporate Sector. Applied Financial Economics, 12, 655-665.
https://doi.org/10.1080/09603100010017705
[21] Mukherjee, S. and Mahakud, J. (2012) Historical Market to Book Ratio and Corpo-rate Capital Structure: Evidence from India. Global Business Review, 13, 339-350.
https://doi.org/10.1177/097215091201300211
[22] Chadha, S. and Sharma, A. (2016) An Empirical Study on Capital Structure in In-dian Manufacturing Sector. Global Business Review, 17, 411-424.
https://doi.org/10.1177/0972150915619817
[23] Cheng, Y.-S., Liu, Y.-P. and Chien, C.-Y. (2010) Capital Structure and Firm Value in China: A Panel Threshold Regression Analysis. African Journal of Business Ma- nagement, 4, 2500-2507.
[24] Ozkan, A. (2002) The Determinants of Corporate Debt Maturity: Evidence from UK Firms. Applied Financial Economics, 12, 19-24.
https://doi.org/10.1080/09603100110102691
[25] Antoniou, A.G., Guney, Y. and Paudyal, K. (2008) The Determinants of Capital Structure: Capital Market Oriented Versus Bank Oriented Institutions. Journal of Financial and Quantitative Analysis, 43, 59-92.
https://doi.org/10.1017/S0022109000002751
[26] Bevan, A.A. and Danbolt, J. (2004) Testing for Inconsistencies in the Estimation of UK Capital Structure Determinants. Applied Financial Economics, 14, 55-66.
https://doi.org/10.1080/0960310042000164220
[27] Feidakis, A. and Rovolis, A. (2007) Capital Structure Choice in European Union: Evidence from Construction Industry. Applied Financial Economics, 17, 989-1002.
https://doi.org/10.1080/09603100600749311
[28] Charalambakis, E.C. and Psychoyios, D. (2012) What Do We Know about Capital Structure? Revisiting the Impact of Debt Ratios on Some Firm-Specific Factors. Ap-plied Financial Economics, 22, 1727-1742.
https://doi.org/10.1080/09603107.2012.676733
[29] Shah, S.Z. and Jam-e-Kausar (2012) Determinants of Capital Structure of Leasing Companies in Pakistan. Applied Financial Economics, 22, 1841-1853.
[30] Naceur, S.B. and Goaied, M. (2002) The Relationship Between Dividend Policy, Fi-nancial Structure, Profitability And Firm Value. Applied Financial Economics, 12, 843-849. https://doi.org/10.1080/09603100110049457
[31] Titman, S. and Wessels, R. (1988) The Determinants of Capital Structure Choice.
Journal of Finance, 43, 1-19. https://doi.org/10.1111/j.1540-6261.1988.tb02585.x
[32] Ang, J.C., Chua, J.H. and McConnell, J.J. (1982) The Administrative Costs of Cor-porate Bankruptcy: A Note. Journal of Finance,37, 219-226.
https://doi.org/10.1111/j.1540-6261.1982.tb01104.x
[33] Voulgaris, F.A., Asteriou, D. and Agiomirgianakis, G. (2004) Size and Determinants of Capital Structure in the Greek Manufacturing Sector. International Review of Applied Economics, 18, 247-262. https://doi.org/10.1080/0269217042000186714
[34] Myers, S.C. (1984) The Capital Structure Puzzle. Journal of Finance, 39, 575-592.
https://doi.org/10.2307/2327916
[35] Voutsinas, K. and Richard, A.W. (2011) Credit Supply and Corporate Capital Struc- ture: Evidence from Japan. International Review of Financial Analysis, 20, 320-334.
https://doi.org/10.1016/j.irfa.2011.05.002
[36] Al-Fayoumi, N.A. and Abuzayed, B.M. (2009) Ownership Structure and Corporate Financing. Applied Financial Economics, 19, 1975-1986.
https://doi.org/10.1080/09603100903266807
[37] Jensen, M. (1986) Agency Costs of Free Cash Flow, Corporate Finance, and Ta-keovers. American Economic Review, 76, 323-329.
[38] Harris, M. and Raviv, A. (1990) Capital Structure and the Informational Role of Debt. TheJournal of Finance, 45, 321-349.
https://doi.org/10.1111/j.1540-6261.1990.tb03693.x
[39] Gujarati, D.N. (2009) Basic Econometrics. Tata McGraw-Hill Education, New Del-hi.
[40] Hausman, J. (1978) Specification Tests in Econometrics. Econometrica, 46, 1251- 1271. https://doi.org/10.2307/1913827
[41] Dang, V.A. (2013) Testing Capital Structure Theories Using Error Correction Mod-els: Evidence from the UK, France and Germany. Applied Economics, 45, 171-190.
https://doi.org/10.1080/00036846.2011.597724
Submit or recommend next manuscript to SCIRP and we will provide best service for you:
Accepting pre-submission inquiries through Email, Facebook, LinkedIn, Twitter, etc. A wide selection of journals (inclusive of 9 subjects, more than 200 journals)
Providing 24-hour high-quality service User-friendly online submission system Fair and swift peer-review system
Efficient typesetting and proofreading procedure
Display of the result of downloads and visits, as well as the number of cited articles Maximum dissemination of your research work
Submit your manuscript at: http://papersubmission.scirp.org/