Munich Personal RePEc Archive
Focusing on the Focusing Illusion...
Beja, Edsel Jr.
Ateneo de Manila University
14 January 2013
Online at
https://mpra.ub.uni-muenchen.de/44366/
Focusing on the Focusing Illusion…
EDSEL L. BEJA JR.*
Abstract
The paper presents evidence that validate the focusing illusion. Specifically, the forecasted impact
of a basketball championship on students’ subjective well-being was exaggerated because of their
intense focus on the event. However, the self-reported states of being for life domains not closely
associated with the focal event remained stable throughout the survey periods. Further analysis of
the data finds that the exaggerated level of subjective well-being brought about by the focusing
illusion had minimal spillover effects on the reported levelsof subjective well-being for the other
life domains.
Keywords:Focusing illusion; spillover; subjective well-being; life domains
1. INTRODUCTION
Compared to the actual or recall of the impact of an event or circumstance on a person’s subjective
well-being (SWB), the perceived impact is usually exaggerated because the person focused on the
event or circumstance.1This overreaction—which is also called “focusing illusion” (Schkade and
*
Department of Economics, Ateneo de Manila University, Quezon City 1108, Philippines
Tel/Fax: +63-2-4265661
E-mail: [email protected]
1
Kahneman 1998)—occurs because focused thinking on an event or circumstance makes the event
or circumstance very significant, invokes strong emotions, creates mental scenarios, etc., to cause
the person to make a big deal out of the situation. The focusing illusion—a type of cognitive
bias—is an important explanation to why SWB, in some cases, is inaccurate or, in other
instances, is flawed.
The focusing illusion is fundamentally an outcome of two related processes. The first one is called
“projection bias” (Loewenstein et al. 2003) wherein attention to an event or circumstance at initial
time,t = 0,is assumed to remain the same throughout succeeding periods,t > 0. The other process
is called “affective forecasting bias” (Gilbert and Wilson 2000) wherein the valence of an event
or circumstance and intensity of SWB at t = 0 is assumed to remain constant over t > 0. The
property of constancy in both processes is also called “durability bias” (Gilbert et al. 1998; Wilson
et al. 2000).
In other words, the focusing illusion indicates a failure to consider that perspective, attention, and
feeling change with the passage of time. First, there is “rationalization” (e.g., Wilson and Gilbert
2008), a stage wherein a person tries to make sense out of the situation, thereby facilitating
adaptation to the new or changed context. Then, attention is withdrawn as the focal event or
circumstance loses novelty and importance to the person. In the end, the exaggerated level of
SWB adjusts toward a baseline level, or an evaluation that may be considered as “illusion free”.
unpleasant events or experiences. SWB is an umbrella concept. One part of it is cognitive (i.e., satisfaction
or happiness) and another part is affective (i.e., positive and negative emotions). The cognitive part can be
called “evaluative happiness” and the affective part as “emotional happiness.” The scope of the evaluation
for either part can vary as well. Thus, “life domain” is either global (i.e., a person’s life on the whole),
specific (i.e., an aspect of a person’s life), or momentary (i.e., at a particular point in time of a person’s life)
evaluation. In this paper, SWB is limited to evaluative happiness and covers global and specific evaluations
only. It is important that a person makes a self-evaluation of state of being and conveys the assessment
Repeated studies have established that, indeed, the focusing illusion results in biased SWB. One
of the first studies is Schkade and Kahneman (1998), who found that college students paid
particular attention to the overall quality of the environment in their area when making
comparisons about the living conditions in California, Ohio, and Michigan. Focusing on the
climate made respondents conclude that California was a better place compared to either Ohio or
Michigan even though climate did not mean a real difference in their SWB.
Gilbert et al. (1998) studied the reaction of assistant professors to the outcome of their tenure
applications. The analysis involved a “forecasters” group (i.e., those who would be applying for
tenure) and an “experiencers” group (i.e., those who applied and got or did not get tenure).2They
found that both types of applicants overestimated the short-term impact of the outcome of their
application to SWB but were generally accurate about the long-term impact of the outcome of
their application.
Buehler and McFarland (2001), on the other hand, examined the reaction of college students to
their final grades. Initially, respondents were asked to predict their SWB if what they received at
the end of the semester was a grade higher, the same, or lower than expected. Subsequently,
respondents were also asked about their SWB after they received their actual grades at the end of
the semester. Results showed that respondents overpredicted their SWB regardless of what they
projected to be their final grade.
In yet another school-related experiment, Wilson et al. (2000) analyzed the reaction of college
students to the outcome of a football game.3In one version of the study, respondents were asked
2
Kermer et al. (2006) and Eastwick et al. (2008) also use the forecaster and experiencer setup.
3
American football is the focal event in Wilson et al. (2000). European football (or soccer) is the focal event
before the actual game to rate their SWB if their school team won or lost an important game.
Respondents were also assigned to either control group or treatment group. The findings showed
that the forecasted SWB were exaggerated regardless of the outcome of the actual game. More
importantly, SWB started to level off a few days after the focal event. In fact, this conclusion
holds regardless of the grouping of respondents, albeit SWB of those in the treatment group were
generally lower compared to those in the control group.
In another version of the experiment, Wilson et al. (2000) asked respondents to report their SWB
right after a football game and, again, a few days later. Similarly, the SWB of respondents after
the game were exaggerated but started to fall few days after the focal event and especially so after
other games had been played by the school team during the week.
Of course, different settings and experimental procedures have been tried to test the focusing
illusion. Wilson and Gilbert (2003) have surveyed the literature up to 2002. Recent studies in this
topic analyze vacation (Wirtz et al. 2003), hemodialysis (Riis et al. 2005), colostomy (Smith et al.
2006), income (Kahneman et al. 2006), gambles (Kermer et al. 2006), experiencing relationship
breakups (Eastwick et al. 2008), unemployment (Dolan and Powdthavee 2011), and housing
(Nakazato et al. 2011).
At one level, if the focusing illusion is limited to the associated life domain (or domains), then it
has no bearing on the other life domains that are not relevant or directly connected to the focus
(c.f., Schwartz and Clore 1983; Schimmack et al. 2002).4That is, the instabilityof SWB for a life
domain (due to the focusing illusion) cannot affect the stabilityof SWB for the other life domains
not relevant to the focusing illusion. This view is actually consistent with the findings that
4
“Life domain” refers to the scope of evaluation. Here, it can refer to life overall or a specific domain of
emotions (Diener and Emmons 1985) as well as evaluations of life (Lucas et al. 1996) and of
social realities (Hooghe 2012) are separable and independently measurable constructs. It is also
consistent with the notion that people make evaluations on various levels and dimensions of life
domains (Michalos 1980). In fact, SWB is stable provided life conditions are also relatively the
stable across time (Diener and Larsen 1984; Costa and McCrae 1988).
Yet, on another level, the focusing illusion in one life domain is presumed to have no spillover
effects on the other life domains. In short, the exaggerated levelof SWB for a life domain (due to
the focusing illusion) cannot affect thelevelsof SWB for the other life domains not relevant to the
focusing illusion. This notion is generally accepted because test-retest results often show that the
levels of SWB for the other life domains are relatively stabledespite the focusing illusion in one
aspect of life. Nevertheless, what needs emphasis here is that the levelof SWB is different from
the stabilityof SWB.
Thus, in addition to verifying the focusing illusion, the present study presents results on the notion
that the focusing illusion has zero spillover effect on the levels of SWB for the other life domains.
This problematique—despite an appearance of “splitting hairs”—has very important implications
on the usefulness of SWB per se. If it is established that the levels of SWB for the other life
domains are similarly biased by the focusing illusion, then this confirmation puts doubt to the
basic value of SWB as an object of analysis and, given recent developments, as input to public
policy. Indeed, a zero or even trivial impact from the focusing illusion is not only a validation of
the usefulness of SWB, but also a push for greater accuracy in measurement procedures in order
that SWB is rendered comparable across contexts and peoples.
Following the introduction, the theoretical and empirical framework of the paper is presented in
last section concludes the paper.
2. FRAMEWORK
Theoretical Setup
A key variable in the analysis of the focusing illusion is time itself because, as mentioned earlier,
perspective, attention, and feeling change with the passage of time. Accordingly, takeZas SWB
for a life domain (however defined) and takes the general formZ = F(t, X), where tis time and X
is a vector of determinants like socio-economic profile, etc. As with the extant literature, Zis not
a person’s “representation” of the perceived state of being of another but rather it is a person’s
“representation” of one’s own internal state of being.
Applying total differentiation obtainsdZ = Ftdt + FXdX. Simplifying the expression gets
dt dZ =F
t
+ FX
dt dX
. If
dt dX
= 0 (i.e., it does not change within a fixed period), then the focusing illusion is
verified when
dt dZ=F
t≠ 0at t. There are deflated evaluations whenFt>0 and inflated evaluations
whenFt< 0. From the total differentiation, the expression
dX dZ
= FXis obtained which measures of
the relationship betweenXandZ.
Next, consider two SWB for two life domains, Z and Y. As with Z, Y is the same person’s
“representation” of internal state of being but on the other life domain. For now, set the focusing
illusion onZ(as above) but not on Y. To determine if there is a spillover effect from thelevelofZ
Again, total differentiation obtainsdY = Htdt + HX dX+ HZ
t Z
∂
∂ dt+H
Z
X Z
∂
∂ dXand so
dt dY = H
t+
HX
dt dX
+ HZ
t Z
∂ ∂ + H
Z dt dX X Z ∂
∂ . With
dt dX
= 0 obtains
dt dY
= Ht+HZ
t Z
∂
∂ . The assumption thatH
t= 0
results in the simpler expression,
dt dY=H
Z
dt
dZ. Therefore,H
Zmeasures the spillover effect and its
sign indicates if the impact is positive or negative. Lastly, obtaining the expression
dX dY = H
X +
HZ
X Z
∂
∂ gives the relationship between Xand Ygiven that Xalso related to Z.
Empirical Setup
Regression analysis is used to test whether
dt
dZ>0 is statistically significant. Note thattis also the
particular survey round. Note further that the regression analysis needs to take into account the
nature of the dataset. In this study, several responses were obtained from the same respondents.
As such, respondents form one dimension and their responses across survey rounds form another
dimension. The latter is therefore nested in the former. The repeated measures procedure will not
give efficient results when the assumptions of compound symmetry and sphericity are violated
and when there are missing observations in the dataset.
Given the nature of the dataset in this study (described in Section 3), the appropriate method for
analysis is the multilevel repeated procedure.5Thus, for the focusing illusion, the following set of
equations comprises the multilevel specification:Zti= α0+ α1timeti+εtiwithα0= β00+β01Xi+e0i
for the between respondent variation and α1= β10+β11Xi+ e1ifor the within respondent variation.
So the regression model is Zti=β00 + β01Xi+β10timeti+β11(X◊time)i+(e0i+ e1itimeti+εti)witht =
0, 1…n. From Section 2.1, the focusing illusion is confirmed if and only ifβ10≠0. The sign on β01
5
(i.e.,
dX
dZ ) depends on the specific determinant included in the model.
Correspondingly, to find out if the level of Z affects thelevelof Yrequires the following set of
equations:Yti= α0+ α1 timeti+ α2Zti+ α3(time◊Z)ti+εtiwith α0= φ00 +φ01Xi+ e0i, α1= φ10 +φ11Xi
+ e1i, andα2= φ20 + e2ifor the between respondents, within respondent, and within Zvariations,
respectively. Notice that Zti and its interaction with timeare on the first level equation. For the
regression analysis, α3 is not a random parameter. They obtain Yti= φ00 + φ01Xi + φ10timeti +
φ11(X◊time)i+φ20Zti+α3(Z◊time)ti+ (e0i+ e1itimeti+ e2iZti+εti). No focusing illusion in Ytimakes
φ10= 0. Then, the impact of the focusing illusion in Ztion Ytiis therefore measured by φ20≠ 0. Its
effect onYtiacross time is indicated by α3≠ 0.From the above setup,
dX dY
=φ01+φ20β01measures
relationship between Xand Y. Note that φ11 indicates if a change in the relationship betweenX
andYacross time exists.
3. METHODOLOGY
Emails containing an invitation to answer an online survey were sent to college students at Ateneo
de Manila University. Participation was voluntary. No extra credit was offered to the students.
The surveys took place in 2011 and 2012. Data were collected for two months from September to
October of each year. Both periods coincided with the basketball championship games of the 74th
and 75th seasons of the University Athletics Association of the Philippines. Ateneo de Manila
University was at the championships in both seasons. It won its “four-peat” championship and its
“five-peat” championship, respectively.6
6
The four-peat championship is not a unique achievement in the tournament, but it was a chosen as
a focal event for students at Ateneo de Manila University because it meant that the school equaled
the record of its two rival schools.7 The five-peat championship may be argued as a unique
achievement because no school under the current format of the tournament (i.e., since 1993) had
managed to pull off such feat (see Footnote 7). At any rate, both occasions were perfect natural
settings for an experiment on the focusing illusion of the students.8
The surveys in 2011 had three rounds. The first round was sent to the students two weeks before
the championship games were held. The next round followed two weeks after the school won the
championship. Then, the third round was done two weeks after the second round or four weeks
after the school won the championship. Respondents to the 2011 surveys answered three rounds.
The schedule was similar in 2012. The treatment and control respondents were identified for the
2012 surveys. The former answered all three rounds. In contrast, latter answered only the second
and third survey rounds (i.e., after the championship was won). This setup was necessary to find
out if the intensity of focusing illusion results in an anchoring effect, thereby influencing the level
of SWB in the successive rounds (c.f., Dolan and Metcalfe 2010).
championships.
7
The University of Santo Tomas (1993-1996) and De La Salle University (1998-2001) had four consecutive
championships. The University of the East had seven consecutive championships (1965-1971) under the old
format of the tournament in the 1950s, but its third championship in 1967 was shared with the University of
Santo Tomas. That is, the University of the East had four consecutive championships as sole champion. The
University of Santo Tomas had six consecutive championships during the early years of the tournament (in
1939-1940 and in 1946-1949 seasons with no games during World War II), but it was not sole champion in
two occasions, in 1939 and 1947. The tournament had four competing schools before the 1950s. Ateneo de
Manila University and De La Salle University joined the tournament in 1978 and 1986, respectively.
8
Another way of looking at the 2012 championship is that respondents saw the 5-peat championship as a
The first segments of the 2011 and 2012 surveys have identical content. Following an explanation
of the purpose of the survey, a declaration that the survey and its protocol were approved by the
Committee on Ethics of the school, and guarantees on the confidentiality of information and
responses, details like school ID number, email, and profile like gender, age, and school year level
were collected from respondents. 9 The other and last part of the 2011 surveys contained two
items regarding the focal event (c.f., Wilson et al. 2000), as follows:
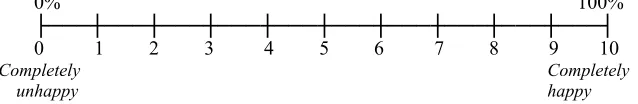
Mark the corresponding number to indicate your happiness if Ateneo de Manila University will win the 4-peat basketball championship. Note: 0 or 0% means
completely unhappy, 5 or 50% means neutral or indifferent, and 10 or 100% means completely happy.
0% 100% ├───┼───┼───┼───┼───┼───┼───┼───┼───┼───┤ 0 1 2 3 4 5 6 7 8 9 10
Completely Completely
unhappy happy
Mark the corresponding number to indicate your happiness if Ateneo de Manila University will not win the 4-peat basketball championship. Note: 0 or 0%
means completely unhappy, 5 or 50% means neutral or indifferent, and 10 or 100% means completely happy.
0% 100% ├───┼───┼───┼───┼───┼───┼───┼───┼───┼───┤ 0 1 2 3 4 5 6 7 8 9 10
Completely Completely
[image:11.612.145.464.317.369.2]unhappy happy
Figure 1
These queries were reworded into past tense when asked after the first round of the 2011 surveys.
There were no queries on other life domains in this case.
The third—and last—part of the 2012 surveys is the counterpart of the above items queried in the
9
The introductory statement of the survey mentioned that student information was obtained from the Office
of Student Affairs. The reference to the Office of Student Affairs was deliberate so that respondents take the
2011 surveys. For the 2012 surveys, however, they were placed last in order to minimize
question-order effects (c.f., Strack et al. 1988). The queries read as follows:
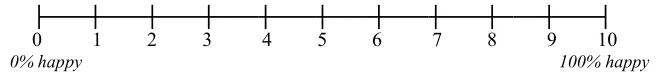
Mark the corresponding number to indicate your happiness if Ateneo de Manila University will win the 5-peat basketball championship. Note: 0 means 0%
happy, 5 means “50-50” (i.e., neutral or indifferent), and 10 means 100% happy.
├───┼───┼───┼───┼───┼───┼───┼───┼───┼───┤ 0 1 2 3 4 5 6 7 8 9 10 0% happy 100% happy
Mark the corresponding number to indicate your happiness if Ateneo de Manila University will not win the 5-peat basketball championship. Note: 0 means 0%
happy, 5 means “50-50” (i.e., neutral or indifferent), and 10 means 100% happy.
[image:12.612.146.477.196.233.2]├───┼───┼───┼───┼───┼───┼───┼───┼───┼───┤ 0 1 2 3 4 5 6 7 8 9 10 0% happy 100% happy
Figure 2
Note that the control group in the 2012 surveys answered the above two items in the two post
championship rounds. The queries were reworded into past tense when asked after the first round
of the 2012 surveys.
The middle part of the 2012 surveys dealt with the life domains. These included two queries on
“overall” life judgments and two queries on “specific” life domains, particularly associated with
the school and being a student of the school, as follows:
Mark the corresponding number to indicate your happiness with your life. On the scale below, 0 means “0% happy” and 10 means “100% happy”. [Life-1]
├───┼───┼───┼───┼───┼───┼───┼───┼───┼───┤ 0 1 2 3 4 5 6 7 8 9 10 0% happy 100% happy
├───┼───┼───┼───┼───┼───┼───┼───┼───┼───┤ 0 1 2 3 4 5 6 7 8 9 10 0% happy 100% happy
Mark the corresponding number to indicate your happiness with your entire and overall experience as student at Ateneo de Manila University. On the scale below, 0 means “0% happy” and 10 means “100% happy”. [Ateneo]
├───┼───┼───┼───┼───┼───┼───┼───┼───┼───┤ 0 1 2 3 4 5 6 7 8 9 10 0% happy 100% happy
Mark the corresponding number to indicate your happiness to be Atenean.10 On the scale below, 0 means “0% happy” and 10 means “100% happy”. [Atenean]
[image:13.612.152.477.67.106.2]├───┼───┼───┼───┼───┼───┼───┼───┼───┼───┤ 0 1 2 3 4 5 6 7 8 9 10 0% happy 100% happy
Figure 3
The list of life domains was deliberate in order to test the relative impact of the focal event. In
addition, the list of life domains was intended to be short in order to keep respondents interested
throughout the three rounds of the surveys.
It was necessary that respondents of the 2011 surveys and those in the treatment group of the 2012
surveys were not told about a second round after they answered the first round of the surveys. It
was, however, important that respondents were asked if they would still be willing to answer a
final round after completing the second round in order to minimize biased answers in the final
round caused by survey irritation, fatigue, etc. In contrast, respondents in the control group of the
2012 surveys were asked after the initial round if they would be willing to answer another round
of the survey. Only the timing of the final round of the surveys was not revealed to respondents.
In the end, the 2011 surveys had 378 valid respondents (male = 136 (36%), ageave.378= 18.6, and
range = 16 - 22 years). Most respondents were second and third year students (Nfirst= 15 (15.3%),
10
Nsecond= 122 (32.3%), Nthird= 106 (28%), and Nfourth = 92 (24.3%)). The 2012 surveys had 584
valid respondents comprising both the control and treatment groups. Both second and third year
students comprised the majority of both control group (Ncontrol= 267, male = 104 (39%), ageave.267
= 18.9, range = 17 to 22 years; Nsecond = 111 (41.6%), Nthird = 109 (40.8%), and Nfourth = 47
(17.6%)) and treatment group (Ntreatment = 317, male = 124 (39%), ageave.317= 18.9, range = 17 to
22 years; Nsecond= 136 (42.9%), Nthird= 237 (40.1%), and Nfourth= 54 (17 %)). 11
A few points about the design of the measurement scale used in the study are apt in this juncture.
Notice, first, the calibration (Figures 1, 2, and 3) indicates that “0” on the scale is the same as
“0%” and that “10” on the scale is the same as “100%”. These qualifiers ensure that the cognitive
processes during the evaluation of a life domain are similar, if not appropriately equivalent, for all
respondents. What the qualifiers accomplish in the end is a correspondence between the numerical
sequence 0-1-2-3-4-5-6-7-8-9-10 and the percent sequence of 0-10-20-30-40-50-60-70-80-90-100.
Accordingly, individual achievements are brought in context of personal goals and evaluated on a
fixed increment of 10 percent. Finer increments are not necessary because the cardinality of SWB
is realized anyway with little demand on cognitive power. Beyond the correspondence in ratings,
notice that the qualifiers also succeeds in internalizing the comparison of individual evaluations
with respect to a life domain, social convention, time, etc.12 In short, the measurement scale in
11
No first year student was included in the 2012 surveys. This exclusion was done to minimize “extreme”
overreactions to the win and lose queries given that first year students have not previously experienced the
school winning a championship. Thus, the 2012 surveys (second to fourth years) included students who
knew what it felt like when the school won a championship. In a way, the exclusion of first year students in
the 2012 surveys also serves as a validation on the robustness of the results given that the 2011 surveys had
first year students.
12
Cardinality and intra- and interpersonal comparability can be demonstrated using a thought experiment.
Consider two half-full glasses. Their and the substance used to fill the glasses need not be the same. Now,
imagine asking any person to choose the half-full glass. The answer will of course be “both are half full” or
this study is able to obtain SWB that is cardinal and intra- and interpersonally comparable.
3. FINDINGS
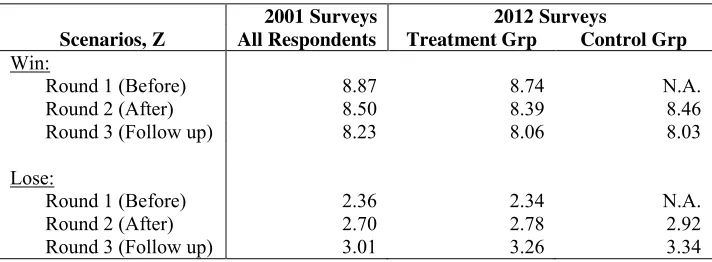
Tables 1 and 2 present the means of SWB for both win and lose scenarios in the 2011 and 2012
surveys. For the 2011 surveys, results confirm a downward linear trend in the means of the win
scenario (F(1, 377) = 103.7, p < 0.001) and an upward linear trend in the means of lose scenario
(F(1, 377) = 41.168, p < 0.001). The same conclusion is reached for the means of the win and lose
scenarios in the control group (win scenario F(1, 266) = 40.1, p < 0.001; lose scenario F(1, 266) =
22.1, p < 0.001) and treatment group (win scenario F(1.989, 316) = 58.736, p < 0.001; lose
scenario F (1.897, 316) = 48.726, p < 0.001) of the 2012 surveys.13Further analyses of the data in
Table 1 determine no difference in the means of both the control and treatment groups during the
post championship rounds (ΔMAfter:win-lose = -0.07 and ΔMFollowup:win-lose = 0.03, both p = n.a.). In
short, having been asked to indicate SWB before the championship in 2012 did not have a
statistically significant impact on the responses in the succeeding survey rounds. This finding is a
useful proof against panel-effect bias wherein repeated queries from the same person can result in
answers that are anchored or fixed to the initial response. The changes in the means of SWB in
the win and lose scenario observed throughout the surveys therefore confirm the impact of the
focusing illusion.
was done. However, the nature of comparability in this context is still in the relative sense and not in the
absolute sense. Analytically, the measurement scale obtains SWBi(x) ≡ SWBi(y)even if x ≠ y butŒQ, where
i and j are individuals, x and y are “objects” of interest, and Q is a set of items with the same general attributes (e.g., vacations).
13
The assumption of sphericity is rejected in the 2011 surveys: Mauchly’s tests are, respectively,χ2(2) = 3.562 with p = n.s. for the win scenario and χ2(2) = 10.477 with p < 0.01 for the lose scenario. The same goes for the 2012 treatment surveys: Mauchly’s tests are, respectively, χ2(2) = 17.312 with p < 0.001 for the
win scenario and χ2(2) = 17.572 with p < 0.001 for the lose scenario. Thus, the Greenhouse-Geisser
[Insert Tables 1 and 2 Here]
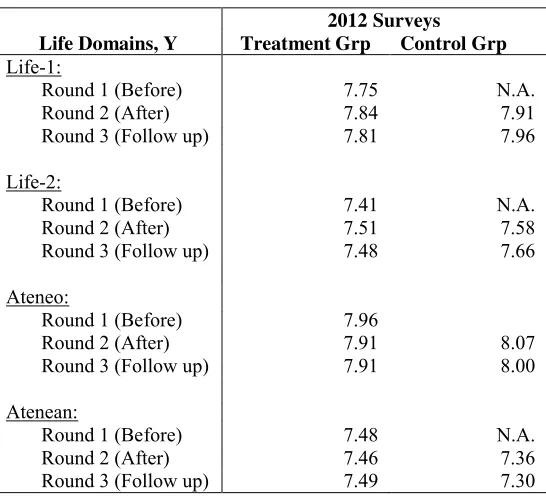
Meanwhile, analyses of the information in Table 2 find that the means of the other life domains
do not vary across time (control group F(1, 266) < 1.20 in all cases, p = n.s.; treatment group F(1,
316) < 0.7 in all cases, p = n.s.). In fact, means analysis indicates that any difference in the means
between the control and treatment groups for a specific life domain and particular survey round is
not statistically significant. This stability in the means of the other life domains is an indication of
their neutrality with respect to the focal event. But, as discussed in the following paragraphs, the
stability of other life domains across time is separate from their levels across time.
Multilevel Regression Analysis
Consider first the regression results for the 2011 surveys. There is indeed a downward trend in the
win scenario (βtime= -0.361, p < 0.001) and an upward trend in the lose scenario(βtime = 0.358, p
< 0.001). These trends do not vary by gender (winβmale= -0.134 and loseβmale= -0.056, both p =
n.s.) and the same goes for all survey rounds (winβmale◊time= -0.071 and loseβmale◊time= 0.040, both
p = n.s.).14Results further reveal that on average respondents belonging in the lower year levels
tend to exaggerate the impact of the focal event much more than those belonging to the upper
year levels (winβyrlevel= -0.140 and loseβyrlevel= 0.205, both p < 0.05). In fact, the perception of
students on the impact of the focal event on their well-being was invariant across year levels for
all survey rounds (winβyrlevel◊time= 0.040 and loseβyrlevel◊time= 0.030, both p = n.s.).
Next, in the case of the 2012 surveys, the trends in the means ofthe win (βtime= -0.477, p < 0.001)
and lose scenarios(βtime= 0.401, p < 0.001) did vary by gender (winβmale= -0.403 and loseβmale=
14
A positive βin the lose scenario indicates an increasing mean toward “5” or “50%” (i.e., neutral). The
0.437, both p < 0.01) and remained so throughout the surveys (winβmale◊time= -0.043 loseβmale◊time
= 0.010, both p = n.s.). As with the 2011 surveys, respondents in the lower year levels tended on
average to exaggerate the impact of the focal event; but, in this case, only the win scenario is
statistically significant (win βyrlevel = -0.222, p < 0.05; lose βyrlevel = 0.095, p = n.s.). How
respondents in the lower year levels perceived the impact of the focal event on their well-being is
similarly invariant across survey rounds (winβyrlevel◊time= 0.073 and loseβyrlevel◊time= 0.012, both p
= n.s.). At the same time, results are invariant to the grouping assignment of respondents (win
βcontrol= -0.168and βcontrol◊time= 0.101, both p = n.s.; loseβcontrol= 0.171and βcontrol◊time= 0.046, both
p = n.s.).
Lastly, the means of the other life domains are stable across survey rounds, as expected (Life-1
βtime = 0.055, Life-2 βtime= 0.071, Ateneoβtime= -0.116, and Atenean βtime= -0.095, all p = n.s.).
They are also invariant to gender, year level of students, and the assignment of respondents into
control or treatment group, as well as their interactions with time (all p = n.s.).
The above findings prove that students of Ateneo de Manila University experienced the focusing
illusion during the 2011 and the 2012 championships. Not surprisingly, the perceived impact of
the focal event was much more exaggerated for students who did not have an experience or had
limited experience of the school winning a championship (particularly, the championships in the
2009 and 2010 seasons). Yet, it is also interesting to find that male respondents, who generally
tend to be much more spirited and vociferous at the games, turned out to be relatively subdued in
how they perceived the impact of the focal event on their SWB compared to female respondents.
This finding might suggest a gender dimension to the focusing illusion but it is something that is
beyond the intent of the study.
How much impact did the focusing illusion have on the levels of SWB for the other life domains
is summarized in Tables 3A and 3B for the win and lose scenarios, respectively. There is no doubt
that the focal event had an unambiguously small but positive impact on the other life domains
when the query was set in the win scenario (Table 3A) and a rather insignificant impact when the
query was set in the lose scenario (Table 3b). Thus, assuming a self-report of 10 (or 100%) in the
win scenario, the contribution of the focusing illusion to the level of SWB for the other domains
ranges from 10% to 14% in the case ofLife-1 and Life-2and from 20% to 30% in the case of
Ateneo and Atenean. That the lose scenario turned out to be of little consequence could be an
artifact of the situation because the championship in 2012 was deemed “in the bag” so to speak.
Based on the above finding, the impact of the focusing illusion on the other life domains varies
according to the scope of the life domain under consideration. Naturally, there is little spillover
effect in the case of overall life evaluations compared to the school-anchored domains since the
focal event directly involves the school and its students. This differential impact is evidence that
SWB for other life domains are able to maintain their integrity and usefulness despite the presence
of the focusing illusion in another life domain.
4. CONCLUSION
Analyses of two surveys established that college students experienced the focusing illusion in the
context of basketball championships involving their school. The trends ascertained by regression
analyses were found robust even controlling for the gender and year levels of respondents, their
assignment into the control or treatment groups, and the nested structure of the data.
That the focusing illusion biases subjective reports on well-being is well understood, and so it is
literature on the focusing illusion using data from a developing country. It is remarkable that the
evidence in this study is consistent with a recent Gallup study that lists Filipinos as among the
very emotional peoples in the world.15It is likewise remarkable—and, perhaps, the most important
contribution of the study to the literature—that not only are impacts of the focusing illusion on
the levels of SWB for the other life domains graduated but also they are conditional to the degree
of association between the focal event and the other life domains.
The findings of the study provide reinforcement to the recent initiatives of mainstreaming SWB
in public policy. There are, of course, valid apprehensions to such move. For instance, using SWB
in public policy might itself produce the focusing illusion—that is, the focus on SWB for public
policy brings about the focusing illusion thereby nullifying the usefulness of SWB as input to
public policy. Even so, the conclusion that not all life domains would be affected by the focusing
illusion in the same manner and degree indicates that a “wholesale” abandonment of SWB is not
warranted because the other life domains remain useful gauges of the impact of public policy. For
instance, if raising income produces the focusing illusion (Kahneman et al. 2006), then policy
makers can look into other measures that are related to income but not directly linked to income
(e.g., freedom to purchase goods with little trouble, ability to buy things that one likes, etc.).
Frequent review and evaluation of measures are needed in order to pre-empt the focusing illusion
from springing up in the other life domains. Other issues like direct and indirect manipulation of
SWB (c.f., Campbell 1976; Goodhard 1975) including the variations in the internal structure of
SWB as a consequence of public policy (c.f., Lucas 1976) are concerns that must be tackled head
on because they, too, threaten the usefulness of SWB as input to public policy. Evidence can be
developed more in future research; but, for now, their impacts can only be surmised to be similar
to that of the focusing illusion.
15
Thus, SWB is a valid and reliable construct that conveys useful information about the internal
state of a person. It is useful for analysis and valuable for applied work like public policy. It is not
a perfect measure; but, with proper application, it can be instrumental in making people and
REREFENCES
Buehler, R. and McFarland, C. (2001). Intensity bias in affective forecasting: The role of temporal
focus,Personality and Social Psychology Bulletin, 27(11): 1480-1493
Campbell, D. (1976). Assessing the impact of planned social change, Occasional Paper No. 8,
Social Research and Public Policies, Hanover, NH: Dartmouth College
Costa, P. and McCrae, R. (1988). Personality in adulthood: A six-year longitudinal study of
self-reports and spouse ratings on the NEO personality inventory, Journal of Personality and Social
Psychology, 54(4): 853-863
Diener, E. and Emmons, R. (1985). The independence of positive and negative affect, Journal of
Personality and Social Psychology, 47(5): 71-75
Diener, E. and Larsen, R. (1984). Temporal stability and cross-situational consistency of affective,
behavioral, and cognitive responses, Journal of Personal and Social Psychology, 47(4): 580-592
Dolan, P. and Metcalfe, R. (2010). ‘Oops. . .I did it again’: Repeated focusing effects in reports of
happiness,Journal of Economic Psychology, 31(4): 732-737
Dolan, P. and Powdthavee, N. (2011). Thinking about It: A note on attention and well-being
losses from unemployment,Applied Economics Letters, 19(4): 325-328
Eastwick, P., Finkel, E., Krishnamurti, T., and Loewenstein, G. (2008). Mispredicting distress
of Experimental Social Psychology, 44(3): 800-807
Gilbert, D. and Wilson, T (2000). Miswanting: Some problems in the forecasting of future
affective states, in J. Forgas (ed.), Thinking and feeling: The role of affect in social cognition(pp.
178-97), Cambridge: Cambridge University Press
Gilbert, D., Pinel, E., Wilson, T., and Blumberg, S. (1998). Immune neglect: A source of
durability bias in affective forecasting,Journal of Personality and Social Psychology, 75(3):
617-638
Goodhart, C. (1975). Monetary relationships: A new form of Threadneedle Street, Papers in
Monetary Economics No. 1, Sydney: Reserve Bank of Australia
Hooghe, M. (2012). I am happy, hope you’re happy too: Examining the different dynamics of
individual subjective well-being and view on society, Journal of Happiness Studies, 13(1): 17-29
Kahneman, D., Krueger, A., Schkade, D., Schwarz, N., and Stone, A. (2006). Would you be
happier if you were richer? A focusing illusion,Science, 312(5782): 1908-1910
Kermer, D., Driver-Linn, E., Wilson, T., and Gilbert, D. (2006). Loss aversion is an affective
forecasting error,Psychological Sciences, 17(8): 649-653
Loewenstein, G., O’Donoghue, T., and Rabin, M. (2003). Projection bias in predicting future
utility,Quarterly Journal of Economics, 118(4): 1209-248
The Phillips Curve and Labor Markets(pp. 19–46), New York, NY: North Holland.
Lucas, R., Diener, E., and Suh, E. (1996). “Discriminant validity of well-being measures,” Journal
of Personality and Social Psychology, 71(3): 616-628
Michalos, A. (1985). Multiple discrepancies theory, Social Indicators Research, 16(4): 347-413
Nakazato, N., Schimmack, U., and Oishi, S. (2011). Effect of changes in living conditions on
well-being: A prospective top-down bottom-up model, Social Indicators Research, 100(1): 115-135
Riis, J., Loewenstein, G., Baron, J., Jepson, C., Fajerlin, A., and Ubel, P. (2005). Ignorance of
hedonic adaptation to hemodialysis: A study using ecological momentary assessment,Journal of
Experimental Psychology: General, 134(1): 3-9
Schimmack, U., Diener, E., and Oishi, S. (2002). Life satisfaction is a momentary judgment and a
stable personality characteristic: The use of chronically accessible and stable sources,Journal of
Personality, 70(3): 345-384
Schkade, D. and Kahneman, D. (1998). Does living in California make people happy? A focusing
illusion in judgments of life satisfaction,Psychological Sciences, 9(5):340-346
Schwartz, N. and Clore, G. (1983). Mood attribution, judgments of well-being: Informative and
directive functions of affective states, Journal of Personality and Social Psychology, 45(3):
513-523
your life: Mood effects on judgments of satisfaction with life in general and with specific
domains,European Journal of Social Psychology, 17(1): 69-79
Smith, D., Sherriff, R., Damschroder, L., Loewenstein, G., and Ubel, P. (2006). Misremembering
colostomies? Former patients give lower utility ratings than do current patients, Health
Psychology, 25(6): 688-695
Strack, F., Martin, L., and Schwarz, N. (1988). Priming and communication: Social determinants
of information use in judgments of life satisfaction, European Journal of Social Psychology,
18(5): 429-442
Wilson, T. and Gilbert, D. (2003). Affective forecasting, in M. Zanna (ed.), Advances in
experimental social psychology(pp. 345-411), San Diego: Academic Press
Wilson, T. and Gilbert, D. (2008). Explaining away: A model of affective adaptation, Perspectives
on Psychological Science, 3(5): 370-386
Wilson, T. Wheatley, T., Meyers, J., Gilbert, D., and Axsom, D. (2000). Focalism: A source of
durability bias in affective forecasting, Journal of Personality and Social Psychology, 78(5):
821-836
Wirtz, D., Kruger, J., Scollon, C., Diener, E. (2003). What to do on Spring Break? The role of
predicted, on-line, and remembered experience in future choice, Psychological Science, 14(5):
Table 1
Means of reported well-being for win and lose scenarios
2001 Surveys 2012 Surveys
Scenarios, Z All Respondents Treatment Grp Control Grp
Win:
Round 1 (Before) 8.87 8.74 N.A.
Round 2 (After) 8.50 8.39 8.46
Round 3 (Follow up) 8.23 8.06 8.03
Lose:
Round 1 (Before) 2.36 2.34 N.A.
Round 2 (After) 2.70 2.78 2.92
Round 3 (Follow up) 3.01 3.26 3.34
Notes:
1. Lose scenario: the closer the number to five the more neutral is the reported well-being. Figures for the lose scenario can be recoded as (5 – self-reporti), thus the value
of zero actually corresponds to zero happiness.
2. For the 2011 and 2012 surveys, respectively, means indicated in each column are statistically different by row. For the 2012 surveys, means indicated in each row are not statistically different by column.
Table 2
Means of reported well-being for other domains
2012 Surveys
Life Domains, Y Treatment Grp Control Grp
Life-1:
Round 1 (Before) 7.75 N.A.
Round 2 (After) 7.84 7.91
Round 3 (Follow up) 7.81 7.96
Life-2:
Round 1 (Before) 7.41 N.A.
Round 2 (After) 7.51 7.58
Round 3 (Follow up) 7.48 7.66
Ateneo:
Round 1 (Before) 7.96
Round 2 (After) 7.91 8.07
Round 3 (Follow up) 7.91 8.00
Atenean:
Round 1 (Before) 7.48 N.A.
Round 2 (After) 7.46 7.36
Round 3 (Follow up) 7.49 7.30
Notes:
1. Means indicated in each column by life domain are statistically different by row. Means indicated in each row are likewise not statistically different by column.
Table 3A
Results of multilevel repeated model regressions, win scenario
Dependent variable: Life Domain
Coefficients Life-1 Life-2 Ateneo Atenean
Fixed Parameters:
φ20 (i.e., win) 0.116 0.146 0.226 0.368
(0.035)hs (0.039)hs (0.036)hs (0.041)hs
α3 (i.e., win◊time) 0.012 0.001 0.005 0.001
(0.018)ns (0.020)ns (0.019)ns (0.020)ns Random Parameters:
Repeated, t=0 0.562 0.802 0.573 0.777
(0.124)hs (0.167)hs (0.130)hs (0.157)hs
t=1 0.595 0.783 0.744 0.633
(0.060)hs (0.079)hs (0.069)hs (0.068)hs
t=2 0.294 0.582 0.450 0.293
(0.105)vs (0.128)hs (0.108)hs (0.107)vs
(1,1) between t 5.417 3.875 5.719 10.933
(1.583)hs (1.833)s (1.563)hs (2.035)hs
(2, 2) within t 0.124 0.056 0.080 0.166
(0.059)s (0.074)ns (0.059)ns (0.067)s (3, 1) between Z -0.531 -0.237 -0.477 -1.002
(0.186)vs (0.213)ns (0.175)vs (0.221)hs
(3, 3) within Z 0.061 0.019 0.045 0.102
(0.022)vs (0.025)ns (0.020)s (0.025)hs
Notes:
1. From Section 2, the specification is: Yti= φ00 + φ01Xi+ φ10timeti+ φ11(X◊time)i+ φ20Zti
+ α3(Z◊time)ti+ (e0i+e1itimeti + e2iZti+ εti).
2. hs = p < 0.001, vs = p < 0.01, s = p < 0.05, and n.s. = not statistically significant. Numbers in the parentheses are standard errors.
3. Table presents results for Z and Z◊time only. Results for Xs, time, and their interaction are not statistically significant (and are not reported in the table), except for the case of Atenean andφ01(X=Male)= 0.26 (p < 0.05)—that is, male students tend to report higher
SWBAteneancontrolling for reports for the win scenario. It may appear contrary to the
main results but, in closer inspection, it could point to a situation wherein male students are less expressive in terms of SWBwinbut such “suppression” manifests in SWBAtenean.
Table 3B
Results of multilevel repeated model regressions, lose scenario
Dependent variable: Life Domain
Coefficients Life-1 Life-2 Ateneo Atenean
Fixed Parameters:
φ20 (i.e., lose) 0.056 0.030 -0.022 -0.064
(0.260)s (0.029)ns (0.030)ns (0.029)s
α3 (i.e., lose◊time) -0.042 -0.025 -0.019 -0.036
(0.015)vs (0.017)ns (0.018)ns (0.017)s Random Parameters:
Repeated, t=0 0.566 0.858 1.237 0.863
(0.125)hs (0.173)hs (0.110)hs (0.175)hs
t=1 0.591 0.757 1.039 0.618
(0.059)hs (0.079)hs (0.073)hs (0.077)hs
t=2 0.315 0.563 0.533 0.429
(0.108)vs (0.132)hs (0.071)hs (0.129)hs
intercept 0.062
(0.006)hs
(1,1) between t 1.272 1.381 N.A. 1.789
(0.177)hs (0.214)hs (0.250)hs
(2, 2) within t 0.113 0.022 0.062 0.092
(0.061)ns (0.078)ns (0.006)hs (0.075)ns
(3, 1) between Z -0.127 -0.085 N.A. -0.026
(0.041)vs (0.044)s (0.041)ns
(3, 3) within Z 0.034 0.033 0.062 0.019
(0.013)vs (0.016)s (0.006)hs (0.016)ns
Notes:
1. From Section 2, the specification is: Yti= φ00 + φ01Xi+ φ10timeti+ φ11(X◊time)i+ φ20Zti
+ α3(Z◊time)ti+ (e0i+e1itimeti + e2iZti+ εti).
2. hs = p < 0.001, vs = p < 0.01, s = p < 0.05, and n.s. = not statistically significant. Numbers in the parentheses are standard errors. Results for covariance parameters of Ateneo are based on an identity covariance structure.