Munich Personal RePEc Archive
Less quality more costs: Does local
power sector reliability matter for
electricity intensity?
Bagayev, Igor and Najman, Boris
13 May 2013
Online at
https://mpra.ub.uni-muenchen.de/46943/
1
Less quality more costs:
Does local power sector reliability matter for electricity intensity?
Igor BAGAYEV1 (UPEC, TEPP) and Boris NAJMAN2 (UPEC, CES, CASE)
This version: May 2013
Abstract
The paper describes the main determinants of electricity intensity in twenty-nine transition economies. We provide an original analysis on the way the local power sector unreliability may affect the firm-level electricity intensity. The paper
explains the different firm’s behaviour, within EU and outside EU, in front of outages and/or local supply power quality. For this purpose, we use the Business Environment and Enterprise Performance Survey (BEEPS) done in 2008-2009 over 2400 enterprises. Moreover, we built an innovative measure of the electricity supply quality at the local-level inspired by the previous work of Guiso et al. (2004). Our results indicate that in non-EU (or insufficiently reformed) countries power
sector unreliability increases firm’s electricity intensity. We estimated a potential
reduction of one-fifth of firm’s electricity intensity associated with an improvement from the 75th percentile to the 25th percentile of the distribution of the local power sector unreliability. Our results suggest that bad quality of the local power sector seems to dampen the firms’ ability to decreases their electricity consumption, if the
country’s institutional framework is poor.
J.E.L.:P28, Q4, R34
Key-words: electricity intensity, local power sector, electric power reforms, transition economies
1 INTRODUCTION
The energy intensity is the crucial question for the next decades. The achievement of a sustainable economic growth places at the heart of policy agendas the issue of energy
1 igor.bagayev@univ-paris-est.fr 2 najman@u-pec.fr
We want to thank Richard Pomfret and Gael Raballand, for their first remarks and encouragements, and Pierre Blanchard for his econometric advices. We present a first version of
the paper at the International Conference on “Environment and Natural Resources Management
2
use. And an appropriate use of electricity should not be exerted from an overall sobriety effort. First, because of high economic and environmental costs associated with the power generation, and second, because of energy security concerns, especially for net importers of raw materials needed to electricity production (fuel, gas, coal). This issue is all the more important in the case of the countries of Central and South East Europe (CSE) and the Commonwealth of Independent States (CIS). An inefficient use of electricity is a legacy of the Soviet Union (Engoian, 2005). Based on low utilities prices and large capacities in the power sector, the planned economy encouraged high level of electricity consumption. The structure of the economic activity is thus biased towards energy and electricity intensive sectors. Enterprises experience large electricity consumption due partly to technology backwards, worn plant and machinery, but also behaviour inherited from planned economy. An active energy efficiency policies should be considered as a priority for their policymakers, not only for environmental and health priorities, but also for the competitiveness of firms.
In the former command-driven economies poor energy regulatory policies and decades of power sector subsidies has failed to stem the power assets deterioration and resulted in over-sized energy intensive sectors. This involved a particular pattern of transition economies: high level of energy intensities are coupled with low power sector performances. This is basically highlighted by the macro-level evidence (see section 3) and was often documented in international organization reports (see EBRD, 2009) and some academic papers (see Jamasb and Nepal, 2012).
The main objective of the present work is to test whether we observe this kind of evidence at the firm-level. And thus provide a crucial argument in favour of deepen power sector reforming in the Former Soviet Union (FSU) and South East European (SEE) countries. Indeed, if higher firm electricity intensity is related to a lower quality of the power sector, implementing an appropriate power reform path brings a win-win situation. That is improving power sector (financial, technical and commercial) performances goes hand in hand with decreasing firms’ electricity expenses.
More precisely, we want to test the relation between the reliability of the local electricity supply and firm electricity intensity. We assume that regional electric power sector improvements should lower the firm-level power consumption. At first, because
degraded power utilities sector is the result of power companies’ bad demand-side
management. Indeed, power companies need to implement necessary actions to change the firm electricity consumption behaviours inherited from the planned economy. Regions where the quality of the electricity supply is lower are those least able to deal with such problems as tariffs beyond the marginal cost, invoices, theft and rubbery, weak metric system or contracts favouring intensive consumers. Secondly, because power
3
electricity-conserving investments3. Bad quality of the local power utilities, insufficient
information as well as low expectations of power price increase thus prevent firms from engaging long-term and potentially costly investments.
We measure the quality of local power sector using subjective and objective questions from the BEEPS questionnaire. This survey collects information on firm characteristics and their business environment on twenty-nine countries of Eastern Europe and Central Asia. Our subjective measure of the local quality of the electricity supply is based on the normalized coefficients of the regional dummies in an estimation of firms’ self-declared obstacle represented by the electricity sector (see sub-section 5.2.1 for details). We expect this indicator to catch the different components of the electricity supply quality. Furthermore, in order to take into account for the potential endogeneity bias of this measure, we compute an objective assessment of the reliability of the power sector at the regional level. This alternative indicator is based on the average number of outages declared by firms in each region during the last round of the survey (2007-2009). It allows us to control for one particular aspect of the quality of electricity supply, i.e. the continuity of supply, computed through the number of interruptions.
We first assume that all firms follow the same electricity consumption pattern. In a second stage we present our results for EU and non-EU enterprises. We divide our sample in two subsamples (EU and EU firms) and test also for reformed and non-reformed electricity power supply countries. We assume that firms from EU (or
reformed country) vs. non-EU countries react differently to electricity supply problems.
After 15 years of EU integration process (1994-2008), reforms in the electricity sector impact the firm electricity consumption. EU pushes the 12 transition economies candidates (1994) and than new members (2004-07) to reform substantially their electric power sector (see sub-section 3.2). On the opposite, in non EU countries, the over investment in the electricity power supply during the communist period was not reorganized and still create over capacities. Hence no policies were implemented indoor to promote less electric intensive productions.
The existing literature in these countries focuses on the energy intensity patterns at the macro-level (Cornillie and Fankhauser, 2004) or on the effectiveness of power sector reforms to improve electricity outputs (Jamasb et al. (2005); Zhang et al. (2008); Jamasb and Nepal, (2012)). Still, there is no study on the micro-level determinants of electricity intensity, neither on the way the reliability of the power sector is related to the firm’s electricity end-use consumption. We try to fill a part of this gap.
We aim at providing evidence that, in the case of the transition economies, a bad quality of the local power sector goes hand in hand with higher firm-level electricity
4
intensity. Thus, we also aim to rely on the evidence highlighted by the literature related to power sector reforms. Papers focusing on the impact of market-oriented power sector reforms found it difficult to establish that reforms had a positive effect on power generation capacities but could have a beneficial effect on sector’s productivity and capacity use (Zhang et al. (2008); Jamasb and Nepal (2012)). For the special case of transition economies, this result could be at least partly explained by a better end-use of electricity implied by restructuring of the old power system. In many of these countries, reforming bring a better use of the existing generation capacities, with an upgrading of the provided service. Improved reliability of the power sector can imply higher electricity
prices, demand-side management of the consumption and making firm’s electricity
efficiency investments more profitable. Our findings thus underline the necessity for the countries where electricity sector reforms are less implemented to go deeper in the reforming process.
We use an innovative two-steps approach in order to measure the quality of the local electricity sector in twenty-nine transition economies. We adapt the approach developed by Guiso et al. (2004) who assess the development of the local financial markets in different Italian regions. They estimate regional financial development indicators by adding regional dummies in the individual subjective assessments of financial obstacle. Ranking those regional dummies allows having a good proxy for regional financial development. To our knowledge, we are the first to introduce this approach outside of the financial markets development concerns. In order to take into account for the quality of the electricity sector, we compute a regional indicator reflecting local electric sector underdevelopment. The methodological approach of Guiso et al. (2004) seems to be particularly fitting for the structure of the electricity sector. Indeed, inside each country, we can expect a large variation of the quality of the electricity service depending of the local development of the electricity market and infrastructures.
5
This paper is organized as follows. Next section presents the main contributions of the literature as regarding our empirical question. Section 3 addresses an overall overview of the electricity sector in our sample of countries and provides the evolutions of their power sector reforms. In section 4, we present and discuss the data and the empirical strategy. Section 5 discusses in detail our econometric results and finally section 5 concludes and presents the policy recommendations.
2 LITTERATURE REVIEW
This paper is at the crossroads of two literatures: the literature on energy intensity and its micro-level determinants and the literature on the specificities of the electricity distribution utilities and power sector reforms in the former communist countries of Europe and Central Asia. However, to our knowledge there are no papers focusing on the firm-level electricity intensity in the case of transition countries. By contrast, a growing literature examine how firm level characteristics (Fisher-Vanden et al. (2004); Bloom et al. (2010); Martin et al. (2012); Morikawa (2012)) or some economic barriers (DeCagnio (1998); Brown (2001); Trianni and Cagno (2012)) are related to the energy intensity of firms in several developed countries. We focus our attention to the first set of papers, which is closer to our empirical strategy.
Fisher-Vanden et al. (2004) uses a structural model of a Cobb-Douglas cost function for the functional form of their estimation to identify drivers determining the decrease in energy intensity of 2500 medium and large-sized Chinese industrial firms. From a cost minimization program, they derive the firm-level factor demand for energy. They have found that changes in relative energy prices and R&D expenditures are the main contributors to the decline in firm-level energy intensity. To a lesser extent, shifts in output across industry, in ownership and region have contributed to the variation in energy intensity.
The paper of Morikawa (2012) brings another insight about the firms’ energy intensity and disentangles the role played by some regional characteristics. In particular, the author underlies a positive relationship between population density and the energy efficiency consumption in service enterprises. When the population density of the locality doubles, the author estimates a 12% decrease of firm-level energy intensity in services sector. He also emphasizes a negative link between capital and labour intensities and energy efficiency. We try to take into account for this potential effect by adding locality size dummies in our empirical estimations.
6
related to the firm’s productivity. Better-managed firms adopt modern and energy-efficient measures, which increase their productivity. The authors estimate that an improvement from the bottom to the top quartile of their management variable is associated with a 17% increase in energy efficiency. The paper of Martin et al. (2012) provides further evidence about the negative link between management practices and
energy intensity. They argue that better management is also related to the firm’s energy
efficiency innovations (process and product). Moreover, they provide another finding about the role played by organizational structure. Firms where energy issues are devoted to the environmental manager (when such a position exists) have more climate-friendly management practices. As regarding the issues of our paper and the used dataset, our empirical approach is inspired by the works of Bloom et al. (2010) and Martin et al. (2012).
Another strand of the literature tries to assess the impact of power sector reforms
and restructuring on the performances of the electricity sector4. Zhang et al. (2008) look
at the performances gains related to privatization, competition and regulation reforms in the electricity sector in a set of transition and developing countries. They do not observe obvious productivity or generation gains related to privatization or regulation reforms, but emphasize a positive and significant effects related to competition reforms. The paper of Jamasb and Nepal (2012) bring new insights of the market-oriented power reforms patterns across the transition countries since 1990. They argue that the impact of power sector reforms on power sector, economic and environmental outcomes depend on the implementation of wider institutional reforms. Using panel data econometrics, they highlight several interesting results. In particular, it seems that the power sector reforms have no significant effect on per capita generation installed capacity. Whereas the impact is negative on per capita transmission and distribution losses. The effect seems to be all the more important when the power reforms are implemented along with a more liberalized economy. These results confirm the idea that the countries in the former Soviet bloc inherited of excessive generation capacities. Implementing market-oriented power reforms seemed to enhance the quality of the distribution system and allows a better use of the existing generation capacities. The results of our firm-level estimations support these findings. Our paper provides an original analysis on the way the firm’s electricity intensity could be related to the quality of the local power sector in the countries of the former Soviet bloc. Appropriate electricity sector reforms can thus improve the quality of the power distribution utilities while also accompanying the firm-level electricity intensity decrease.
In the next section, we set the contextual background which provides some arguments to our empirical assumptions.
7
3 CONTEXTUAL BACKGROUND
In this section we try to present the main mechanisms which can explain a negative link between firm-level electricity intensity and the quality of the local power sector. First, we briefly describe the scheme of the involved mechanisms. Then, we present the macroeconomic background explaining the relationship between electricity intensity, the quality of the electricity systems and reforms of the power sector (sub-section 3.1) and how far the EU electricity reform model (sub-section 3.2) was implemented in our sample of countries (sub-section 3.3).
During the pre-transition period, overinvestment was predominant in the power sector. The electricity system in most countries in transition were heavily subsidized and centralized. They were designed to favour and promote heavy industry, provide universal access for the population and were characterized by reasonably acceptable service quality. But their financial performance was poor because they were not designed for efficiency, either in power production or end use. The cost-plus pricing gives no incentive to cut waste or remove inefficient technologies. Rigid price controls depress profits and discourage new investment. The problem is particularly shape in the former Soviet Union (FSU) countries, since the infrastructure was developed on non-market principles since a longer time period. As the countries began transitioning to a market economy, the design of these electricity distribution utilities often became financially unsustainable. The power assets are working significantly beyond their intended life spans. Finally, high total losses and poor collection rates, due to weak metering, billing and payment collection accounted for the companies’ financial distress. Yet, not all the countries implemented the necessary set of reforms in order to restructure the power sector and make it efficient. Starting in the 1990s, most EU accession countries and few FSU countries have successfully privatized their distribution companies. However, the financial situation remains almost unchanged and the financial performance of power sector enterprises is poor in most of the countries in the former Soviet bloc (World Bank, 2010).
8
[image:9.522.90.493.178.611.2]appropriate incentives to rationalize the electricity consumption of the power end-users. At the contrary, insufficiently reformed power sectors lead to the depletion of the overall reliability of the sector whereas maintain high level of end-use inefficiency and disallows individual energy saving investments. The macroeconomic facts presented below (sub-sections 3.1, 3.2 and 3.3) illustrate this scheme.
Figure 1: Linkage mechanism between electric power unreliability and firm electricity intensity
Unreformed power sector: High commercial losses, low
prices and subsidies
Reformed power sector: Demand-side management
and high prices
Incentives for energy saving investments and technologies,
new deals between electric suppliers and consumers
EU countries Non-EU countries
No market or out-of-market incentives for energy saving investments and technologies Electric power outages and
low supply quality
Unstable and unpredictable production process
Poor financial sustainability, obsolete
power sector assets
Capital and labor hoarding Electricity over consumption
9
3.1 Power Sector Unreliability and Electricity Intensity: a macro perspective
[image:10.522.86.423.172.410.2]We present, first, the electricity intensity data from 1990 to 2009 (World Development Indicators, World Bank). The figure 2 shows the results for three groups of countries over the region: EU new members, CIS and Mongolia group, and countries from South Eastern Europe. The list of countries is displayed in the appendix (see tables 9 and 10).
Figure 2: Electricity intensity during the period 1990-2009
Notes: The electricity intensity is expressed as the electric power consumption in Kwh per constant 2000 US$ (log). Tajikistan & Kyrgyz Republic are excluded; FYR Macedonia & Montenegro are missing due to data unavailability.
Sources: WDI, World Bank, authors’ calculations
The evolutions in the figure 2 are pretty consistent with the global trends –
convergence– in those economies. Comparing to the rest of the region, the EU new members group has the lower electricity intensity. But in recent years, since 2007, we can see a stabilization of the electricity intensity evolution. The EU new members are converging with one clear outlier: Bulgaria. Bulgaria, and, to a lesser extent, Romania and Czech Republic, have not improved so quickly their electricity efficiency (see figure 7 in the appendix). Possible reasons are the lack of foreign investment, but also the delay in implementing reforms in the electricity sector (see next sub-section). An additional reason may be the development of the unrecorded economy, which is using electricity without declaring any output (Kaufmann and Kaliberda, 1996).
South East European countries did not experience the same convergence as EU countries. The main reason is probably the wars in former Yugoslavia (1991-1999). Serbia is a clear example of war outliers. The war period had created unrecorded
0 1 2 3 4
El
ec
tric
ity
in
ten
sity
1990 1995 2000 2005 2010
Year
CIS+Mongolia EU new members
10
economy, electricity smuggling and enormous efficiency losses. In 2009, Serbia is still one of the less efficient countries in our sample, due to its implication in three different conflicts between 1991and 1999 (see figure 7 in the appendix).
Finally, CIS countries are by far the less efficient countries among transition economies. As in SEE, the countries with an experience of war have the worse results
(i.e. Tajikistan). But the first period of transition (1990-96) was also, for those economies,
a shock in terms of electricity intensity. Most of the countries have only improved their
situation after 1995. It can be noted that there are two outliers – Tajikistan and the
Kyrgyz Republic – with electricity intensity up to nine times higher than some CIS
countries.
[image:11.522.72.378.361.577.2]Overall, at the end of the period, we observe for all the groups a slow-down or a little increase (for SEE) of the power intensity, whereas all these countries are still far from the average level of electricity consumption intensity of OECD members. We can also notice a break in 1994-1995 of the evolution of electricity intensity and economic growth in the whole region. In 2009, the less electricity intensive country (Slovenia) in our sample, has still consumed more electricity in order to produce one dollar of production, compare to the average of OECD countries (see figure 7 in the appendix).
Figure 3: Electricity intensity and power losses across transition countries, from 1990 until 2010
Notes: The electricity intensity is expressed as the electric power consumption in Kwh per constant 2000 US$ (log). The electric power transmission and distribution losses are expressed in percent of output (log). Tajikistan and Albania are considered as outliers so they are excluded. Sources: WDI, authors’ calculations.
Based on cross-country data, we can see in figure 3, that better quality of the electric power sector is associated with lower electricity intensity. The figure 3 plots country level
-1
0
1
2
1 2 3 4
11
[image:12.522.73.407.221.463.2]scatter plot of the log of electricity intensity against the log of electric power distribution and transmission losses (% of output) from 1900 until 2010, across 29 transition countries. We can notice a significant positive correlation. This relationship suggests that an enhancement of the power sector performances in these countries was positively related with a decreasing use of power energy to produce each unit of GDP. Of course a number of neglected variables at the country level may induce a potentially misleading correlation. That is why it is important to study this correlation more carefully at the firm-level, taking the country-wide variation fixed (see section 5 below).
Figure 4: Electric power losses & the index of power sector reform across transition countries, in 2008
Notes: Horizontal axis reports the countries displayed by level of power sector reform index (EBRD) in 2008, with the lower values at the right of the graph. Vertical axis reports the electric power transmission and distribution losses, expressed in percent of output. Missing data for Czech Republic.
Sources: EBRD, WDI, authors’ calculations.
Our main argument is related to the fact that market-oriented power sector reforms aim at increasing the reliability of the power sector and decreasing the initial distortions in the power consumption. Thus, figure 4 plots the level of power distribution and transmission losses in different countries of our sample. As we can notice, the countries
with an index of electric power reforms lower or equal to three5, report the higher level
(and variation) of losses in the power sector in 2008.
5 The EBRD’s indicator of electric power reform catches the extent of market-oriented reforms implemented in the power sector in post-soviet area. In each country, the electric power reform
High power sector reform indicator Low power sector reform indicator
12
The cross-country differences of the electricity sector performance can basically be explained by the implement of the reform path proposed by the EU. The countries who adopted these reforms are those displaying the higher performances of their electric power sector (on the left of the figure).
3.2 EU Electricity Reform Model
The EU electric power sector reform framework is based on four main points: the creation of an independent sector regulator, legal unbundling of transmission and distribution businesses, reduced entry barriers and market opening to competition for all customers. The theoretical paradigm of this reform model is thus largely inspired by the Single Market agenda: efficient regulation of limited natural monopolies and increased competition within the different vertically related stages of production (Politt, 2009). As suggested by the theories of regulation (Joscow, 2007), the natural monopoly prerogatives are essential, but must be regulated through an independent and unpowered control agency. Increased number of firms and reduced entry barriers are also needed in order to deepen competition within the stages of production.
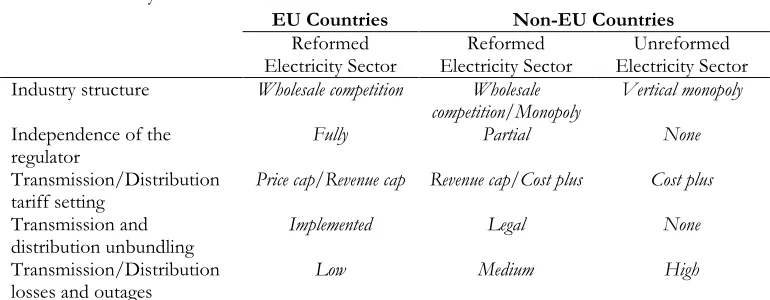
[image:13.522.69.454.362.512.2]The main characteristics of the EU electricity reform model and its post-soviet inherited counterpart is summarized in the table 1.
Table 1: Electricity market framework for EU and non-EU countries
EU Countries Non-EU Countries
Reformed Electricity Sector
Reformed Electricity Sector
Unreformed Electricity Sector Industry structure Wholesale competition Wholesale
competition/Monopoly
Vertical monopoly
Independence of the regulator
Fully Partial None
Transmission/Distribution tariff setting
Price cap/Revenue cap Revenue cap/Cost plus Cost plus
Transmission and distribution unbundling
Implemented Legal None
Transmission/Distribution losses and outages
Low Medium High
Notes: Based on the Transition Report (EBRD, 2009) and works of Pollitt (2009) and World Bank (2010).
13
3.3 Power Sector Reform Changes in Transition Economies
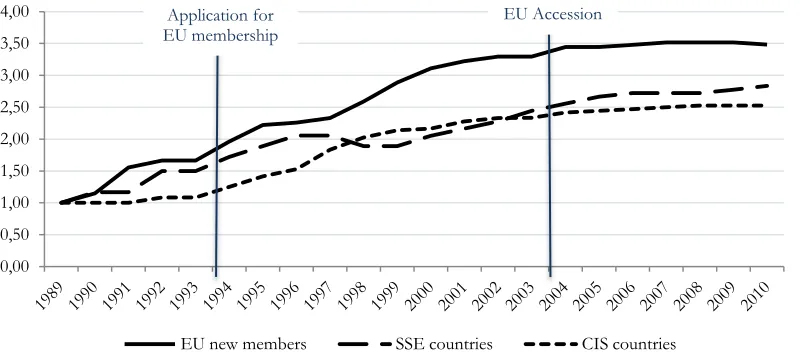
Figure 5 presents the evolution of electric power reforms in transition economies.The
EU countries (see table 9 in the appendix for the list of countries) do have the best
results mainly due to the acquis communautaire regulations. However some countries may
experience a reverse reform process, for example Hungary or Estonia. Most of the improvements have been done in the period between the application to EU (1994) and the accession (2004-07).
On the contrary, in South East Europe, the evolution of reforms was unstable, due to the wars (1991-1999) in the former Yugoslavia. Many reforms were delayed by five or even ten years. The electricity market is still not very transparent in the region, and this probably impacts the electricity cost for the enterprises.
[image:14.522.78.478.343.523.2]As we can see, countries in the CIS region have experienced very different reform path. Most of the Central Asia and South CIS countries have delayed their reforms in the electricity sector compared to Russia, and Ukraine. However, we observe some backward policies in the region.
Figure 5: Index of electric power reform in transition countries
Notes: Missing data for Czech Republic and Kosovo.
Sources: EBRD 2012, Transition indicators, authors’ calculations.
With inadequate incentives to consumers and inability to reinforce the bill payments, the lack of reforms in the power sector favours the development or the maintaining of high level of energy consumption by firms. While maintaining high level of firms’ electricity consumption, insufficiently implemented reforms can harbour the power sector from improving its financial performances. As the generation capacities of power utilities were implemented out of the profitability concerns, we should observe that
0,00 0,50 1,00 1,50 2,00 2,50 3,00 3,50 4,00
EU new members SSE countries CIS countries
Application for EU membership
14
regions where the power sector is the less reliable are also those where the firms’ electricity intensity is the higher.
By using the quality of the electricity service at the local level in our regressions, we will try to test whether we observe in some countries of this region a post-soviet trouble related to the power energy use. We will try to see if the local power sectors characterized by a lower reliability of the provided electricity supply are those unable to rationalize the firm-level power consumption.
4 DATA, DESCRIPTIVE STATISTICS AND EMPIRICAL STRATEGY
4.1 Data
The data presented in the following two sections provide from the Business Environment and Enterprise Performance Survey (BEEPS). The European Bank for Reconstruction and Development and the World Bank create the BEEPS on a representative sample of private sector firms in twenty-nine countries from Central Europe to Central Asia (for the last round of the BEEPS, in 2008-2009). The survey covers a large set of topics, including corruption, access to finance, crime, justice and some firm performances measures. Thus, the objective of the BEEPS is to collect firm-level information in order to assess the influence of enterprise’s characteristics and several institutional factors on firm behaviours and performances. There were four rounds of survey undertaken since 1999-2000, over a sample of 4000 to around 12000 firms in 2008-2009. There are a relatively small proportion of observations allowing us to build real panel data, especially concerning our research question. Indeed, we are constrained to use only the last round of the survey, which includes questions concerning firm’s electricity expenses. But all the rounds contain information about regions where firms are located, which will be of use to build our indicator of local power supply reliability.
To build the firm-level electricity intensity variable we have used two questions. The first one concerning the firm’s electricity consumption: “For fiscal year 2007, please provide the following information about this establishment: total annual costs of electricity”. The second question concerns the sales turnover: “In fiscal year 2007, what where this establishment’s total annual sales?”6 These two questions allow us to
construct our dependent variable as the ratio of electricity expenses over total sales during the year 2007 (see table 11 in the appendix for detailed description of variables). Before analysing econometrically the determinants of firms’ electricity intensity, it is informative to look at the raw distribution of our dependent variable as regarding some firm characteristics.
15
4.2 Descriptive Statistics
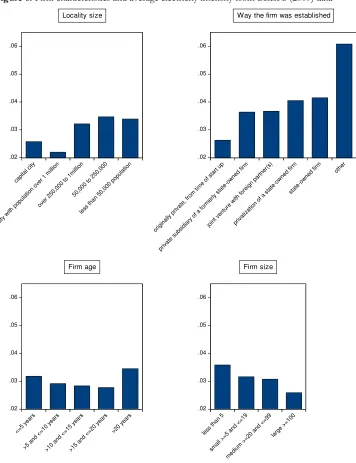
Figure 6 shows the average distribution of firm electricity intensities conditional to the locality size, the number of employees, the firm age and the way the firm was established. We include these controls in our econometrical analysis.
[image:16.522.77.433.209.672.2]As we can see in small cities, the use of electricity is rather inefficient compare to big cities. Transition appears to be more “successful” in large cities, where also probably technologies and electric sector are more developed.
Figure 6: Firm characteristics and average electricity intensity from BEEPS (2009) data
Sources: BEEPS survey, 2009, EBRD, authors’ calculations
.02 .03 .04 .05 .06 capi tal c
ity city with popu lation over 1 m
illio n
over 250,
000 to 1m
illion
50, 000
to 250, 000
less tha
n 50, 000 popu lation Locality size .02 .03 .04 .05 .06 originall y pr
ivat e, from
tim e of
start up
privat e subs
idiary of a
form erly stat e-o wned firm joint vent ure with fore ign par
tner (s)
privat izat
ion of a
stat e-o wned firm stat e-ow ned firm other Way the firm was established
.02 .03 .04 .05 .06 <=5 year s >5 and <=10 year s >10 and <=15 year s >15 and <=20 year s >20 year s Firm age .02 .03 .04 .05 .06 less tha
n 5
16
We can also notice that private de novo firmsare on average by far the more electricity
efficient. As expected state-owned and formerly state-owned firms are the more electricity intensive, due probably to a weaken budget constraint and remaining consumption behaviours from the planned economy system. The privatization of state-owned firms did not seem to decrease their electricity cost intensity.
Following the figure, the enterprise’s age affects intensity in two different ways. We observe that the more energy intensive firms are at the extremes of the age distribution. Enterprises created before the USSR collapse (more than twenty years ago) are more electricity intensive maybe due to their overall specialization in energy intensive sectors, and also because of inherited obsolete processes and technologies. In the other side, the younger firms are also more electricity intensive, probably because of a scale effect accompanying a smaller size on average of younger companies. Between those two extremes, firms seem to be more electricity efficient without real gaps across the groups.
Finally the power energy intensity is negatively correlated with firms’ size. Large enterprises tend to be more efficient in their use of electricity. Benefitting of economies of scale, large firms are more able to implement new technologies and increase their overall productivity.
4.3 Empirical Strategy
To investigate the determinants of firms’ electricity intensity and assess specific effects of power sector and financial constraints, we consider the following econometrical specification:
(1)
where electricity intensity = electricity expenditure over total sales, Y = total sales, L =
labour (number of employees), K = capital (net book value of machinery, vehicles,
equipment, land and buildings). Lower case letters indicate natural logarithms, for
example y = ln(Y). Z is a vector of control variables that could affect electricity intensity,
i.e. a set of firms’ characteristics (age, share of employees with university degree, ratio of current annual sales to annual sales three years ago, way the firm was established) and a proxy for population density (dummy variable for the size of the locality). The estimation
also includes 2-digit industry dummies and country dummies respectively indexed by j
and c.
The detailed description of variables is given in the appendix (see table 11).
17
Our specification is based on the approach adopted in the energy related literature7.
Nevertheless, from our electricity cost share equation a number of concerns might arise.
Because in the BEEPS dataset we do not have firm specific prices, our dependent variable captures both variations in quantities and prices. Electricity intensive firms might be able to charge higher prices for their products and thus reducing the electricity cost share, as expressed above. In order to take into account such a mark-up effect, we use an alternative measure of electricity intensity, the electricity expenditures over variable costs (total cost of labour, intermediates, fuel, power and other utilities) as the dependent variable.
Second, to ensure that our results are not driven by the choice of variables used in our basic specification we repeat our regressions with an alternative specification. The main justification for using the cost share equation (1) is that such a specification is in line with the usual translog factor demand equation (Christensen et al. (1971)). But, we also try to test our results with another econometrical specification, including a proxy for
wage and investment measures instead of labour and capital variables. Using this 2nd
specification does not change fundamentally our main findings.
In the following section, we present our first regression’s results and we discuss and comment them.
5 RESULTS
We organise the econometric analysis in the following way: first we present a simple specification with and without a management variable (5.1), then we describe and include our indicator of the power sector quality at the local level (5.2), and finally we present the results for the two samples of EU and non-EU members (5.3). In the last sub-section we run some sensitivity analysis in order to test the robustness of our findings.
(5.4)8.
5.1 Preliminary Regression’s Results (see table 1)
We have more than 2200 observations on the enterprise level. We use two different measures of electricity intensity. We can control for sectors and countries specific effects. The results are similar for the electricity intensity and the share of electricity cost. In both specifications we include progressively the control variables (firm characteristics, settlement size and type of ownership) to check for the stability of the coefficients and
7Bloom, Genakos, Martin & Sadun (2010); Morikawa (2012); Martin, Muûls, Preux & Wagner
(2011).
18
reliability of our regressions. For all the specifications the coefficients are very stable and remain significant.
We found out that the enterprise number of employees does significantly increase the electricity intensity. The number of employees is significant and increases the intensity. Furthermore, the amount of capital tends to increase the intensity. Capital and labour seems not to be used in order to produce at lower energy costs. It seems that more labour and capital intensive firms require more electricity intensive. Similar relationships were find by Bloom et al. (2010) and Morikawa (2012) between energy intensity, capital and labour variables. Those results also echo the empirical evidence of Berndt and Wood (1975) among others. They found that energy and capital are complementary and that energy and labour are weakly separable. This last point implies that more employment
also needs more energy consumption9.
The age of the firm does not have any statistical significance once we introduce the privatization dummies. In fact privatization includes part of the firm age effect. There is also probably a non-linear effect of age on the energy intensity (see figure 6).
A more optimistic result is provided by the sales: larger sales tend to increase the intensity. We are probably capturing some economies of scale. In addition, the performance of the firm in terms of actual sales compared to three years ago seems to reduce the intensity. Higher sales may reflect a higher demand for the firm production. On short term, the easier way to address this demand is to use more intensively the available capital stock and labour increasing the energy consumption.
Originally, private firms (de novo) are less spending on electricity per unit sold. This
finding is strong, significant and stable over all of our estimations. This result echoes
previous literature treating of the effect of de novo privatization on different variables of
firm’s performances like growth, productivity, innovation, etc. (Fisher and Sahay, 2000). The enterprise performance, in terms of sales, tends to decrease the electricity consumption.
Our paper contributes to the discussion on the management quality and allocation of resources; we do not find any significant effect of the management on the electricity intensity. This result might differ from the previous studies of Bloom et al. (2010) and
Martin et al. (2011) because of our proxy of management quality10.
9 There has been extensive research on the substitutability or complementarities between energy and other inputs. Unfortunately, our database limitations do not allow us to strongly relate our findings to this literature. Indeed, we are unable to deal properly with the issue of elasticity between energy and other production factors because we lack input prices information and time-series data.
19
All our results remain stable with or without Russia; this robustness check is important since Russia is a much larger country compared to others in our sample. The results remain also stable without the enterprises from the services sector.
5.2 Indicator of Local Power Sector Unreliability
The energy intensity related literature (Cornillie and Fankhauser, 2004) highlights the role played by the electricity sector in maintaining high levels of energy consumption in Transition economies. In the same way, the EBRD 2011 special report argues that power sector underdevelopment is one of the main drivers explaining electricity inefficiency in this region, especially in former Soviet Union countries. Indeed, insufficient reforms and underinvestment in the electricity sector could lead to the deterioration of the electric power supply. In this case, low electricity price goes hand in hand with low quality of the provided service, involving disruptions, inadequate quality and bureaucratic disturbances.
The quality of the power sector supply can be divided into three components: continuity of supply, voltage disturbances and commercial quality (CEER, 2011). The
continuity of supply refers to the availability of electricity without interruptions –or
outages (programmed or not). The availability of electricity supply thus affects end-user consumers through the number and the duration of power supply interruptions. The voltage disturbances represent the adequacy of the technical properties of the supplied electricity and its usefulness for consumers. It is basically related to the distortions of voltage properties of the supplied electricity from their nominal values (frequency, magnitude, wave shape, etc.). The voltage quality impacts on the electricity appliances and processes. And it is all the more important for the industrial sector, where proper functioning of machines and processes may be severely affected (damages, reduced efficiency, breakdowns or even inability to operate). The commercial quality aspect is related to the capacity and the speed of the power companies to handle with the consumer requests. It concerns such services as repairing quality voltage problems and meter verification as well as new connections or adjustment of the connection capacity. We can also point out the availability of voltage quality in line with the end-user requests.
Unfortunately we do not have access to first hand information indicating the quality of the local power sector for the whole span of countries. Still, in order to estimate an indicator of power sector quality at the local level we can use information contained in the BEEPS (EBRD) surveys. Indeed, those surveys were undertaken in order to assess the business environment in the countries of the former Soviet bloc. Thus, one of the sections of the BEEPS aims to evaluate the electricity access and reliability faced by firms. In particular, the BEEPS ask firms whether electricity is an obstacle for their current operations.
20
quality of electricity supply faced by firms, we compute a regional indicator reflecting local electric power unreliability. Regions where the power sector is less reliable are those
where, ceteris paribus, the declared obstacle in electricity is the higher.
However, if inside each region the electricity intensive firms are not normally distributed, we still might face to the problem of endogeneity. That is why we also use an objective measure of the quality of the electricity sector. For doing so, we compute, from the last round of the BEEPS survey, the average number of power outages at the regional level. This variable is thus based on the number of outages reported by each firm of the survey listed in the same region. In this way, this second indicator serves as robustness check for our results, because it should not depend, at least positively, on the firm-level electricity intensity.
Using an indicator of regional variation of the power sector quality instead of individual measure seems to be particularly fitting for the structure of the electricity sector. Indeed, we can expect in a given region all the end-use consumers to face the same electric network and the same power generation plants. Inside each country we can expect a large variation of the quality of the electricity service depending of the local development of the electricity market and infrastructures.
We follow a two step procedure in order to assess the indicator of local electric power sector reliability. Our approach is inspired by the paper of Guiso et al. (2004). Distinguishing differences in financial development between different regions of Italy, their paper highlights the positive impact of the development of local financial markets on several microeconomic variables (competition, entry of new firms, growth). This approach computes regional financial development scores by adding region dummies in the estimation of individual subjective assessment of the extent of financial access. Ranking those regional dummies allows having a good proxy for regional financial development. This method has been used by Villegas-Sanchez (2008) to highlight the role of local financial markets in externalities conveyed by the FDI.
To catch up the regional power sector unreliability, we compute the probability that electricity is a major obstacle to the current operations of a firm. This first estimation is done using pooled cross-sectional data from the last three rounds of the BEEPS (2002, 2005 and 2009). The information contained in this kind of dependent variable is a patchwork of diverse failures and/or malfunctions in the local power sector. It can be related to inadequate or insufficient power energy supply as well some “governance” shortcomings, as bureaucratic failures or corruption. Thus, we believe that this variable contains an individual subjective measure of local power sector reliability.
5.2.1 Methodology
21
(2)
where “Electricity obstacle” is a dummy variable denoting an obstacle reported by firm i in electricity sector. This dummy equals to 1 if a firm reports that electricity is a “very severe” or a “major” obstacle to its current operations, and 0 otherwise (“no”, “minor” or “moderate” obstacle)11. X is a vector of firm specific attributes that might explain the
enterprise’s underlying response to the electricity obstacle. In the equation (2) we also
include year and 2-digit industrydummies respectively indexed by t and j. That allows us
to control for unobserved year-specific12 and industry-specific factors that impact on the
dependent variable.
Our variable of interest is “Region”. Indeed, the measure of local power sector
unreliability will be the ranking provided by the coefficients γ of the regional dummies k.
The Imereti region in Georgia provides the higher coefficient of electricity obstacle (see sub-section 5.2.2), thus indicating the worth power sector reliability throughout our sample and according to our indicator. As a consequence, we set this region as the reference region in our estimation (table 2). Comparing to Imereti the coefficients of all other regions should display a negative sign. In this way, the minimum regional coefficient should indicate the higher quality of the local power sector. For ease of interpretation, we transform our regional coefficients into indicator varying between 0 and 1, indicating local power sector unreliability. Therefore, we normalize the regional dummy coefficients as follows:
(3)
with γk, the coefficient of the region dummy k.
In the sub-section 5.3 we will add our indicator of local power sector quality in the regression of electricity intensity. One of our regressors will thus be estimated from a preliminary procedure. Pagan (1984) calls it a “generated regressor”. Using this generated regressor in the OLS regression should produce consistent estimates of all parameters, if the usual OLS assumption in the population holds—that the error term is uncorrelated with the set of explanatory variables (see Wooldridge, 2002, p.115-116). But the statistical inference leaves us with a problem due to the sampling variation in the estimated coefficients of the generated regressor. The standards errors and test statistics in the second step are invalid, because the estimated coefficients of the generated regressor depend also on the similar random sample used in the second stage estimation (it is not simply introduces heteroskedasticity in the error term). Thus, to make test statistics
11The related question in the BEEPS is: “Is electricity no obstacle, a minor obstacle, a moderate obstacle, a major obstacle, or a very severe obstacle to the current operations of this
establishment?”
22
asymptotically valid in the second stage procedure, we need to compute an adjustment to the common variance matrix estimate that accounts for the variability in the estimated coefficients of the generated regressor. We use a popular resampling method, i.e. bootstrapping, for obtaining standards errors, confidence intervals and p-values for test statistics.
5.2.2 Estimation (see table 2)
In table 2 we have estimated, from the base of BEEPS 2002, 2005 and 2009, an indicator of regional power sector quality. We compute, with a probit model, the probability that electricity is a major or very severe obstacle to the current operations of a firm. The
choice of the specification is based on the existing literature13. We include industry
dummies in the estimation to control for sector-specific characteristics possibly influencing firms’ differentiated needs in electricity input.
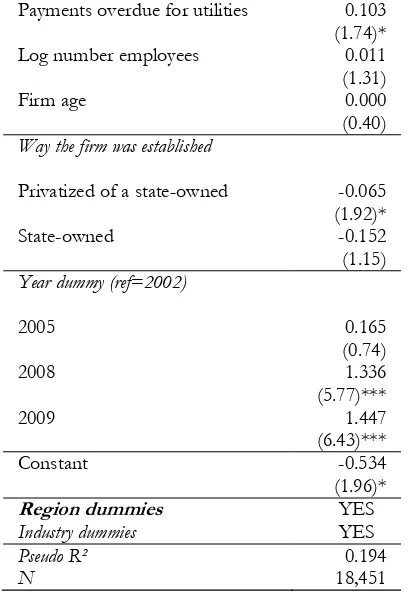
Our results do not exhibit strong evidence about the impact of the firms’ specific characteristics. Larger and older firms do not report a lower constraint of the access to electricity supply. However, firms declaring payments overdue for utilities tend to report significantly higher electricity obstacle. This is probably because non-paying enterprises get disconnected or because payments arrears are related to insufficiently reformed electricity sector. We have also added in our estimation year dummies to capturing some year’s fixed effects. We can see that in the last round of the BEEPS (2009), firms report significantly higher electricity obstacle. In addition, we have included in our estimate regional dummies, capturing power sector quality differences across different regions inside each country. Comparing to the reference region (Imereti, in Georgia) all other
local dummies display a negative and significant coefficient14. In order to obtain the
indicator of local electricity reliability, we have normalized the regional dummy coefficients as explained in the previous sub-section. The increase of this variable indicates thus a decreasing quality of the electricity supply at the local level. Finally, our indicator of local power sector reliability covers 137 regions in twenty-nine countries.
5.2.3 Local power unreliability and firm-level electricity intensity
In this last sub-section, we try to test whether firms facing higher regional unreliability of the power sector experience higher electricity intensity. We first introduce two different measures of the electricity sector quality on the whole sample, before testing our main assumption by splitting the sample according to the level of institutional reforms of the
13 Gelb et al. (2007) estimated for example the firms’ perceptions of some environmental constraints, including electricity. The paper by Vagliasindi (2004) analyzes the development of electricity infrastructures in transition economies using the information of BEEPS 2002 database. Highlighting some macroeconomic aspects determining the quality of electricity infrastructures, the author also uses several firm characteristic variables to explain the number of power outages faced by enterprises.
23
countries. The splitting is thus based on the EU belonging (see tables 5, 6 and 8) or alternatively to the extent of market-oriented power sector reforms undertaken in the countries (see below the robustness checks).
Main results (tables 3 and 4)
In tables 3 and 4, we present the results of the regression where we include the quality of
the electricity service at the local level – measured using subjective and objective
questions from BEEPS.
Our main finding is that, for the whole sample, lower reliability of the power sector has a positive but not significant effect on electricity consumption at the enterprise level. However, when we use our objective indicator of the power unreliability (table 4), the relationship becomes positive. As previously argued we expect the relationship between firm electricity intensity and the local power sector quality to be different as regarding the level of appropriate reforms introduced in a given country. Thus, throughout the whole sample the impact of the local power sector quality should not exert any significant effect. Indeed, the positive effect found in the table 4 is probably due to the weight of the countries with lower level of power sector reforms (about 2/3 of the firms in the sample). To take it into account we thus split our sample according to two basic indicators of institutional reforms: the belonging or not to the EU (tables 5, 6 and 8) and the extent of market-oriented reforms in the power sector (table 7).
Going into the details (see tables 5 and 6)
As we observe in figures 1, 3 and 4, EU new members implemented new reforms (EBRD index) in the power sector and achieved better performance in the electricity consumption. We think that firms behave differently according to the institutional framework they belong to. Hence we use the same specification as in table 3 and 4 but we split our sample in EU and non-EU members in 2008 (for the list of countries see table 9). Table 5 reports our main results. Column 1 simply regresses electricity intensity on local power sector unreliability, controlling for labour and capital use and potential scale effects. Outside the EU, lower quality of the local electricity supply is positively and significantly associated with higher electricity intensity. We introduce firm controls in column 2 and the form of ownership in column 3. The coefficient of power sector unreliability is not significantly affected by their inclusion although its size is somewhat
lower once we introduce the private de novo dummy (originally private, from start-up).
24
The size of the estimated effect is substantial. Following the table 5, an improving of the local power sector unreliability from the bottom quartile (the higher reliability of electricity sector) to the top quartile (the worst reliability of electricity sector) predicts a
19.7 percentage points increase in the firm level electricity intensity15. Overall, the
estimated effect runs from 20.7% (column 2) to 19.5% (column 4). Increasing the local
electricity quality indicator from the 75th to 50th percentile is still associated with a 9%
reduction of firm-level electricity intensity16.
In table 5, regression results are straightforward. If you are part of EU the unreliability of the power sector pushes the enterprise to decrease their electricity intensity. On the contrary, if an enterprise is not from a new member country the worse is the quality greater is the electric intensity. All other control variable’s coefficients remain similar compared to table 4 except for the share of employees with a degree. In the EU, and only in the EU, this share of educated people in the firm reduces the electricity intensity.
Nevertheless, our result might be affected by a reverse causality bias if one believes that in some regions electricity intensive firms are over-represented, regardless of their industrial sector. Firms in these regions declaring on average a higher electricity obstacle, because they are more affected. In order to deal with this issue we compute an alternative indicator of the local electricity supply quality. The average number of electricity interruptions should provide a good proxy of the continuity of power supply at the local level. Indeed, this indicator is based on an objective measure and should arguably be independent of firm-specific and unobservable technology.
We observe very similar results for all the variables when we use the regional mean outage number as a proxy for the quality of the power sector (table 6). Except for EU countries where the number of outages is not significant. This is probably due to the scarcity of significant outage occurrences. Following our results, the accuracy of one more outage in the region is related to 1% increase of firm-level electricity intensity in countries not belonging to the EU. Moreover, this result suggests that worst continuity of supply seems to dampen firm-level electricity inefficiency. But this effect is probably related to long, or even very long, interruptions. That is why there is no significant positive, neither negative, impact in the EU countries. In the EU area, the declared
outages should be of lower duration.17
15 The estimated effect is given by: [exp(0.195*0.922)-1]*100 = 19.7%, where 0.195 is the interquartile range of the local power sector unreliability indicator and 0.922 is the coefficient of this indicator in table 5, column 3.
16 The estimated effect is given with the same computation as previously but an interquartile range of the local power sector unreliability indicator of 0.093.
25
From our empirical study we learned that poor institutional quality and poor local power sector quality increase the electricity intensity. In the next paragraph we present some robustness checks.
Robustness tests (tables 7 and 8)
We present two robustness tests: we first change the subsample division. We divide our sample in reformed and unreformed power sector countries (table 7). In the second check we change the specification of our model and test the share of electricity cost in total variable costs instead of the electricity intensity.
For the first robustness check, we assume that the negative effect of the local electricity sector underdevelopment on electricity intensity is based on the level of institutional reforms undertaken in the power sector. Indeed, insufficiently reformed power sector is characterized by tariff below the cost recovery, inadequate supply and bad infrastructures. Thus, insufficient reforms will lead at the same time to firms’ electricity over-consumption and a bad quality of the provided service. We expect to find a negative impact of local electricity quality (measured by our subjective and objective variables) on electricity intensity. For this purpose we split our sample according to the level of undertaken power reforms in 2008 as indicated by the EBRD reform indicator (see section 3.2).
The threshold level is 3: insufficiently reformed = [2;3] and “well” reformed = ]3;4]. The choice of this threshold is based on two different reasons. We believe that an
insufficiently reformed power sector corresponds to an indicator equal or inferior to 318.
And, it may be noted that almost all the new EU members are comprised in the “well” reformed group, except Slovenia.
When we dividethe sample in subsamples, according to the quality of the reforms in
the electricity sector, we find very interesting and convincing results (table 7). If one is in the group of countries without doing reforms in the power sector (columns 1 to 4 in the table 7), the local unreliability of electric utilities is increasing the electricity intensity.
Thus, following column 2, moving from the 25th to the 75th percentile of the local power
sector unreliability distribution predicts a 26.3 percentage points increase in the firm level
electricity intensity19. The magnitude of the predicted effect is thus even larger than the
one we found for our main specification (table 5). The effect of the local power sector quality is not significant anymore if one is in the group of countries implementing the power sector reforms (columns 5 to 8). This provides micro-level evidences that
18 The power sector is still a state-owned monopoly, the rules for cost-reflective tariff setting are not formulated or implemented and there is no regulator, at least an independent one.
26
insufficiently reformed power sector is associated with a higher use of electricity by firms.
In our second robustness check we present an alternative specification. Our dependent variable is changed. Indeed, all other things equal, firms with higher mark-up will display higher electricity intensity, and our indicator of power quality may affect the dependent variable only through the denominator. We use a cost structure variable in order to check if, in the previous regressions, the sales’ variations are not driving all our results. All the firm’s characteristics remain significant and stable compared to our main specification (electricity intensity). For non-EU countries, poor local electric power quality, both in terms of outages and perceptions, increases the electricity cost share in total variable costs.
6 CONCLUSIONS AND POLICY RECOMMENDATIONS
In light of the growing importance of the energy issue in the former Soviet bloc countries, this study empirically analysed the role played by the local power sector unreliability in maintaining high firm-level electricity intensity. Based on micro-level survey of twenty-nine countries from Central Europe to Central Asia, we provide further insight about the necessity for non-EU countries to push ahead with deeper reforms in the power sector. For this purpose, and inspired by the previous work of Guiso et al. (2004), we built an innovative measure of the electricity supply quality at the local-level. A bad quality of the local power sector seems to dampen the firms’ ability to decreases their electricity consumption, if the country’s institutional framework is poor.
Our main findings both for subjective and objective (outages) measures of local electric power supply unreliability are consistent. EU countries of Central Europe are able to provide appropriate incentives to the firm’s electricity consumption behaviour. In this sense, our results indicate that bad reliability of the local power supply is negatively related to firm-level electricity intensity. At the contrary, in non-EU (or insufficiently
reformed) countries power sector unreliability increases firm’s electricity intensity. The
size of the estimated effect is substantial. We estimated about a 20% percent potential reduction of firm’s electricity intensity associated with an improvement from the 75th
percentile to the 25th percentile of the distribution of the local power sector unreliability
variable.
27
Our results have some policy implication: if transition countries want to improve the firm’s energy efficiency, they need to create incentives for new investments and promote high labour productivity activities. Transition countries also need to improve the quality of electricity supply at the local level, especially when the power sector is not reformed. To make it happen, a detailed assessment of the local supply continuity should be established by an independent regulator.
Our policy recommendations are in line with the World Bank reports of 2012 and 2010 and the EBRD report 2011. Broadly speaking, countries of the former Soviet bloc need to prioritize the electricity efficiency measures in their political agendas. The set of basic power sector reforms should be reinforced. In particular, cost-recovery tariffs and strong independent regulatory authority must be established.
These broad elements should be combined with more specific reforms. To improve the quality of electricity supply, the financial reliability of power companies should be increased and generation capacities should be offset. Their business strategies should focus on the demand-side management and favour extensive margins (new connections) instead of intensive margins (larger energy consumers). For this purpose, power sector bureaucratic barriers for new connections must be reduced and broad-based voltage scope should be provided to ensure the good functioning of electricity-saving equipments. Moreover, an appropriate metering system is substantial: to improve demand-side management, decrease power companies commercial losses and ensure individual voltage quality verification.