Munich Personal RePEc Archive
Small Share of the Islamic Banks in
Indonesia, Supply-side Problems?
Kariastanto, Bayu
10 July 2013
Online at
https://mpra.ub.uni-muenchen.de/61248/
Small Share of the Islamic Banks in Indonesia, Supply-side Problems?
Bayu Kariastanto*
Abstract
About 21 years after establishment of the first Islamic banks in Indonesia, the share of Islamic banks is still small. About 86 percent Indonesian are Muslim, yet the asset share of Indonesian Islamic banks is only about 4 percent. Since Islamic scholars unanimously argue that bank interests are prohibited, we could expect that asset share of Islamic bank in Muslim-majority country is at least equal with Muslim share in the total population because all Muslims should choose Islamic banks over conventional banks. In this paper, we want to investigate what is the cause of small share of Islamic banks in Indonesia. To be more precise, whether it is caused by non-technical factor or it is caused by supply-side problems such as poor Islamic bank services or lower Islamic bank returns, or to be more extreme, it may be caused by people do not recognize Islamic banks. Using demand estimation model and elasticity exercises, we find that costumers appear to group separately Islamic and conventional banks, meaning that there is recognition and market segmentation. However, Islamic banks do not have greater market power compare to conventional banks. We argue that supply-side problems such as high services fee and low bank returns are not the reason why the market share of Islamic banks is so low. We also argue that non-technical factors such as the early-mover advantages and lack Muslim awareness may become the reasons. We also find that Islamic banks will not be able to effectively increase their market share by competing in price.
Keywords: Islamic bank, small asset share, faith, supply side problem, partial equilibrium
JEL Classification: G02, G11, G21
I. Introduction
In the last decades, we witness rapid emergence of Islamic finance. Kassim (2010) finds that
total market of Islamic securities grows about 15-20 percent annually and the market share of
Islamic finance will increase further due to the rapid growth of Islamic banking and finance
industry. Institutions trying to access funds through issuing Islamic securities/funds are also
increasing. The International Organization for Securities Commission (IOSCO) reports that there
were 100 Islamic equity funds worldwide with assets estimated around 3.3 billion USD in 2003
and their assets grew about 25 percent in the past seven years. Cakir and Raei (2007) find that
sukuk (Islamic bonds) issuance was also increasing rapidly and globally, it grew around 45
percent in 2006.
The Islamic finance is growing faster in the Muslim-majority countries. Beck, Kunt, and
Merrouche (2010) find that the market share of Islamic banks in Muslim-majority countries
reached about 16 percent in 2005, increasing rapidly from only about 6 percent in 1994. This
increase in the market share contributes significantly in increasing the market share of Islamic
banks in global market which had reached 2 percent. Godlewski, Ariss, and Weill (2010) point
out that sukuk Issuance in Indonesia, Malaysia, and the Gulf Cooperation Council (GCG)
countries grew quickly from only 7.2 billion USD in 2004 to 39 billion USD in 2007 (43 percent
of total global sukuk outstanding which was around 90 billion USD).
The rapid growth in Islamic finance in the Muslim-majority countries is still considered not
sufficient to close the gap between conventional and Islamic finance, even in Islamic banking
industry which is considered as the most advance industry in Islamic finance. For instance, in the
still very small after about 20 years from establishment of the first Islamic bank in those
countries. Assets of Islamic banks in Malaysia, which 61 percent of its populations are Muslim
and Islam is the state religion, are only 19 percent in 2011. The gloomier picture is in Indonesia.
About 86 percent Indonesian are Muslim, yet the asset share of Indonesian Islamic banks is only
about 4 percent. Since Islamic scholars unanimously argue that bank interests are prohibited, we
could expect that asset share of Islamic bank in each Muslim country is at least equal with
Muslim share in the total population because all Muslims should choose Islamic banks over
conventional banks.
There are three possible reasons why market share of Islamic bank is small in Muslim-majority
countries: Muslim has lack awareness about Islamic banks, infrastructure and quality of Islamic
banks are significantly less than conventional bank, or conventional banks have non-technical
advantages compared with Islamic banks. As the result, the advantage of the Islamic bank which
is its wider demands because it could meet both demands for Islamic and conventional banking
services will never been observed.
Surprisingly, very few quantitative studies have been conducted to investigate whether Islamic
banks have “abnormal” market power (such as greater market demand) from their religious
customers, their unconditional loyal clients and also to investigate what the reason for small
market share of Islamic banks. One of these rare studies is study conducted by Weill (2010). He
compares market power of Islamic banks and conventional banks in the 17 countries over the
period 2000-2007 to investigate whether Islamic banks have greater power because they have
unique “religious” clients. He finds no significant different on market power between Islamic
and conventional banks. Surprisingly when controlling other variables, he finds that market
incentives applied across the bank’s type. Therefore, it is not surprising if Islamic bank could not
close the gap with conventional banks.
To enrich quantitative studies regarding market power of Islamic institution especially Islamic
bank, in this paper, we want to investigate what is the cause of small share of Islamic banks in
Indonesia. To be more precise, whether it is caused by non-technical factor or it is caused by
supply-side problems such as poor Islamic bank services or lower Islamic bank returns or, to be
more extreme, it may caused by people do not recognize Islamic banks. In this paper, we also
want to know whether Islamic banks have greater market power.
Using demand estimation model and Indonesian banking data, we test whether costumers in
Indonesia differentiate between sharia and conventional banks. Then, we will investigate
whether Islamic banks have greater market power and see whether pricing factors affect small
market share of Islamic banks. We also test whether competing in services such as reducing fees
and increasing returns could effectively improve market share of Islamic banks.
We find that costumers appear to group separately Islamic and conventional banks, meaning that
there is recognition and market segmentation. However, the Islamic banks do not have greater
market power compare to conventional banks. We argue that supply-side problems such as high
services fee and low bank returns are not the root of low market share of Islamic banks, therefore
non-technical factors such as early-mover advantages and lack Muslim awareness may become
the reason why Islamic bank’s market share is so small in Indonesia. We also argue that Islamic
II. Islamic Banks in Indonesia
The development of Islamic bank in Indonesia follows the dual banking system which allows
both conventional and Islamic bank to be present in the banking system. People are free to
choose any bank according their preferences. As Muslim-majority countries, we could expect
that most people will choose Islamic banks over conventional banks in the dual system and
Islamic bank gradually become the leading bank.
The first Islamic bank in Indonesia is Bank Muamalat Indonesia (BMI). BMI was initiated by
National Sharia Board (Majelis Ulama Indonesia/MUI). BMI officially began its operation on
May 1992. The uniqueness of development banks of Islamic in Indonesia is bottom up process.
The initiatives come from people, not from government. In other Muslim- majority countries, the
process mostly is top down which government has the first initiative to establish Islamic banks.
Until currently, MUI is still actively involved in development of Islamic finance in Indonesia,
particularly MUI and its National Syariah Board (DSN-MUI) have responsibility to supervise the
sharia compliance of Islamic financial institutions.
The law number 10 year 1998 regarding the banking set another milestone for the development
of Islamic banking. Conventional banks are allowed to provide services based on the sharia
principles through the establishment of sharia business unit (Unit Usaha Syariah/UUS). This
policy significantly improves the infrastructure of Islamic banking since the shariah business unit
could utilize their parent’s infrastructure, such us branch offices and teller machines. Since April
2007, the Bank Indonesia has permitted the sharia business unit to operate outside its parent
The next milestone in the development of Islamic banking in Indonesia is the issuance of the law
number 21 year 2008 regarding the Islamic bank. This law is the first law regulating exclusively
Islamic bank. This law encourages conventional banks to spin off their sharia business unit to
strengthen the line between Islamic and conventional banks.
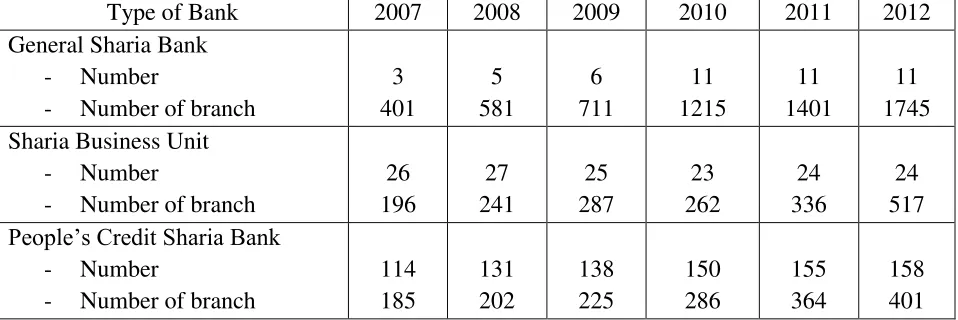
There are three types of Islamic banking activities in Indonesia: Islamic bank, commercial bank’s
sharia business unit, and people credit sharia bank (BPR Syariah). Table 1 summarizes
[image:7.612.68.547.342.502.2]development of all types of Islamic bank in Indonesia.
Table 1
Islamic Bank by Type 2007-2012
Type of Bank 2007 2008 2009 2010 2011 2012
General Sharia Bank
- Number
- Number of branch
3 401 5 581 6 711 11 1215 11 1401 11 1745 Sharia Business Unit
- Number
- Number of branch
26 196 27 241 25 287 23 262 24 336 24 517
People’s Credit Sharia Bank
- Number
- Number of branch
114 185 131 202 138 225 150 286 155 364 158 401
Source: Bank Indonesia
Almost every year, the Islamic bank grows faster than conventional bank. However, the growths
are not sufficiently high to be able to closing the gap between Islamic and conventional banks.
Indonesia currently has 11 Islamic banks and 23 sharia business units, significantly less than the
number of conventional banks of 109. Asset share of Islamic banks and sharia business units is
III. Data and Methodology
We collect banks’ annual financial reports 2008-2011 from the Bank Indonesia. Our sample
covers all Islamic banks and 34 conventional banks or about 30% of population of conventional
banks. Those conventional are randomly chosen. Our purpose not including all conventional
banks is to balance data from Islamic banks and data from conventional banks since the number
of Islamic bank is only 11 banks.
Our approach is to estimate demand on deposit for both Islamic and conventional banks, then we
test whether costumers differentiate Islamic and conventional banks. We also estimate a market
share to price elasticity both for Islamic and conventional bank to know whether pricing policy
(lowering service charges or increasing deposit returns) could effectively increase market share
of Islamic bank.
We follow Berry (1994) and Dick (2008) in modeling demand for bank deposits. The demand is
modeled as a discrete choice. We assume that the utility function is a linear form such that the
conditional indirect utility of consumer i from choosing bank’s j services in market k is:
(1)
Where represent interest rates/returns paid by bank, represents service charges on bank
services, represents observed characteristic, represents unobserved bank characteristics,
and is a mean zero random disturbance.
Assuming that distribution of follows exp(-exp(- )), market share for bank j could be
characteristics. Market share of bank j could be predicted by
∑ . Therefore,
predicted market share only depends on mean utility level, . As in Berry (1994), by setting the
predicted market shares equal to observed market shares and normalizing the mean utility of the
outside good, we could obtain:
(2)
which represents market share of outside good. We could estimate parameter in equation (2)
using ordinary linear regression, as well as handling possible endogeniety on price using
standard linear instrumental variables method.
To investigate whether consumers differentiate between Islamic and conventional banks, we use
nested logit model as well as to reduce restriction regarding no correlation of consumer
preference within bank categories (detailed online for this model, see Berry, 1994). Under nested
logit model, equation (2) becomes:
( ) (3)
Where represent market share of bank j, which belong to group g, as the fraction of the total
group g share. Particularly, we are interested in . If it is statistically significant, customers
differentiate between Islamic and conventional banks. In this regression, we also use
instrumental variables method to handle possible endogeniety problem.
IV. Discussion
Table 2 shows the descriptive statistic of variables. The average Islamic banks’ services fees and
conventional banks’ service fees of 5.2 percent and interest rate of 6.5 percent, meaning that
Islamic banks’ service fees are more favorable but Islamic banks’ returns are less favorable. It
also means that the Islamic banks still have room to improve efficiency in credits management
since their deposit returns are much less than conventional banks deposit interest rates.
As expected, data shows that number of sample is decreasing on bank size. We have 30 small
banks, 12 medium banks, and 3 big banks in our sample.1 According to their owners, our sample
includes 22 domestic banks, 15 state-owned banks, and 8 foreign banks.2
Table 4 presents our regression results. Columns 1 and 2 provide results of logit model
regression. The coefficient signs are as we predicted, negative on service fee and positive on
deposit interest rate/profit-sharing returns. However, only service fee is statistically significant,
meaning that consumers consider service fees and less consider interest rate/returns in
determining where they place their deposits.
We are also interested in the sharia variable. Sharia is dummy variables which takes value of 1 if
bank is Islamic bank, otherwise take value of 0. Coefficient for sharia is positive but statistically
not significant, meaning that Islamic banks do not have greater market demands compared with
conventional banks.
Table 4 columns 3 and 4 provide results of the nested-logit model. The nested-logit model has
greater flexibility than the logit model because it allows interactions between product and
1
Definition of small, medium, and big bank are banks which have assets less than Rp. 2 trillion, banks which have assets between Rp. 2 trillion and Rp. 100 trillion, and banks which have assets more than Rp. 100 trillion respectively.
2
costumer characteristics while keeping the model fairly simple. As discussed in Berry (1994) and
Dick (2008), consistent estimation of the parameter will not require additional instruments for
the within-market of given bank share ( ) to tackle its likely endogenous process.
The results in the nested-logit model are similar to logit model which is statistically significant in
the services fee and not statistically significant in the interest rates or the profit-sharing returns.
Coefficient for sharia is also positive but statistically not significant, meaning that the Islamic
banks do not have greater market demands.
The parameters in two models are statistically significant, meaning that markets appear to
group differentially Islamic and conventional banks. In other word, there is market segmentation
in Indonesian banking market. The parameter is correlation parameter and it is precisely
estimated, with a value between 0.2 to 0.3, indicating the nested strategy is appropriate.
Overall, there is still market segmentation but this segmentation does not create the greater
market power for the Islamic banks to be able to close the gap with the conventional banks. The
Islamic banks’ small market share in Indonesia is also not caused by price factors. Our regression
shows, regarding price factor, only service fees statistically affect the bank’s market share. As
mentioned earlier, the average of the Islamic bank’s service fees is much less than the
conventional bank’s service fee.
We argue that the Islamic bank’s small market share in Indonesia is not caused by supply side
problem, such as price factor as we have explained above. This may be caused by non-technical
factor. One possible non-technical factor is the early-mover advantages as the conventional
banks entering the bank market much earlier than the Islamic banks. Berger and Dick (2007)
earlier will have greater market share than the later entrances. Another possible reason is lack
Muslim awareness as they still prefer conventional banks when Islamic banks are available and
also competitive.
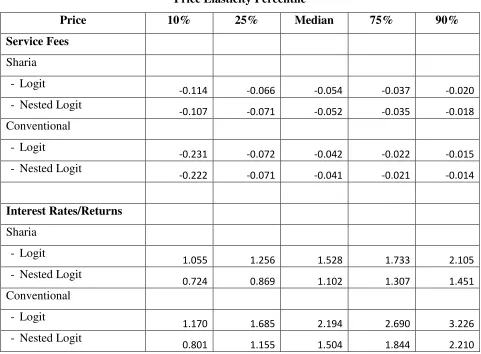
Table 5 provides price elasticity for each bank category in various percentiles (10th, 25th, 50th,
75th, and 90th percentiles) to help interpretation of the coefficient magnitudes.3 The median
elasticity of service fee are negative and about the same under the logit model and the
nested-logit model. The median elasticity of service fee for Islamic bank and conventional bank are
about -0.05 and about -0.04 respectively, meaning that 1 percent decrease in bank’s service fees
will lead to 0.05 percent increase in Islamic bank’s market share or 0.04 percent increase in
conventional bank’s market share.
The median elasticity of interest rates/profit-sharing returns for the Islamic bank is 1.5 (1.1 in the
nested-logit model) and for the conventional bank is 2.2 (1.5 in the nested-logit model), meaning
that 1 percent increase in profit-sharing returns or interest rates will lead to 1.5 percent increase
in the Islamic bank’s market share or 2.2 percent increase in the conventional bank’s market
share.
This elasticity exercise shows that the Islamic banks should prefer competing in service fee
rather than competing in returns since their service fee elasticity is greater than conventional
banks. However, the room for additional service fee reduction is limited because the average
Islamic bank’s service fee is already low and much less than conventional banks. The room for
3
We calculate own price elasticities by under logit model, while own
price elasticities under nested logit model by
efficiency improvement is still available in the lending since the average of profit-sharing returns
is much less than interest rate in conventional banks. However, the Islamic banks should not be
dragged into interest rate “war” with the conventional banks since the magnitude of interest rate
elasticity is higher than profit-sharing return elasticity. Overall, competing in the price is
unfavorable for the Islamic banks because the difference in service fee elasticity between Islamic
and conventional banks is much less than the difference between profit-sharing return elasticity
and interest rate elasticity. This result is as we expected since Islamic banks have the “religious”
clients, more loyal customers, who select banks not only base on prices.
V. Conclusion
Using Indonesian banking data from 1998 to 2011, we estimate demand for deposits both under
logit model and nested-logit model, then we perform elasticity exercise for Islamic and
conventional banks.
We find that the average of the Islamic bank’s service fees and profit-sharing returns are lower
than the average of the conventional bank’s service fees and interest rates. We also find that
costumers appear to group separately Islamic and conventional banks, meaning that there is
recognition and market segmentation. However, Islamic banks do not have greater market power
compare to conventional banks. We argue that supply-side problems such as high services fee
and low bank returns are not the root of the low market share of Islamic banks. We argue that the
non-technical factors such as early-mover advantages and lack Muslim awareness may become
Our elasticity exercises show that the Islamic banks should prefer competing in the service fees
rather than competing in the returns since their elasticity is greater than conventional bank’s
elasticity. However, the Islamic banks may not be able to effectively increase their market share
by competing in price because the difference in service fee elasticity between Islamic and
conventional banks is much less than the difference between profit-sharing return elasticity and
References
Beck, T., Kunt, A., and Merrouche O. (2010), “Islamic vs. Conventional Banks: Business Model,
Efficiency, and Stability”, The World Bank’s Policy Research Working Paper No. 5446.
Berger, A., and Dick, A. (2007). Entry into Banking Markets and the Early-Mover Advantages.
Journal of Money, Credit, and Banking, 39, 775-807.
Berry, S.T. (1994). Estimating discrete-choice models of product differentiation. RAND Journal of Economics, 25, 242–262.
Cakir, S., and Raei, F. (2007), “Sukuk vs. Eurobonds: Is There a Difference in Value-at-Risk?”,
International Monetary Fund’s Working Paper No. WP/07/237.
Dick, A.A. (2008). Demand estimation and consumer welfare in the banking industry. Journal of Banking and finance, 32, 1661-1676.
Kariastanto, B., and Ihsanin A. (2012). Could regulator materialize potential demand for Islamic securities? Evidence from Indonesia. Bapepam-LK and IRTI IDB’s International Conference on Islamic Capital Market.
Kassim H. (2010), “Global Financial Crisis and Integration of Islamic Stock Markets in
Developing and Developed Countries”, Institute Development Economics-Japan External
Trade Organization’s VRF Series No. 461.
The Islamic Capital Market Task Force of the International Organization of Securities Commissions (2004), Islamic Capital Market Fact Finding Report 2004.
Appendix
Table 2 Summary Statistic
Variables Mean Std.
deviation
Min Max
Market share based on asset 0.026 0.067 0.00013 0.407
Market share 0.026 0.047 0 0.234
Market share per group 0.051 0.119 0.000007 0.722
Outside good share 0.026 0.047 0 0.234
Services fee 0.047 0.176 0.001 1.601
Interest rate or returns 0.061 0.026 0.009 0.182
Wages rates 0.045 0.086 0.006 0.834
Provisions/Loans 0.033 0.061 0 0.618
Liabilities/Assets 0.823 0.160 0.041 1.069
Fix Assets/ Assets 0.017 0.026 0.0002 0.179
Interconnection 0.175 0.727 0.0001 9.014
Small (30 banks) 0.718 0.451 0 1
Medium (12 banks) 0.218 0.414 0 1
Big (3 banks) 0.064 0.246 0 1
Domestic (22 banks) 0.494 0.502 0 1
State-owned (15 banks) 0.340 0.475 0 1
Table 3
Description of Variables
Variables Description
Market share based on asset Bank assets/total market assets
Market share Bank customer deposits/total market deposits
Market share per group Bank customer deposits/total market deposits of Islamic
banks or conventional banks
Outside good share Deposits from other banks/total market deposits to other
banks
Services fee Non-interest operational revenues/customer deposits
Interest rate or returns Interest expenses or profit-sharing expenses/costumer
deposits
Wages rates Human resources expenses/(0.5*loans+0.5*customer
deposits)
Provisions/Loans Credit provisions/loans
Interconnection Deposit to other banks/loans
Small Banks which have assets less than Rp. 2 trillion. There are
30 small banks in our observations.
Medium Banks which have assets between Rp. 2 trillion and Rp. 100
trillion. There are 12 medium banks in our observations.
Big Banks which have assets more than Rp. 100 trillion. There
are 3 big banks in our observations.
Domestic Majority share holders are Indonesians. There are 22
domestic private banks in our observations.
State-owned Majority shareholders are Indonesian governments, both
central and/or local governments. There are 15 state-owned
banks in our observations.
Foreign Majority shareholders are foreigners. There are 8 foreign
Table 4
Regression Result
Explanatory Variables 1 2 3 4
Services fee -3.387
(1.579)** -3.21 (1.559)** -4.143 (1.551)*** -4.031 (1.474)***
Interest rate or returns 35.171
(23.888) 35.796 (24.173) -31.387 (20.666) -8.758 (24.42)
Sharia 1.032
(0.711)
0.639
(0.637)
Log market share per group -0.302
(0.124)**
-0.271
(0.117)**
Constant -1.201
(1.470) -1.440 (1.59) 1.472 (1.02) 1.472046 (1.02)
Number of Observations 150 150 150 150
Table 5
First Stage Regression Result
Explanatory Variables 1 2
Wages rates 0.12
(0.196)
0.074
(0.033) ***
Provisions/Loans 0.055
(0.21)
0.041
(0.035)
Liabilities/Assets -0.101
(0.12)
0.049
(0.02)**
Fix Assets/ Assets -0.378
(0.509)
0.136
(0.085)
Interconnection 0.068
(0.018)***
0.003
(0.003)
Medium -0.035
(0.035)
-0.01
(0.006)*
Big -0.058
(0.055)
-0.01
(0.009)
State-owned 0.0122253
(0.03)
-0.007
(0.005)
Foreign 0.183
(0.04)***
-0.003
(0.007)
Constant 0.095
0.105
0.019
(0.018)
Number of Observations 156 156
R-squared 0.3 0.1
Table 6
Price Elasticity Percentile
Price 10% 25% Median 75% 90%
Service Fees
Sharia
- Logit
-0.114 -0.066 -0.054 -0.037 -0.020
- Nested Logit -0.107 -0.071 -0.052 -0.035 -0.018
Conventional
- Logit
-0.231 -0.072 -0.042 -0.022 -0.015
- Nested Logit
-0.222 -0.071 -0.041 -0.021 -0.014
Interest Rates/Returns
Sharia
- Logit
1.055 1.256 1.528 1.733 2.105
- Nested Logit
0.724 0.869 1.102 1.307 1.451
Conventional
- Logit
1.170 1.685 2.194 2.690 3.226
- Nested Logit 0.801 1.155 1.504 1.844 2.210
Under logit model, own price elasticities are , while own price elasticities under nested logit model are
. For detail derivation of